What's New
NEW FEATURES, ADDITIONS, IMPROVEMENTS AND MORE
Whether it's a brand-new feature you've never seen before or a powerful improvement to a tool you already love, we're always working on something new and exciting behind the scenes here at StockCharts. Browse the list below to learn more about our latest releases and see what we've been up to.
-
7/17/26
Introducing The Screener: The Fastest Way To Find Your Next Great Trade
The full power of our industry-leading scan engine in a user-friendly package - with no custom scan writing required
Say hello to the all-new StockCharts Screener, the fastest way to uncover your next great trade. We've put the full power of our industry-leading scan engine right at your fingertips, without the added time or complexity of writing your own custom scans. With an intuitive, easy-to-use interface that doesn't sacrifice power for simplicity, you'll be running advanced, pro-grade screens in just a few clicks.
To get started, simply select the groups and filters you want to search for. We'll scour the markets instantly and automatically return the results that match your criteria. Review your matches in convenient table or chart views, and save the best targets straight to your StockCharts account with ease.
And when you've locked in your favorite criteria, you can even save your screens to run again in the future or refine further down the road. Whether you're hunting for breakouts, fundamental standouts or the strongest names in a hot sector, the new Screener helps you find them faster than ever before.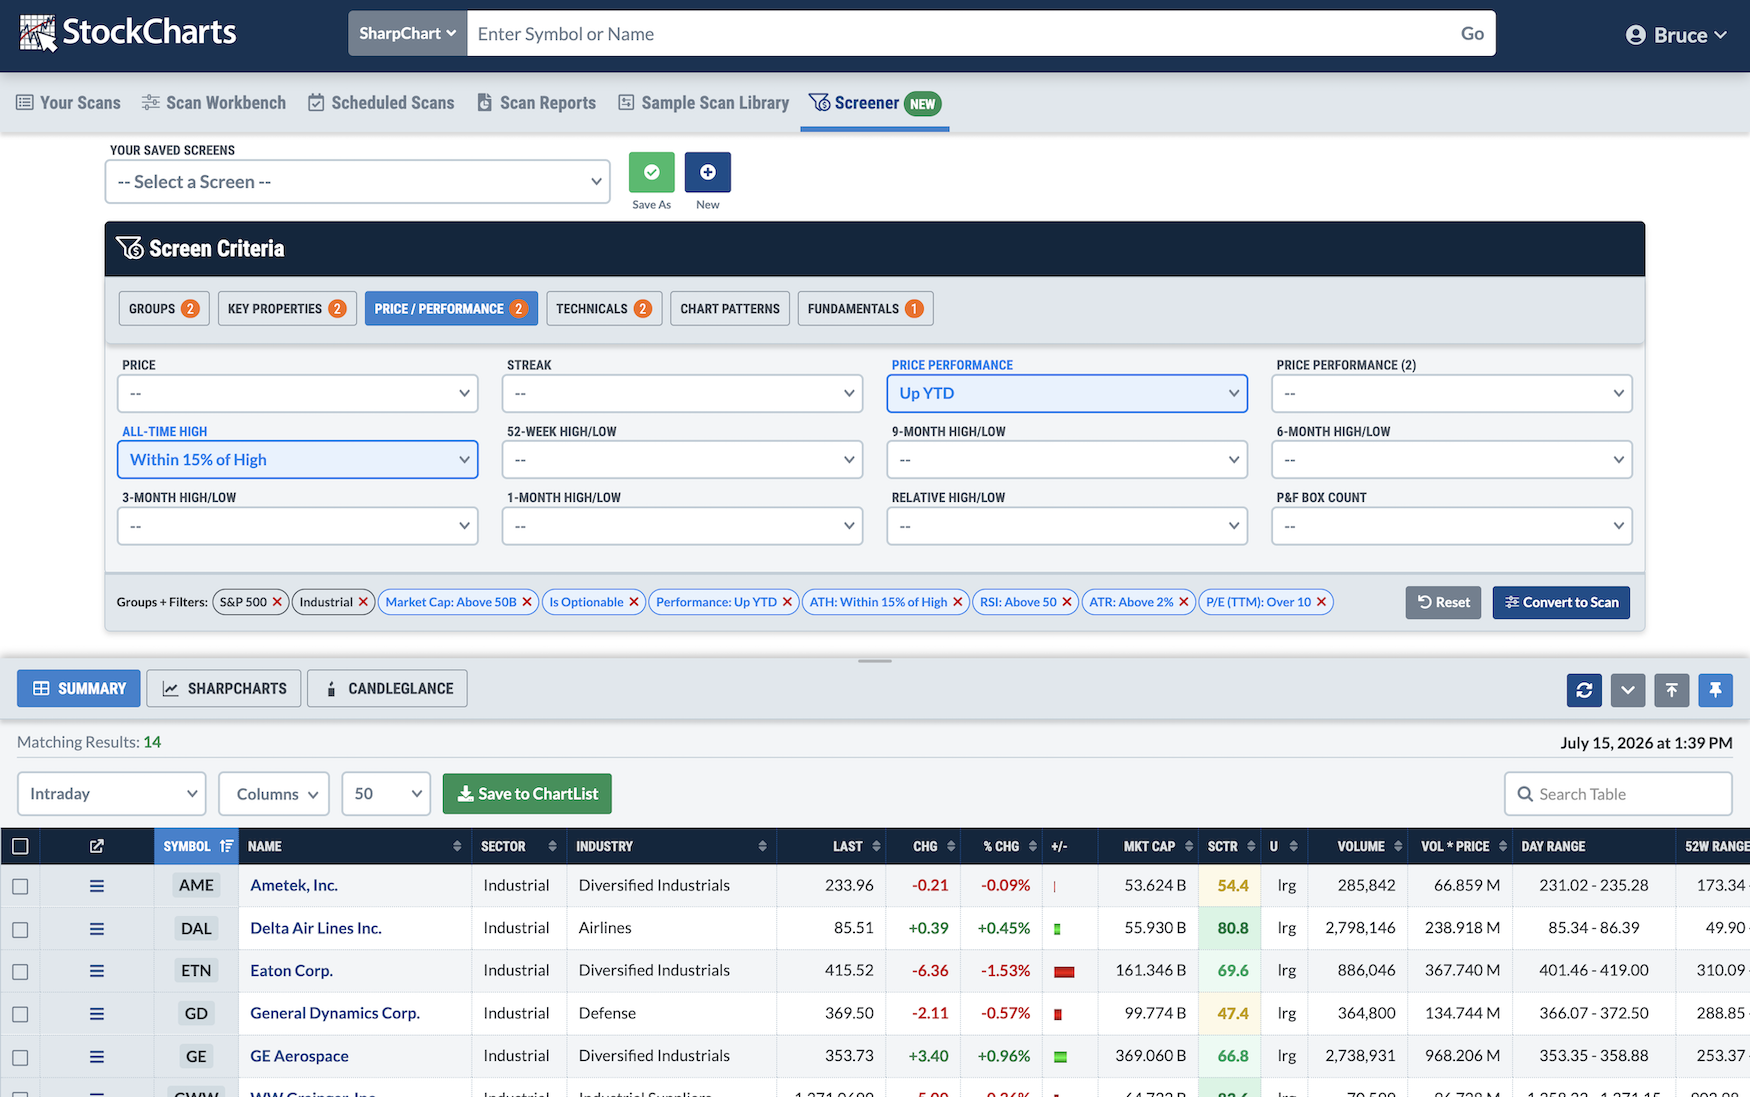
-
7/8/26
The New "Your ChartLists" Page
A dedicated home for Your ChartLists, designed to help you organize and manage your saved charts and lists with ease
We've introduced the new Your ChartLists page, giving this cornerstone feature of StockCharts an enhanced experience with a dedicated home. Click your name in the upper right corner of any page around the site and you can navigate to the Your ChartLists page in the menu that appears. This clean, focused page built specifically for organizing and managing your custom lists and the saved charts within will make everyday chart management faster and more efficient.
One highlight is the ability to empty ChartLists in just a couple clicks. Select the lists you care to clear, and you'll be able to wipe them clean while leaving the list itself in place. This is crucial for running Scheduled Scans that save results into existing ChartLists. It's a small change that saves real time, letting you spend less effort on housekeeping and more on the analysis that actually moves the needle.
From sorting and reorganizing to cleaning up and starting fresh, the new Your ChartLists page makes it easier than ever to keep your entire charting workflow neat, tidy and ready to rock.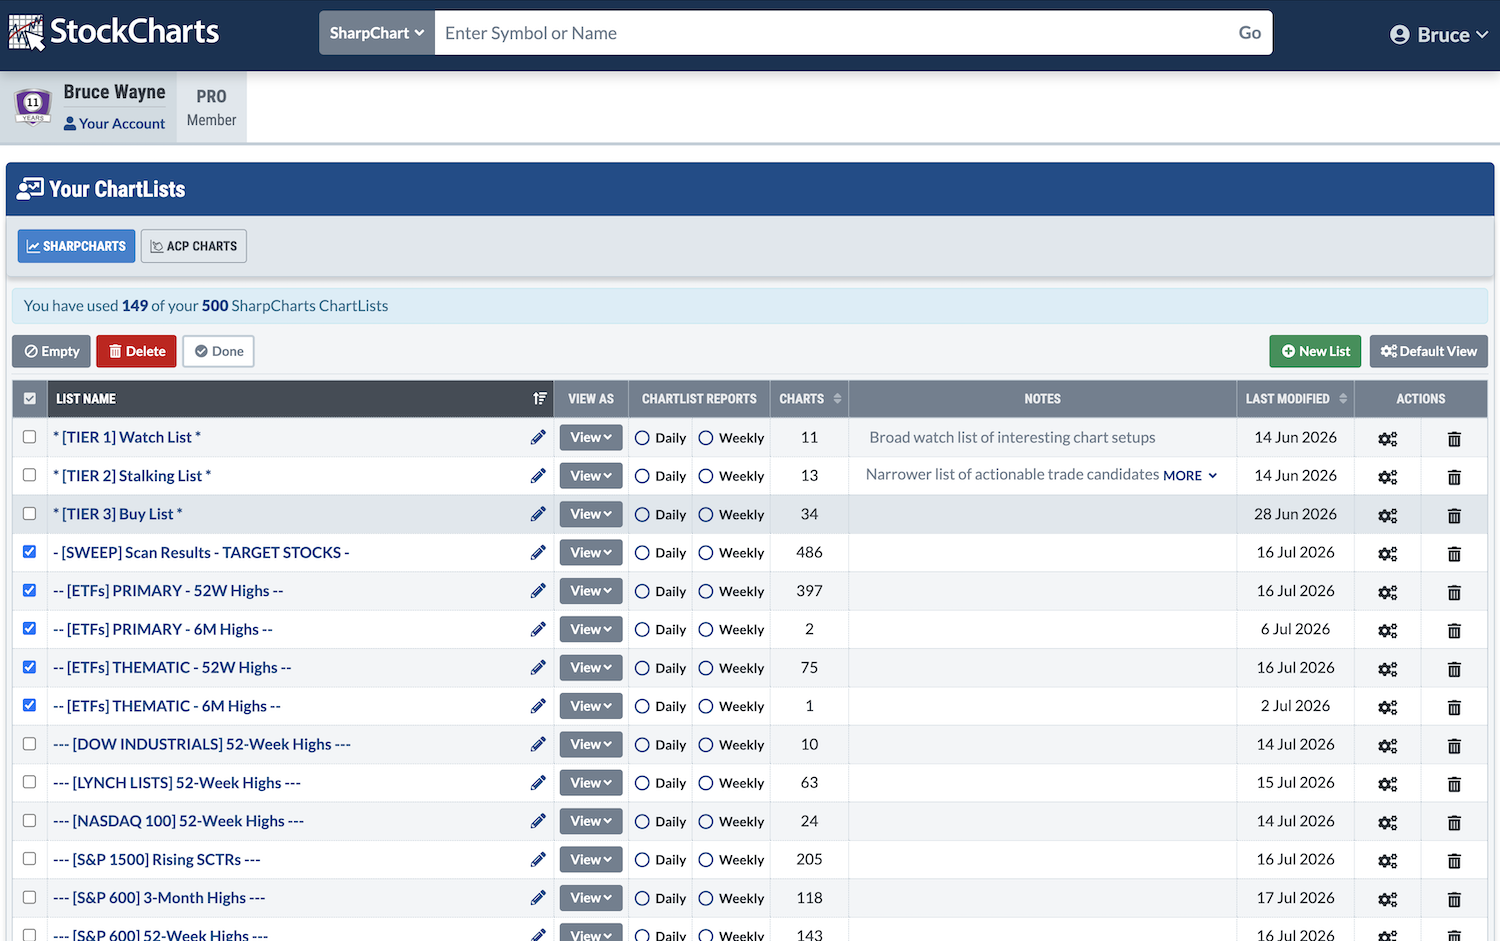
-
6/19/26
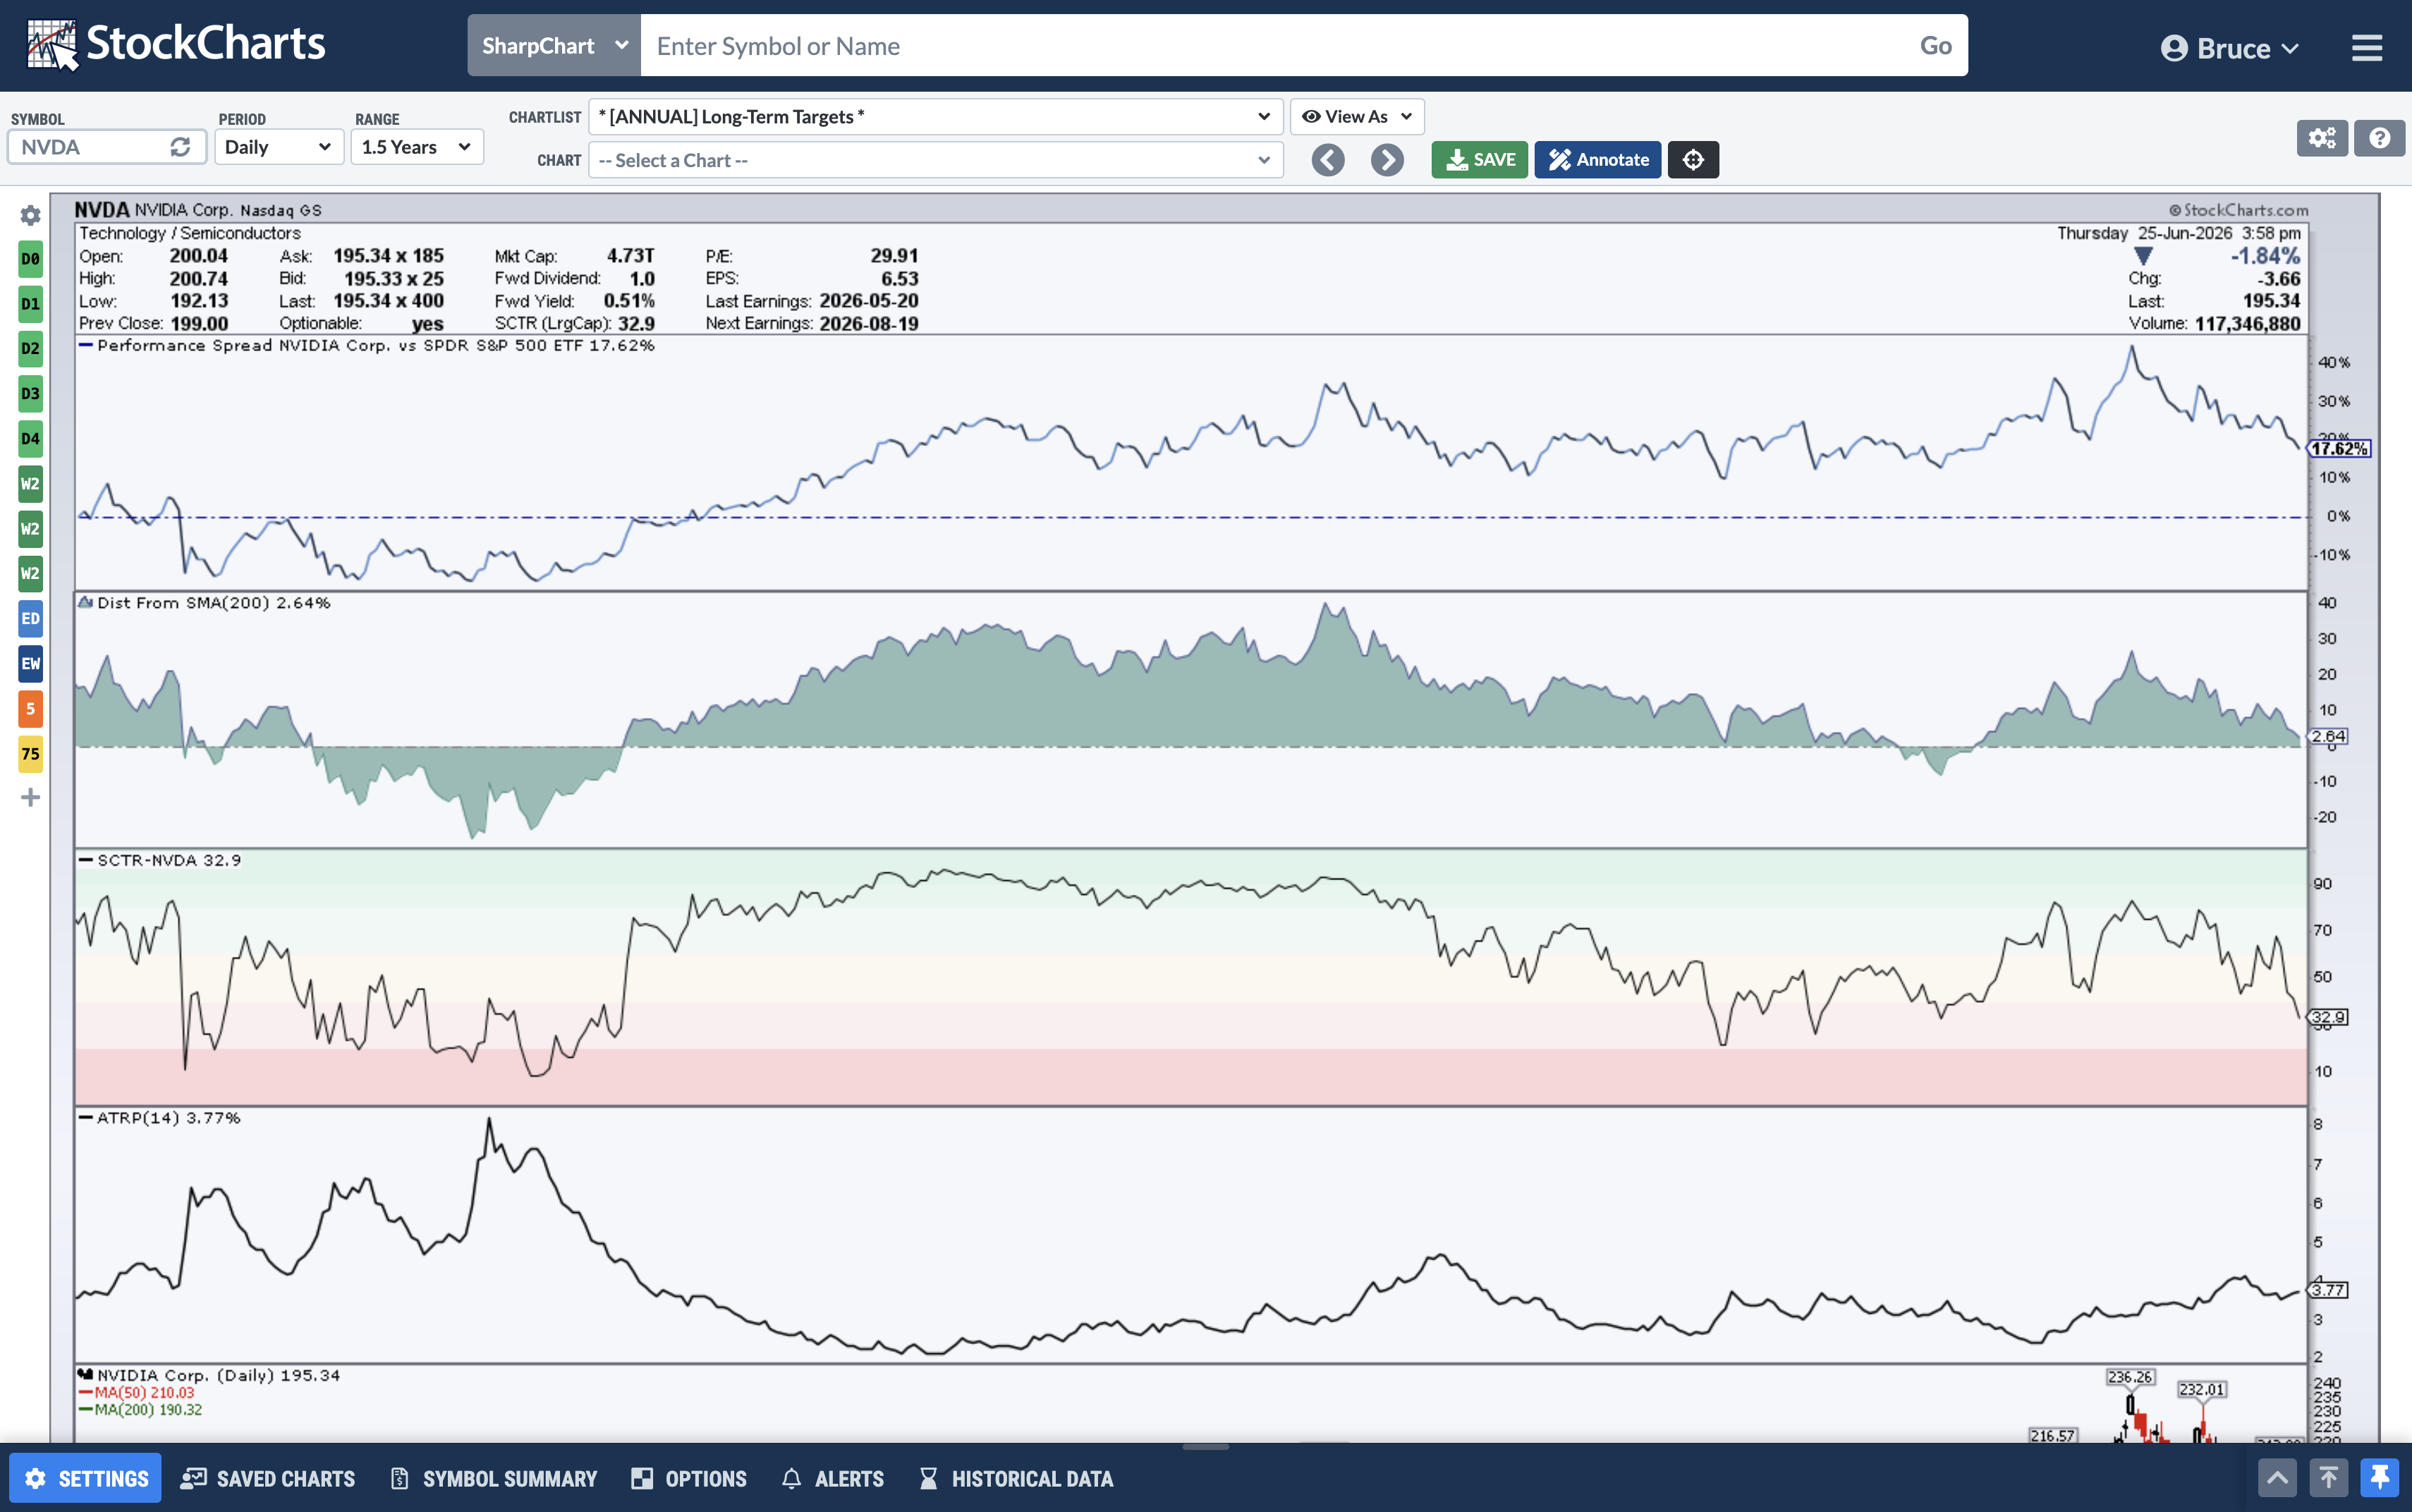
14 New And Enhanced Indicators For SharpCharts
Expand your technical toolkit with powerful new overlays, oscillators, momentum indicators and data visualizations
We've added a fresh batch of indicators to SharpCharts — plus an enhancements to two fan favorites - giving you even more ways to measure trend, momentum, volatility and relative performance. Here's what's new and improved:
- Performance Spread — plots the performance difference between two symbols so you can track relative strength and rotation at a glance.
- DEMA & TEMA — the Double and Triple Exponential Moving Averages reduce lag for faster, smoother trend tracking than a traditional EMA.
- Alligator — Bill Williams' three-line indicator that helps you identify trend direction and tell trending markets apart from sideways trading ranges.
- Average True Range Percent (ATRP) — expresses Average True Range as a percentage of price, so you can compare volatility across stocks trading at very different price levels.
- Distance From Moving Average — measures how far price has stretched above or below a moving average, helping you spot overextended moves and potential reversion points.
- Distance To & From Highs/Lows — a set of four related indicators (Distance From Highs, Distance From Lows, Distance To Highs and Distance To Lows) that show how far price currently sits from recent highs and lows, and how far it would need to travel to reach them.
- Highest High Value & Lowest Low Value — plot the highest high and lowest low over a chosen lookback period to quickly pinpoint key breakout levels and support/resistance zones.
- Volume By Price (enhanced) — you can now position the Volume By Price bars on either the right or the left side of your chart to match your preferred layout.
- SCTR (enhanced) — now includes helpful color-coded shading to more clearly identify strong and weak value ranges.
Whether you're analyzing stocks, ETFs, indexes or commodities, you'll find these additions in the Overlays and Indicators menus of the SharpCharts Workbench, available now alongside all your other favorites.
-
4/25/26
New Chart Tabs On The Market Summary Dashboard
Explore more market data faster with tabbed chart views throughout the Market Summary page
We've added new chart tabs across the Market Summary Dashboard, making it easier than ever to switch between curated chart views without leaving the page. Each tab gives you instant access to a focused set of pre-built charts, so you can move from one area of the market to the next with a single click.
Whether you're reviewing major indexes, sector performance, or studying asset classes like Commodities and Currencies, the new chart tabs help you stay oriented and drill down more efficiently. Look for the tabbed chart areas throughout the dashboard and click through to explore the views that matter most to your analysis.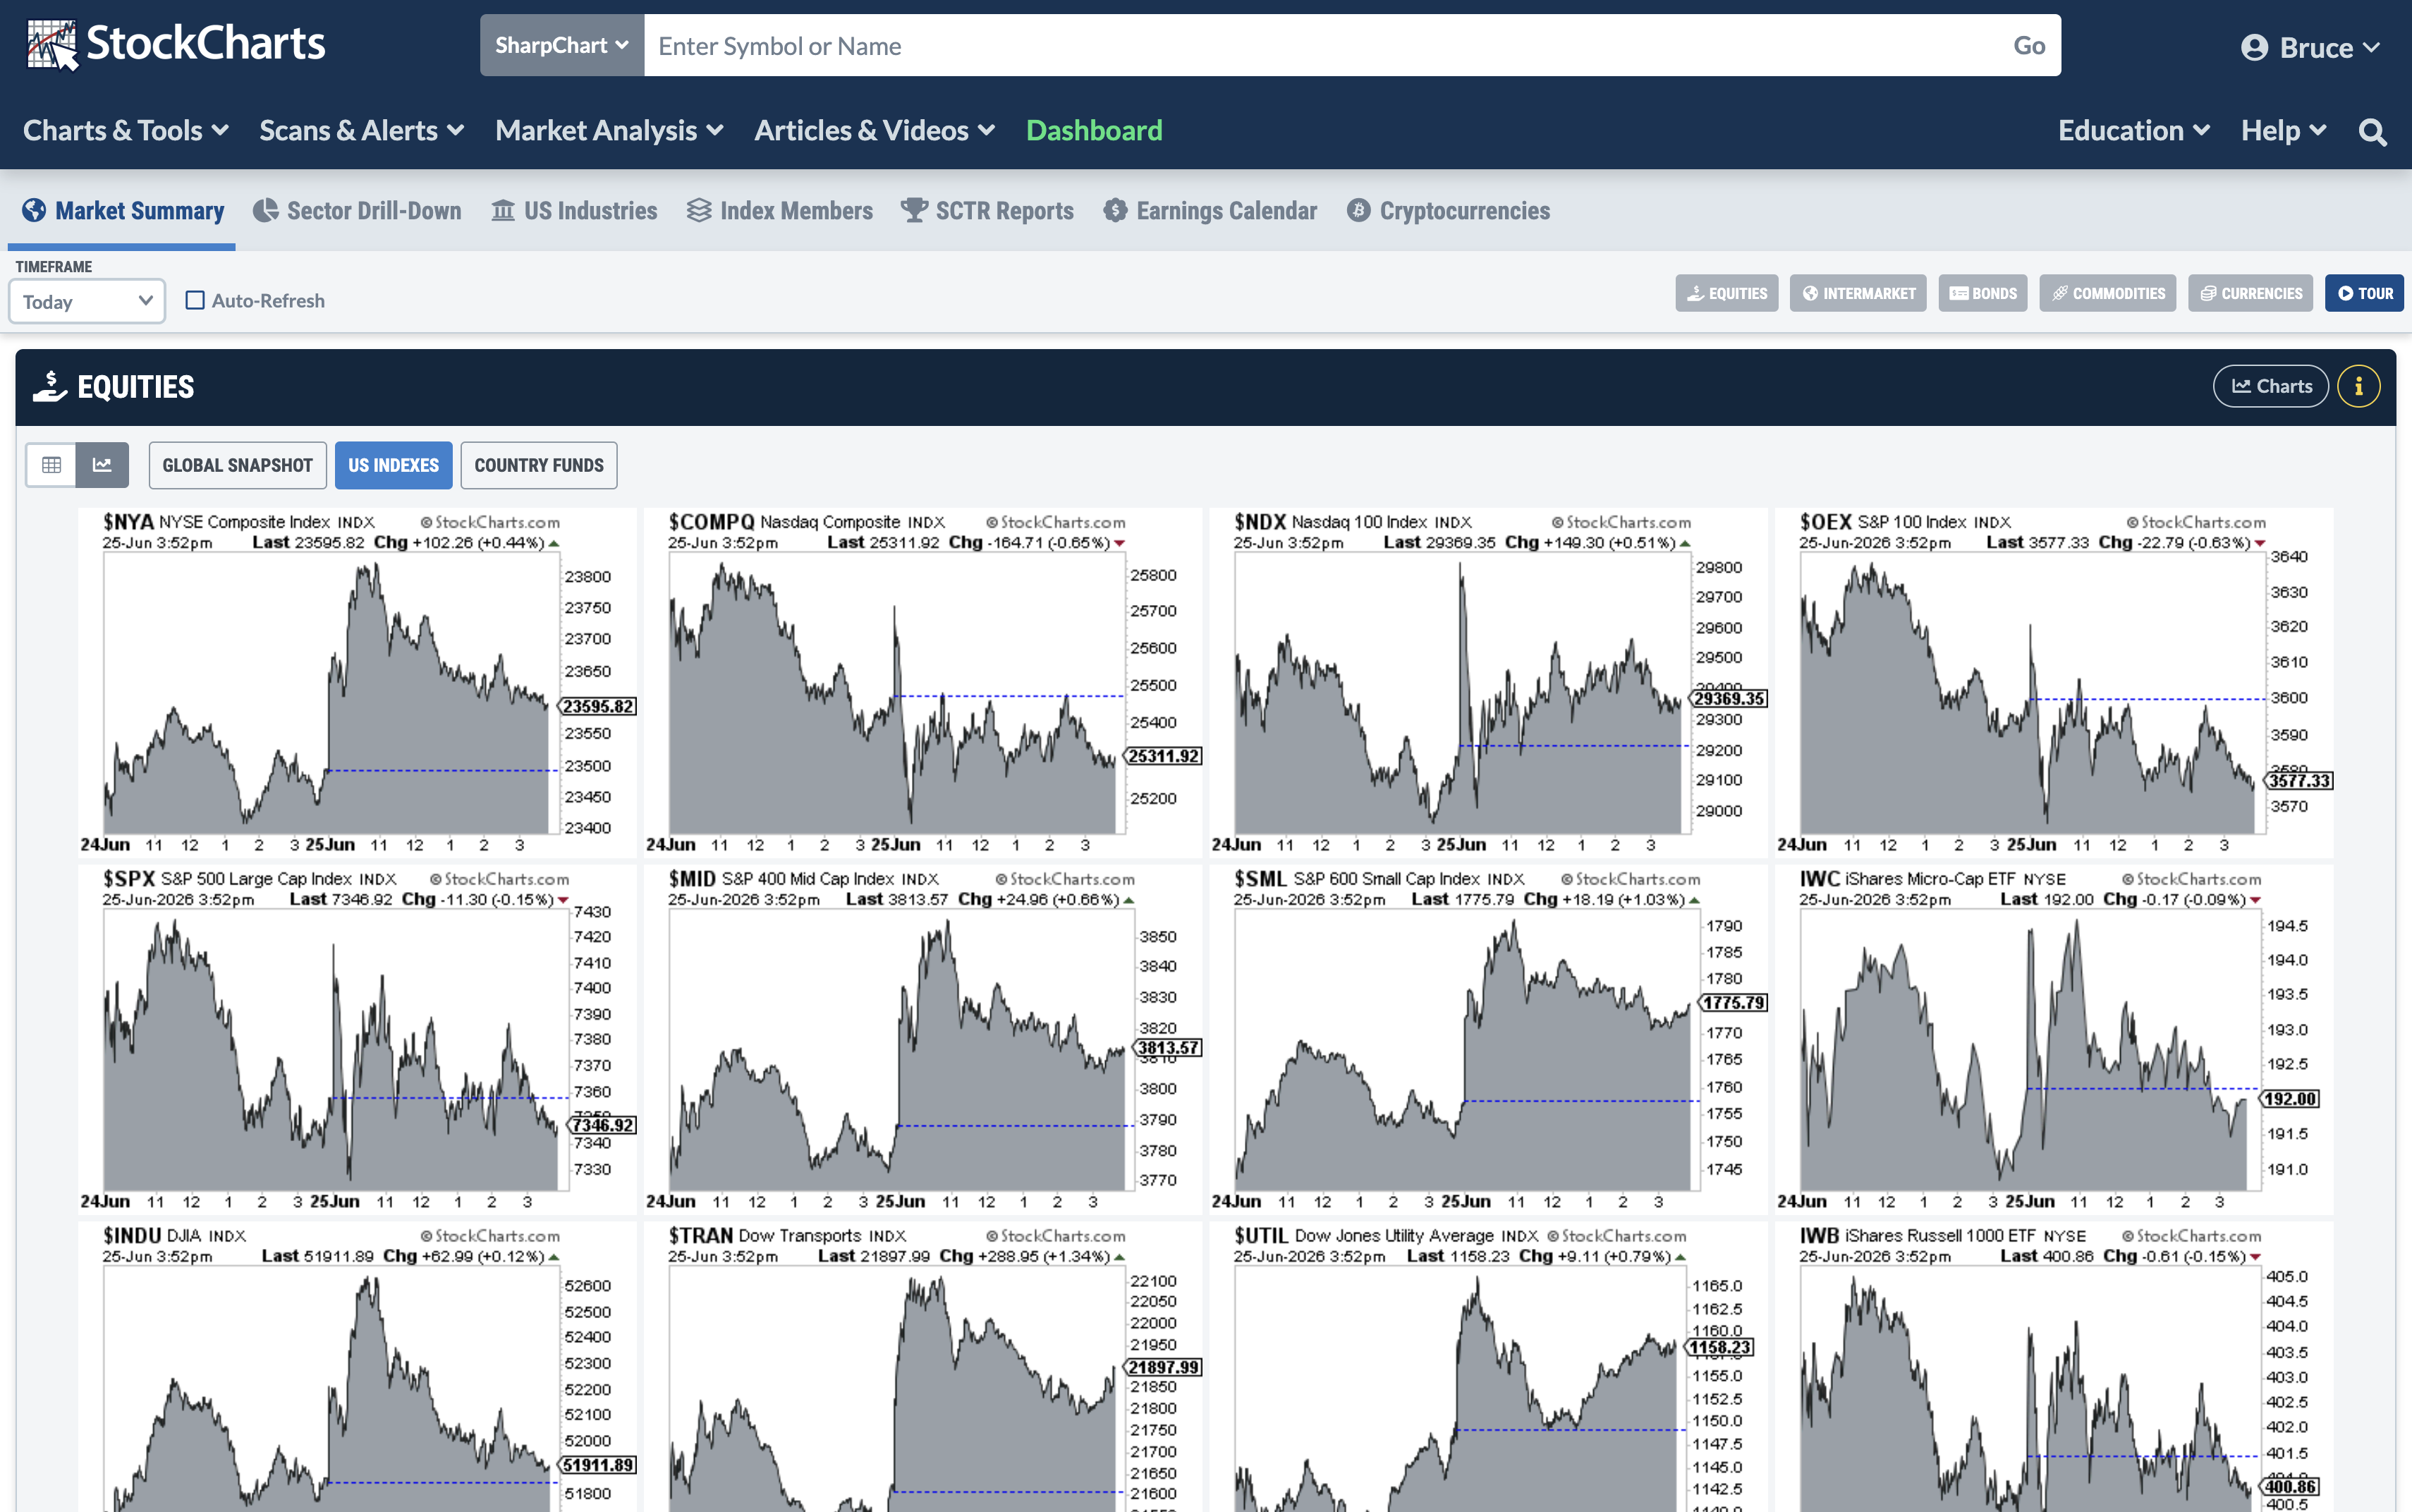
-
3/28/26
Intraday Commodity Data Now Available
Chart commodities throughout the trading day with complete intraday coverage now available
StockCharts now supports intraday charting for a wide range of popular commodity symbols, giving you the ability to track price action in real time across key markets like metals, energy, and agriculture.
Analyze commodities on the charts or with tools like our unique Market Summary Dashboard, now equipped with access to intraday chart periods for shorter-term technical analysis. Whether you're monitoring gold, crude oil, natural gas, or other leading commodity contracts, you can now follow the action bar by bar throughout the session.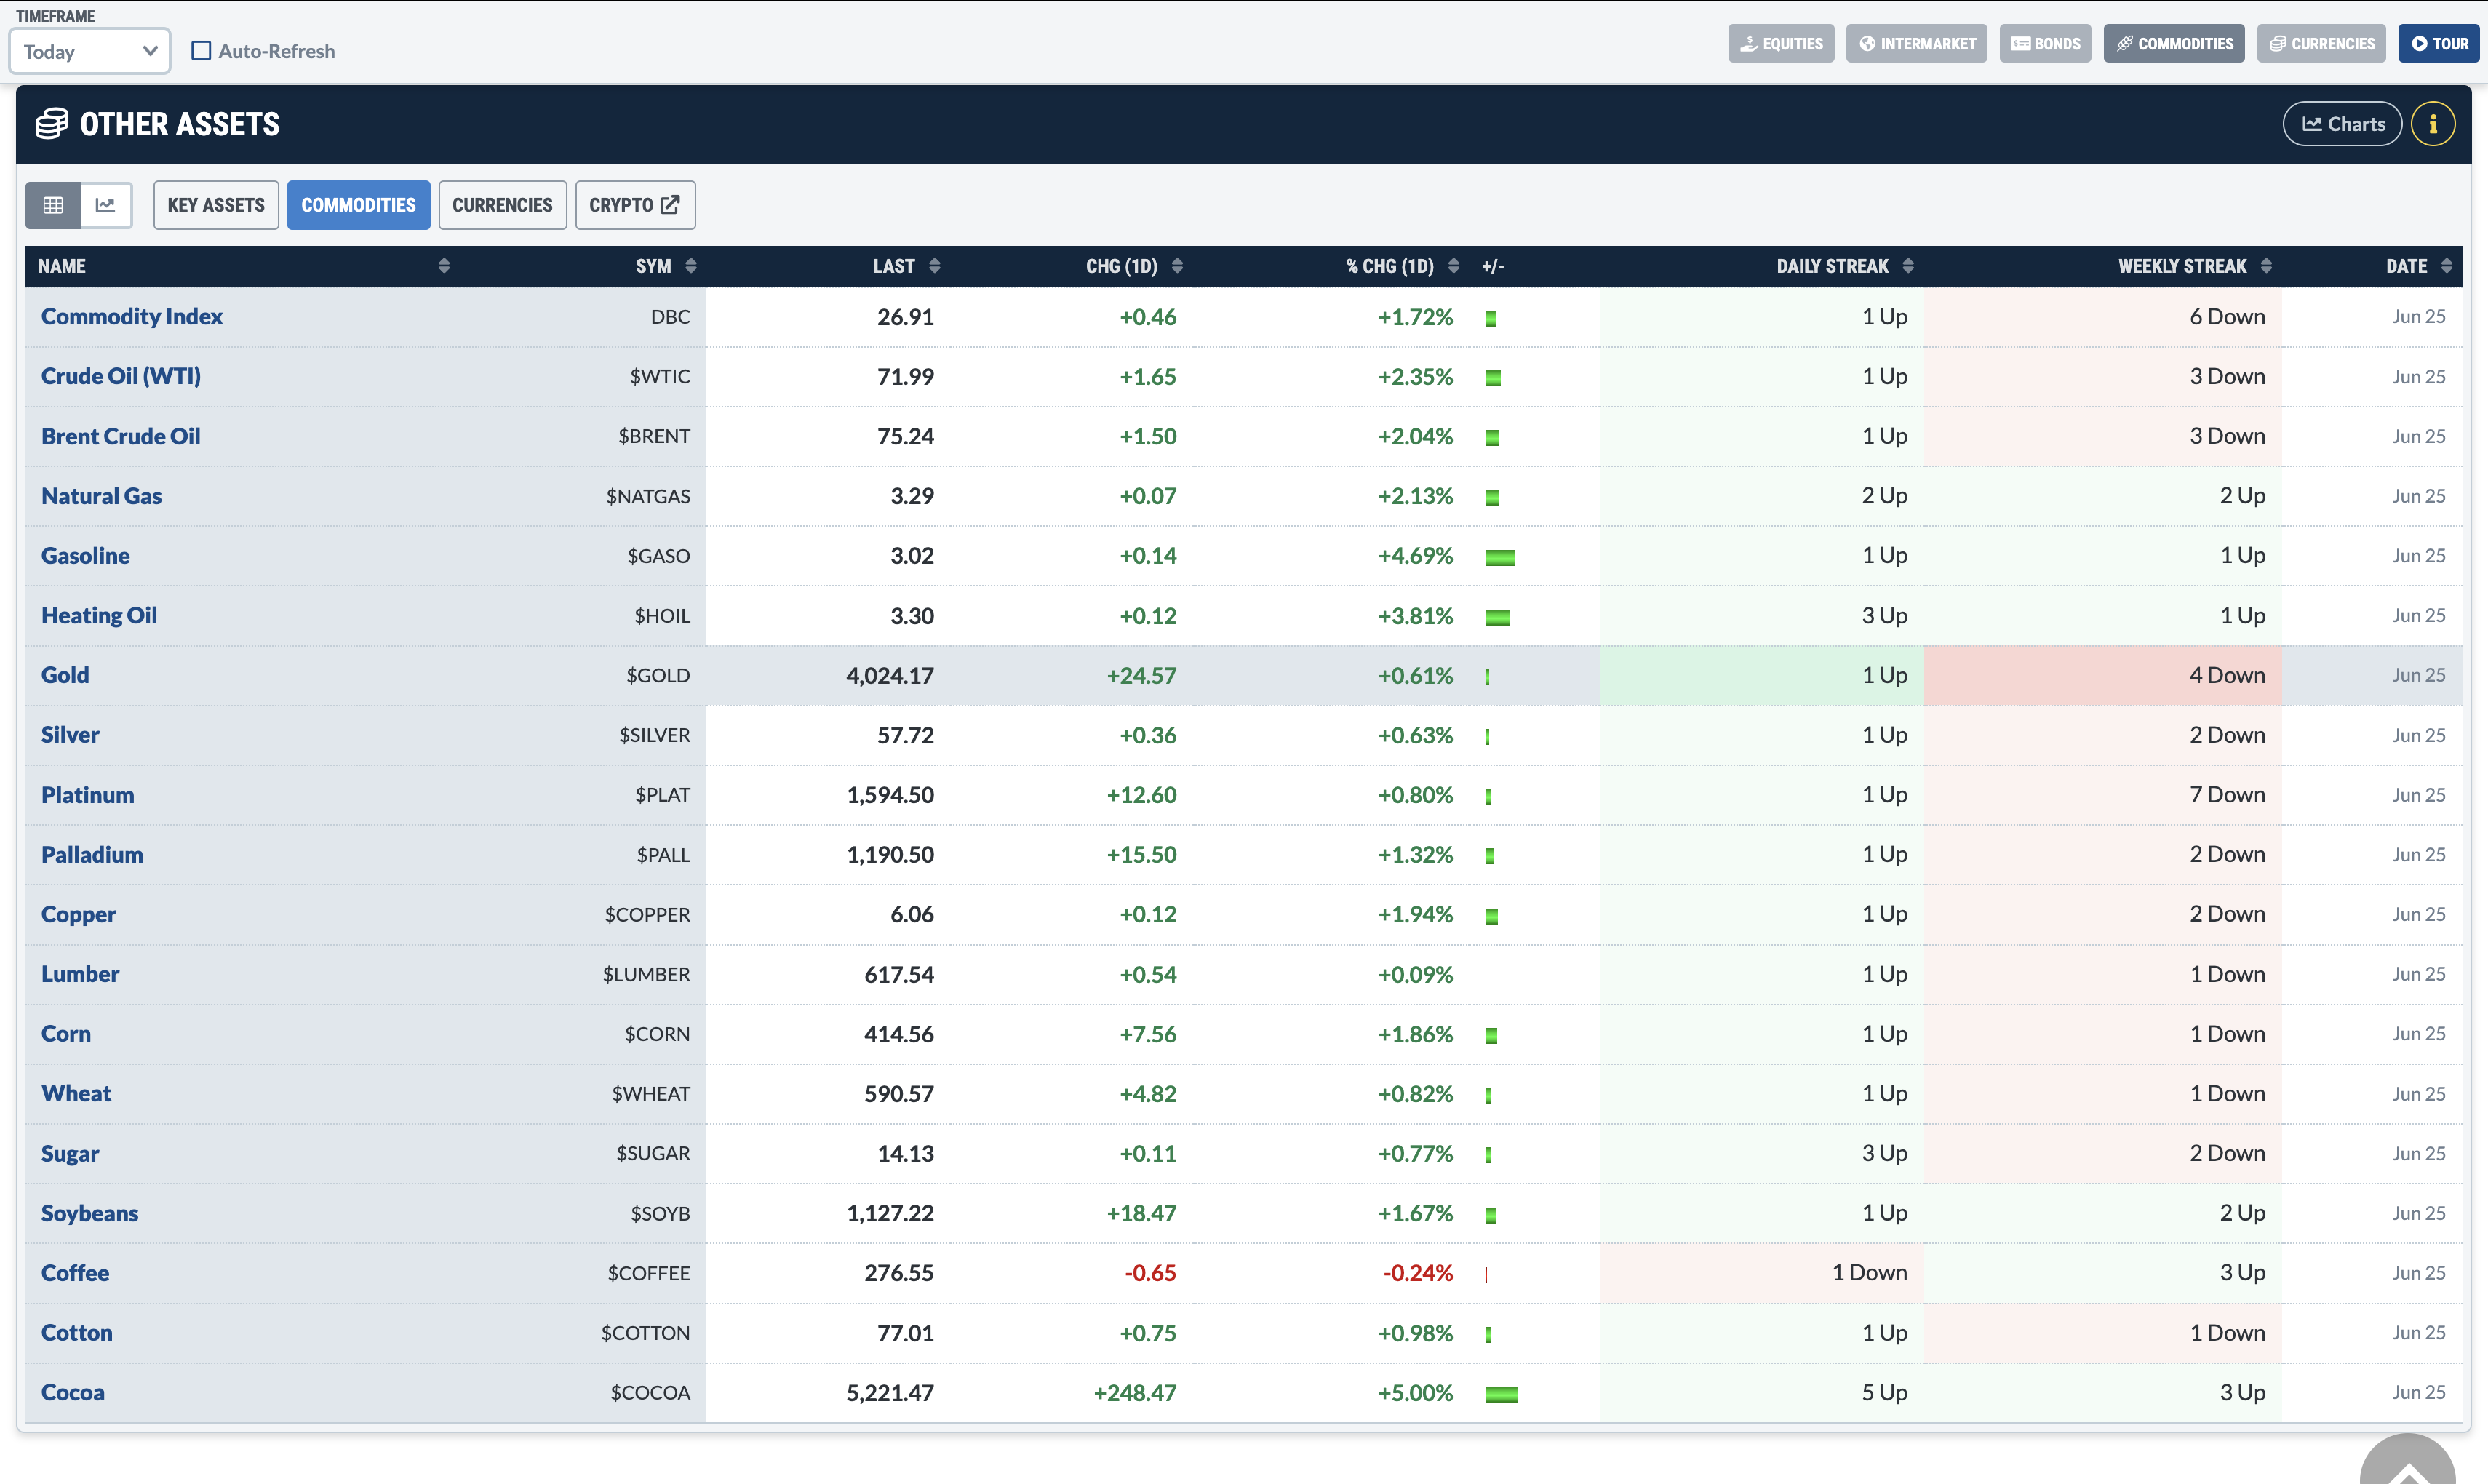
-
2/4/26
New Scan Components Panel Dramatically Simplifies Your Scan Building Process
A wide collection of powerful, pre-written scan snippets are now available to instantly boost your advanced scan writing
Our latest major update to the StockCharts Scan Engine brings you an all-new Scan Components panel designed to simplify and streamline your scan writing process. Pre-configured menus in the Scan Components panel now allow you to select from powerful, pre-written scan snippets and quickly add them to your custom advanced scans.
To get started, use the tabs at the top of the Scan Components panel to explore categories like Key Properties, Technicals, Candlestick Patterns, P&F Patterns and more. Simply select the criteria from any of the menus you see and then click the Plus button to the right of that menu to instantly add the pre-written snippet to your new scan.
These enhancements to the Scan Components panel can help you explore all the capabilities of the StockCharts Scan Engine while also allowing you to build your own custom scans faster and easier than ever before.
And there's a bonus! These same enhancements have been introduced on the advanced alert workbench to make custom technical alert writing equally speedy.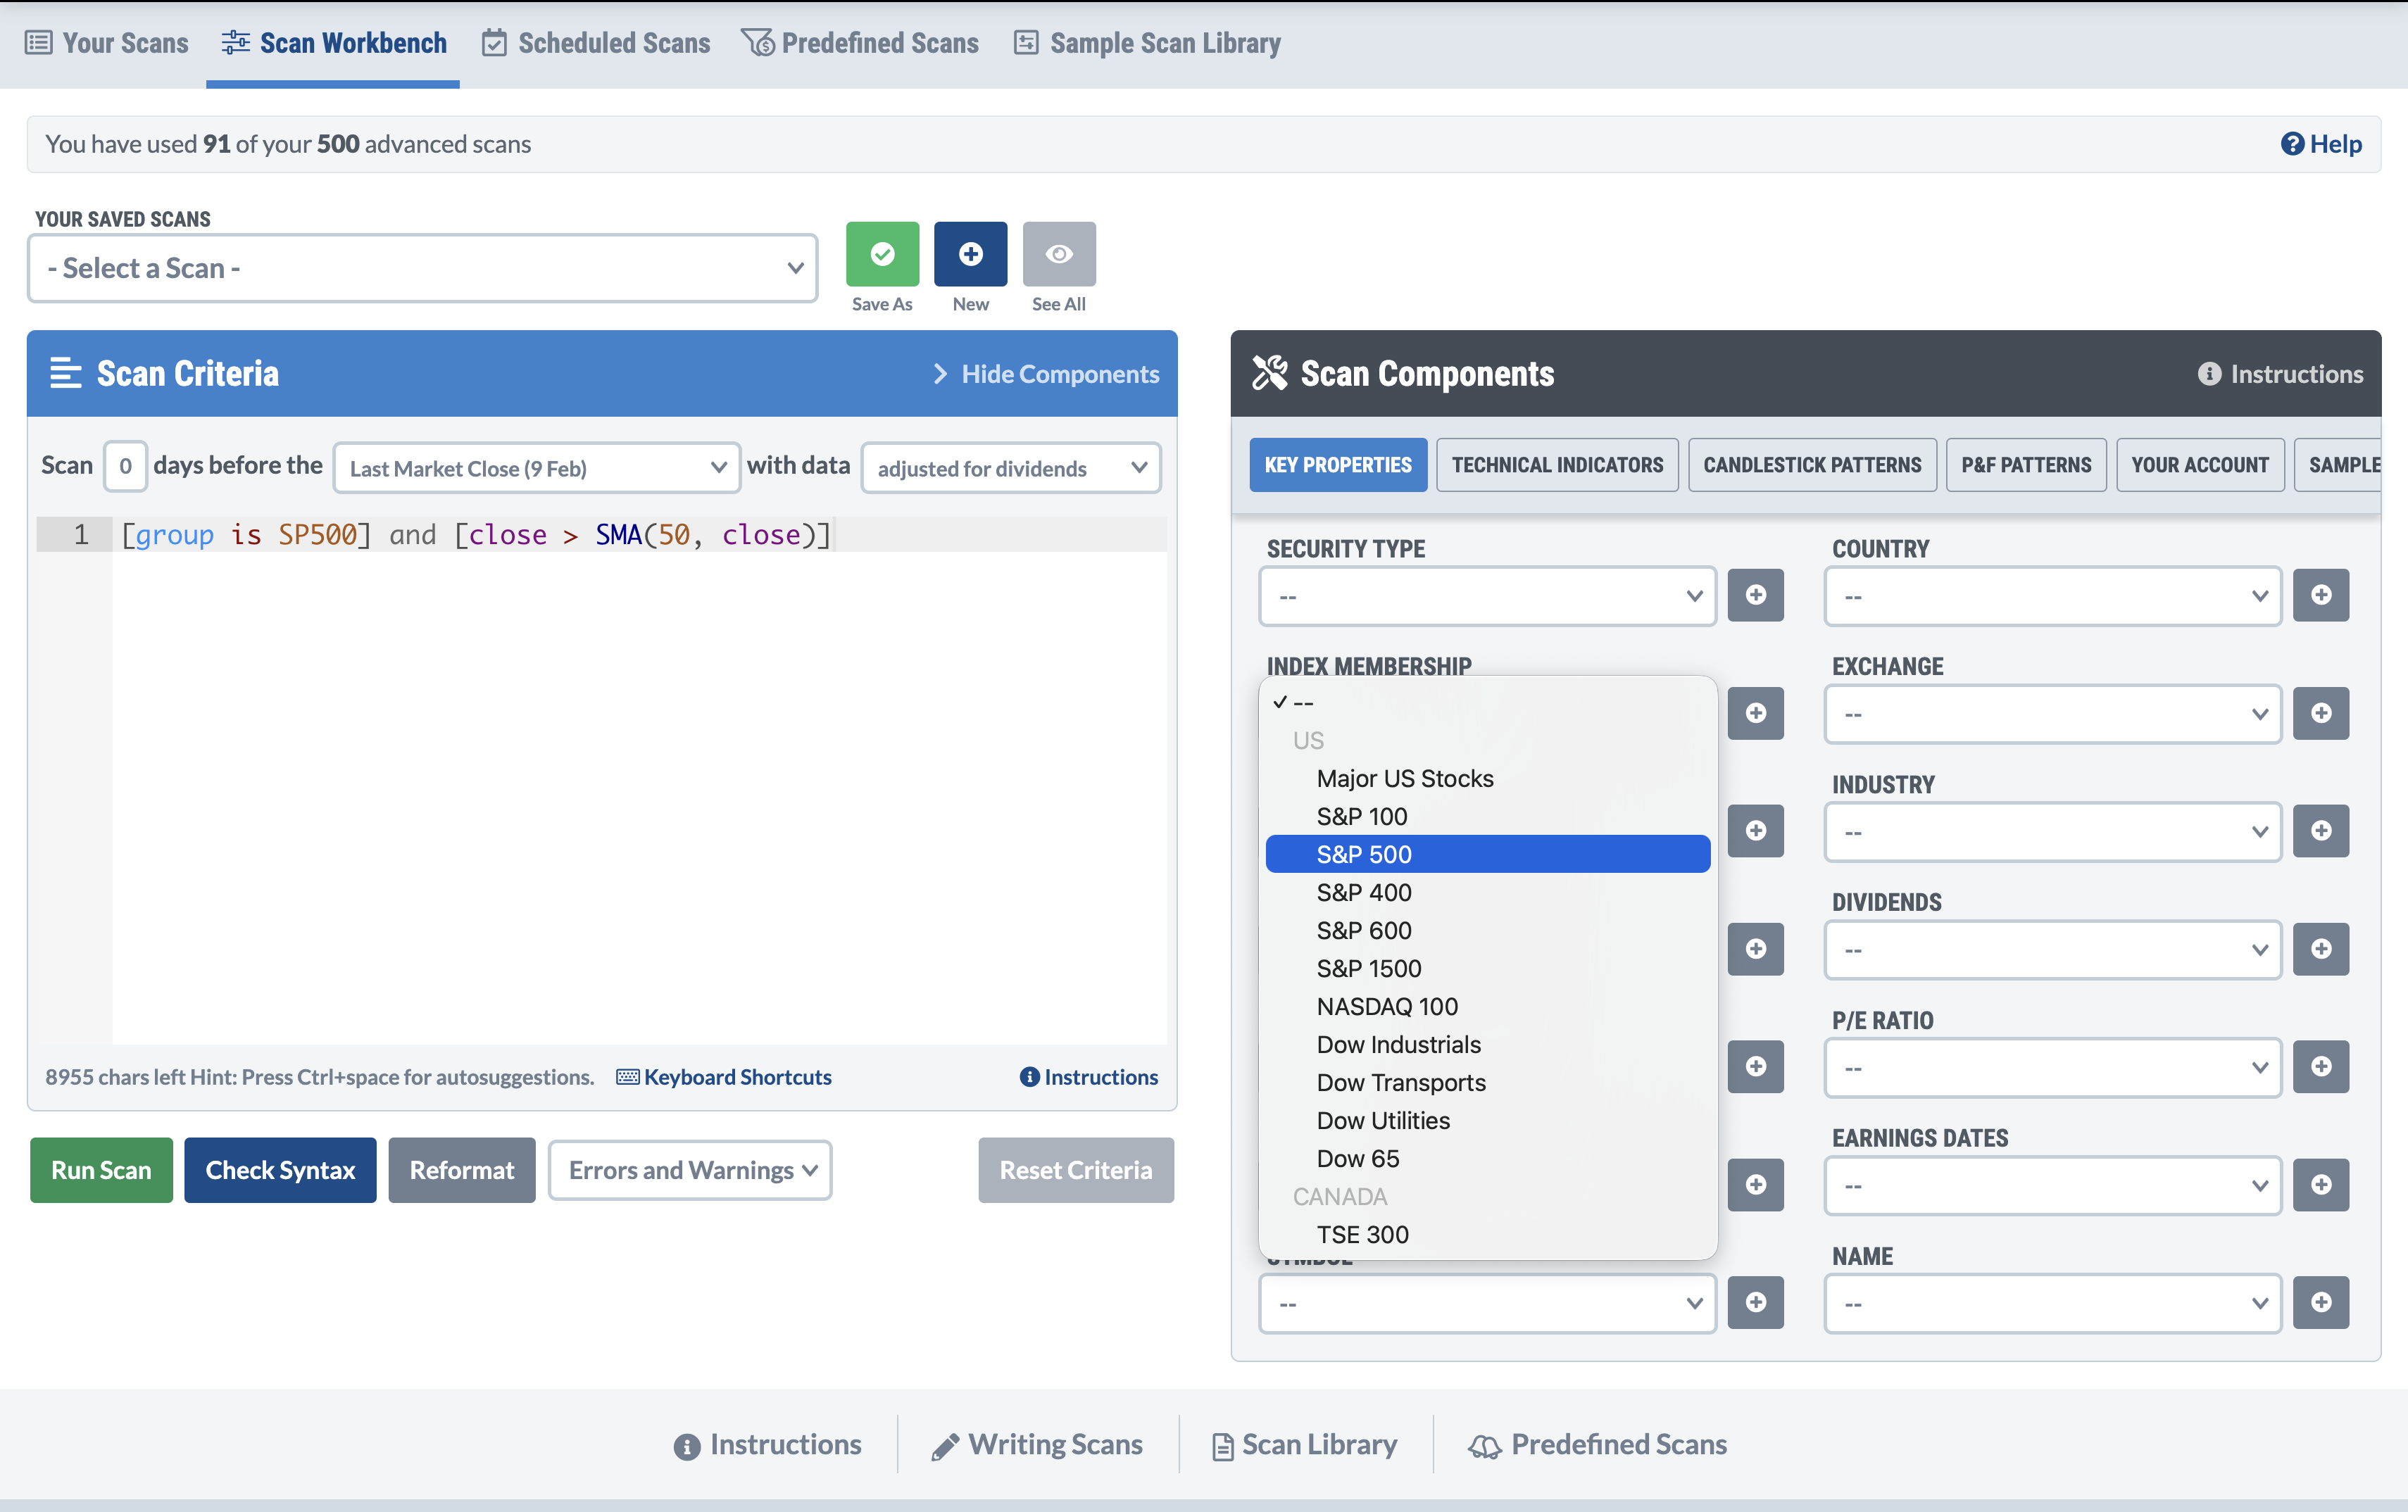
-
1/9/26
Sample Scan "Filters" Make Advanced Screening A Breeze
Our Sample Scan Library now includes custom filtering options to let you screen like a pro in just a few clicks
We've introduced an exciting enhancement to the Sample Scan Library. With new filtering options for all sample scans, you can quickly customize any of the pre-built scans in the library with criteria that fit your specific objectives. Narrow down your scan results by index membership, sector, market cap, technical strength and more, all without writing any custom scan code.
These powerful filters help reduce noise, speed up idea generation, and make the Sample Scan Library an even more powerful starting point for advanced scanning on StockCharts.
To get started, visit the Sample Scan Library and look for the "Show Filters" button at the top of the library. Set your filters using the menus in the pop-out sidebar, and they will automatically apply to any of the sample scans you run.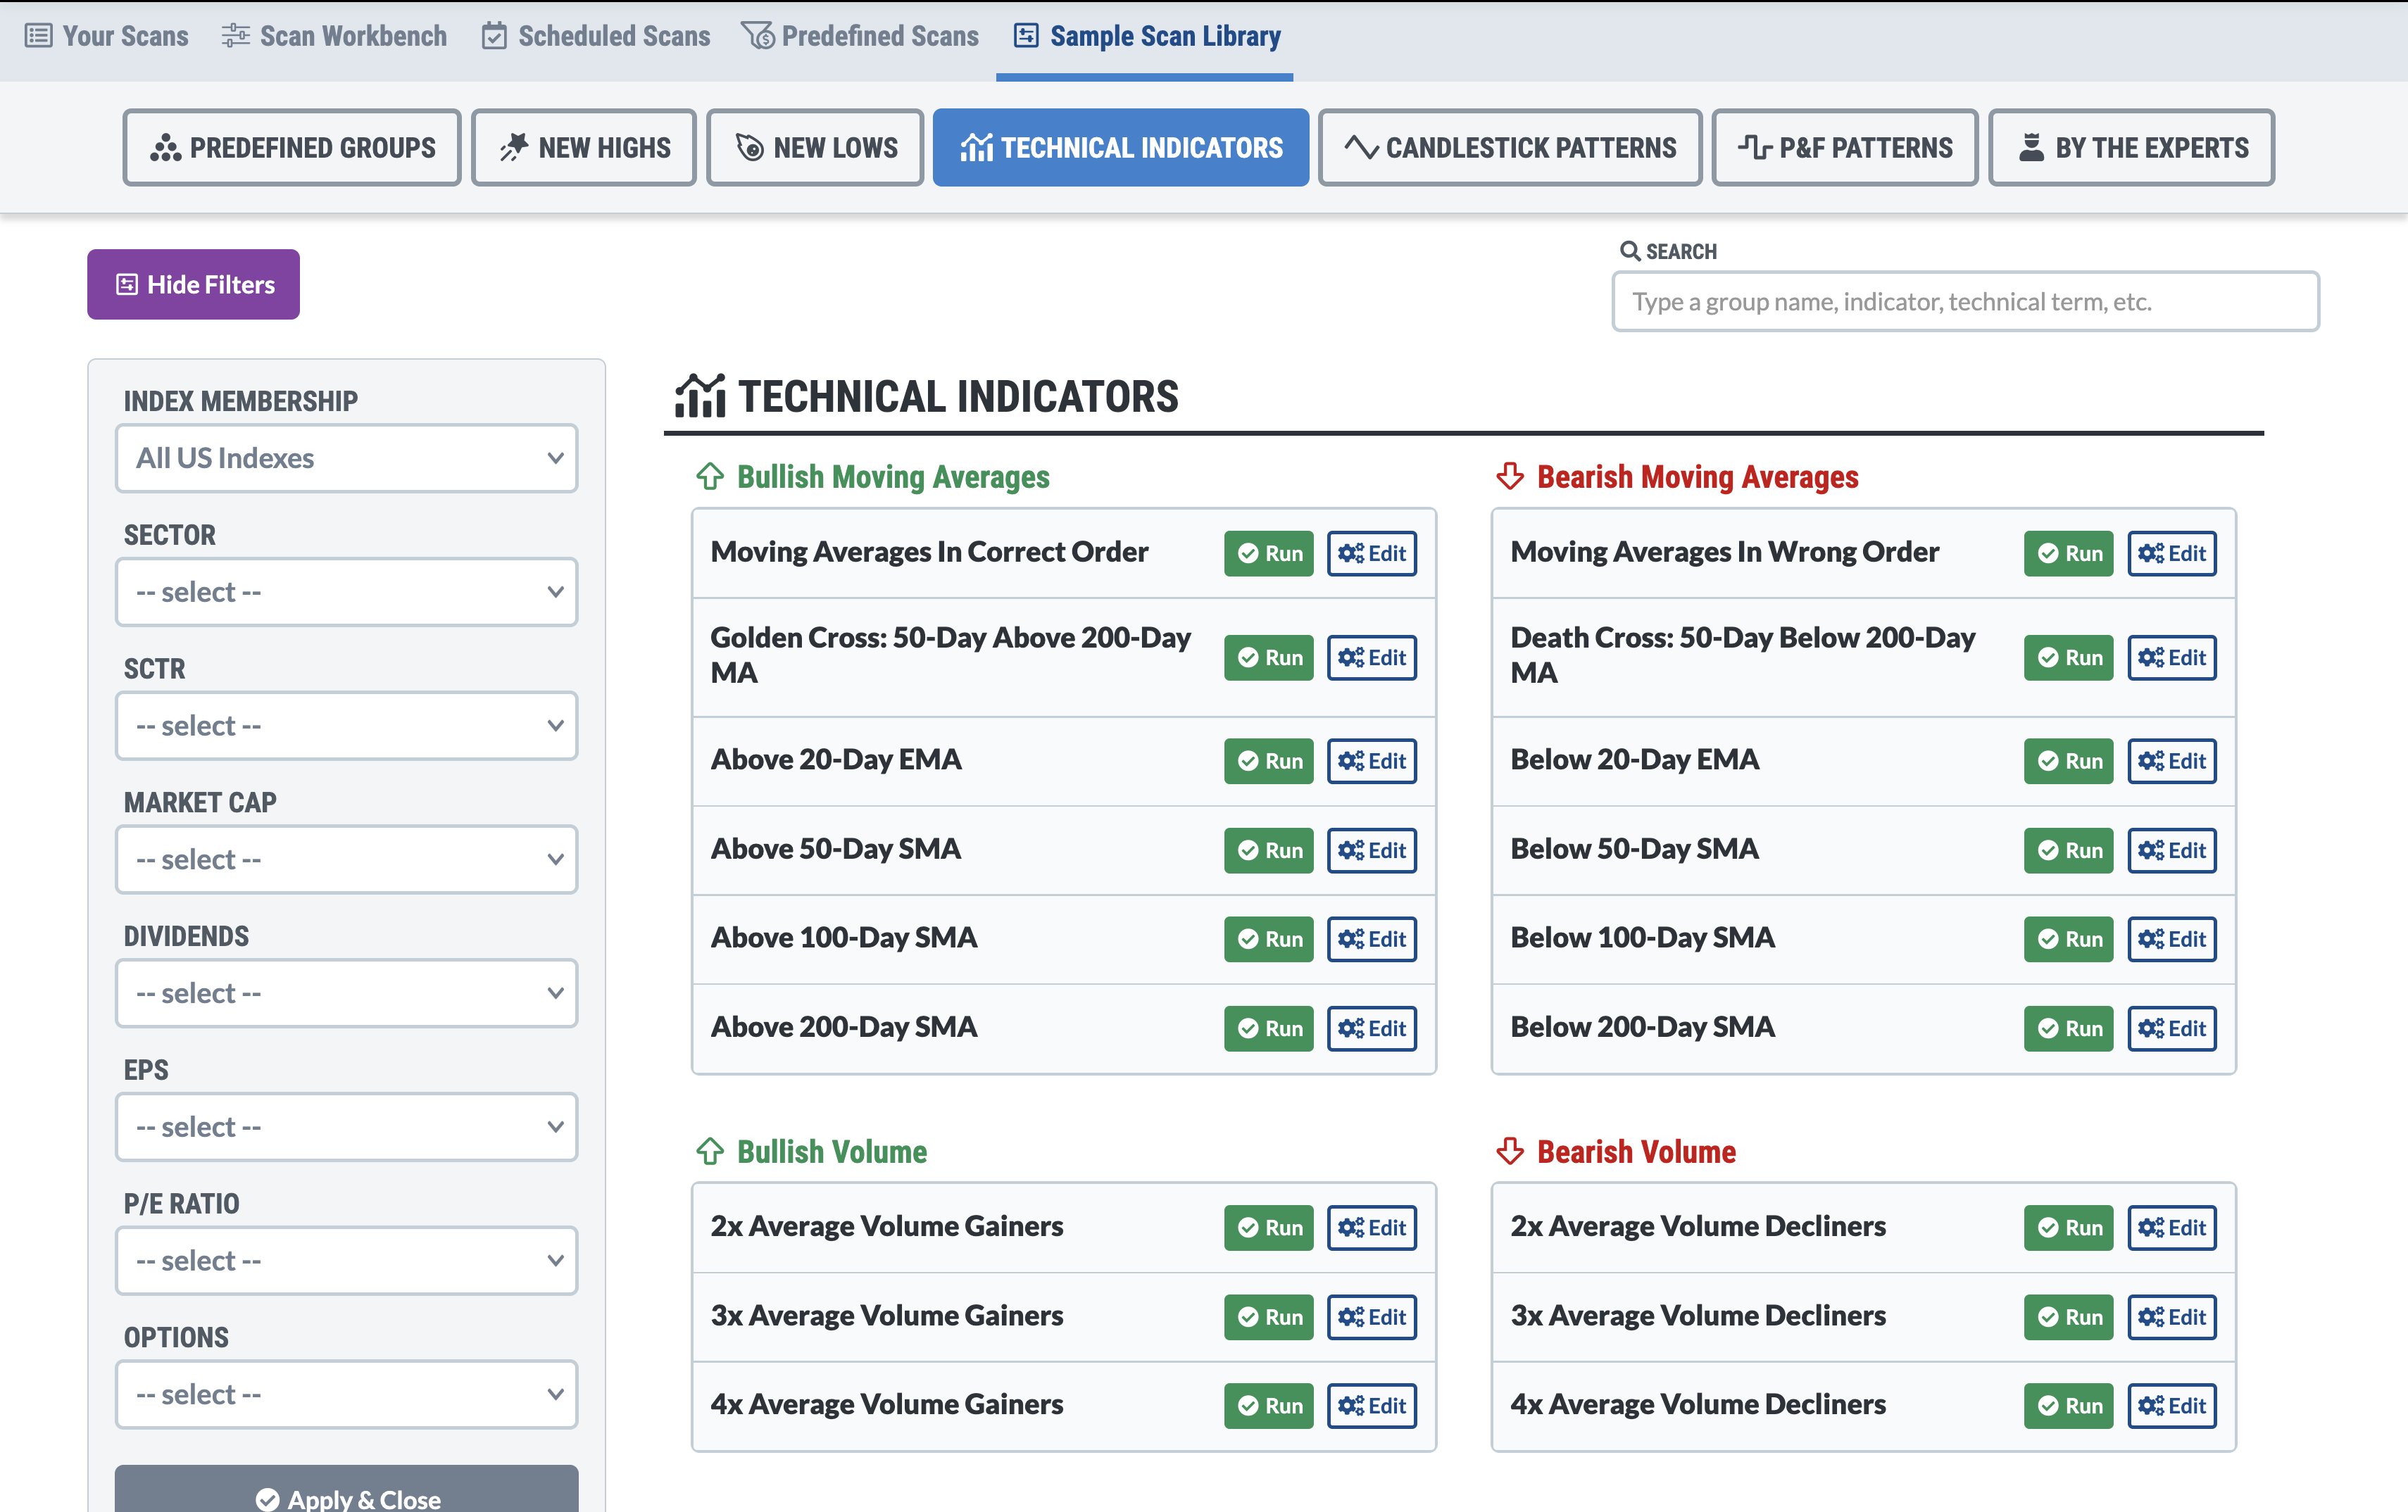
-
12/22/25
The New "Workbench Drawer" For SharpCharts
Elevate your charting workflow with seamless access to the workbench's most powerful features
We've released a major update to SharpCharts with the introduction of the new Workbench Drawer, designed to help you work more efficiently with charts, lists, and data inside the SharpCharts platform.
By "pinning" the lower half of the SharpCharts Workbench to enable the drawer, you can now access features like your ChartLists, the Symbol Summary, options data, historical price data and more, all while keeping your charts in view at the top of the screen. No more constant scrolling up and down - just enable the drawer to take your charting workflow to the next level with an efficient and productive SharpCharts experience.
Look for the "pin" icon in the blue navigation bar below your charts, and click it to enable the drawer. Once enabled, you can size the drawer to your liking by dragging and dropping the top edge, or use the controls that appear next to the "pin" button to maximize and minimize the drawer.
-
8/8/25
Mike Zaccardi On StockCharts
A new expert contributor has just joined our list of industry thought leaders
Mike Zaccardi is a financial writer focusing on markets, investments, retirement planning, and personal finance. Having earned the impressive combination of both the CMT and CFA designations, Mike enjoys analyzing market trends and security analysis, but also has a passion for helping individual investors better understand the complex world of finance.
Mike's writing is down-to-earth and often uses storytelling to drive home the key points. His thousands of X followers are well aware of his obsession with charts.
-
7/22/25
New Sitewide Navigation Menus
Navigating StockCharts just got a whole lot smoother
We've updated the entire platform with a new set of navigation menus across the top of your screen, organized into key categories like Charts & Tools, Scans & Alerts, Market Analysis resources, Articles & Videos, ChartSchool and Help. From the top of any page around StockCharts, you can now quickly and easily access any tool you're looking for. Plus, this is a great way to explore the tools, features and resources around the site and get to know everything that StockCharts has to offer.
Look for the blue navigation bar at the top of any page around StockCharts and click on any of the tabs to see a dropdown menu for that category. You'll flying around the site like a real pro in no time!
-
6/26/25
Major Additions & New Enhancements To Our Market Summary Dashboard
Fresh new updates, additions and enhancements just rolled out on our massively popular Market Summary page
- New mini charts for the S&P sectors
- Intermarket analysis ratios tab to compare performance across asset classes
- Fixed Income + Credit Spreads tab in the Bonds panel, including a unique credit spreads chart
- New economic indexes panel with key data for the US economy
- Addition of the index-only put/call ratio
- More pre-built charts accessible across the dashboard
-
5/15/25
Market Summary ChartPack
The perfect complement to our fan-favorite Market Summary Dashboard
Designed to accompany our detailed Market Summary page, this ChartPack is a comprehensive collection of 31 professionally-curated ChartLists filled with pre-formatted charts that will help you deeply understand what's happening throughout the financial markets.
Instantly enhance your StockCharts account with all of the charts you need to drill down beneath the surface and uncover the market's true character through every bullish and bearish cycle. The ChartPack covers major equity indexes, breadth, sentiment, volatility, sectors, industries, key ratios, bonds, commodities, currencies, cryptocurrencies and much more.
-
5/7/25
Frank Cappelleri On StockCharts
A new expert contributor has just joined our list of industry thought leaders
Frank Cappelleri is the Founder & President of CappThesis, LLC, an independent research firm that helps active investors through time-tested chart and statistical analysis. Prior to starting CappThesis, Frank spent 25 years on Wall Street, servicing institutional clients via the roles of equity sales trader, technical analyst, research sales specialist, and desk strategist.
Frank has made various media appearances on CNBC, Bloomberg TV, TD Ameritrade Network, Real Vision, StockCharts TV and others. His work also has been cited by the leading financial publications, including Barrons, The Wall Street Journal, Bloomberg, MarketWatch, Reuters, and Business Insider.
Frank holds both the CMT and CFA designations, as well.
-
5/1/25
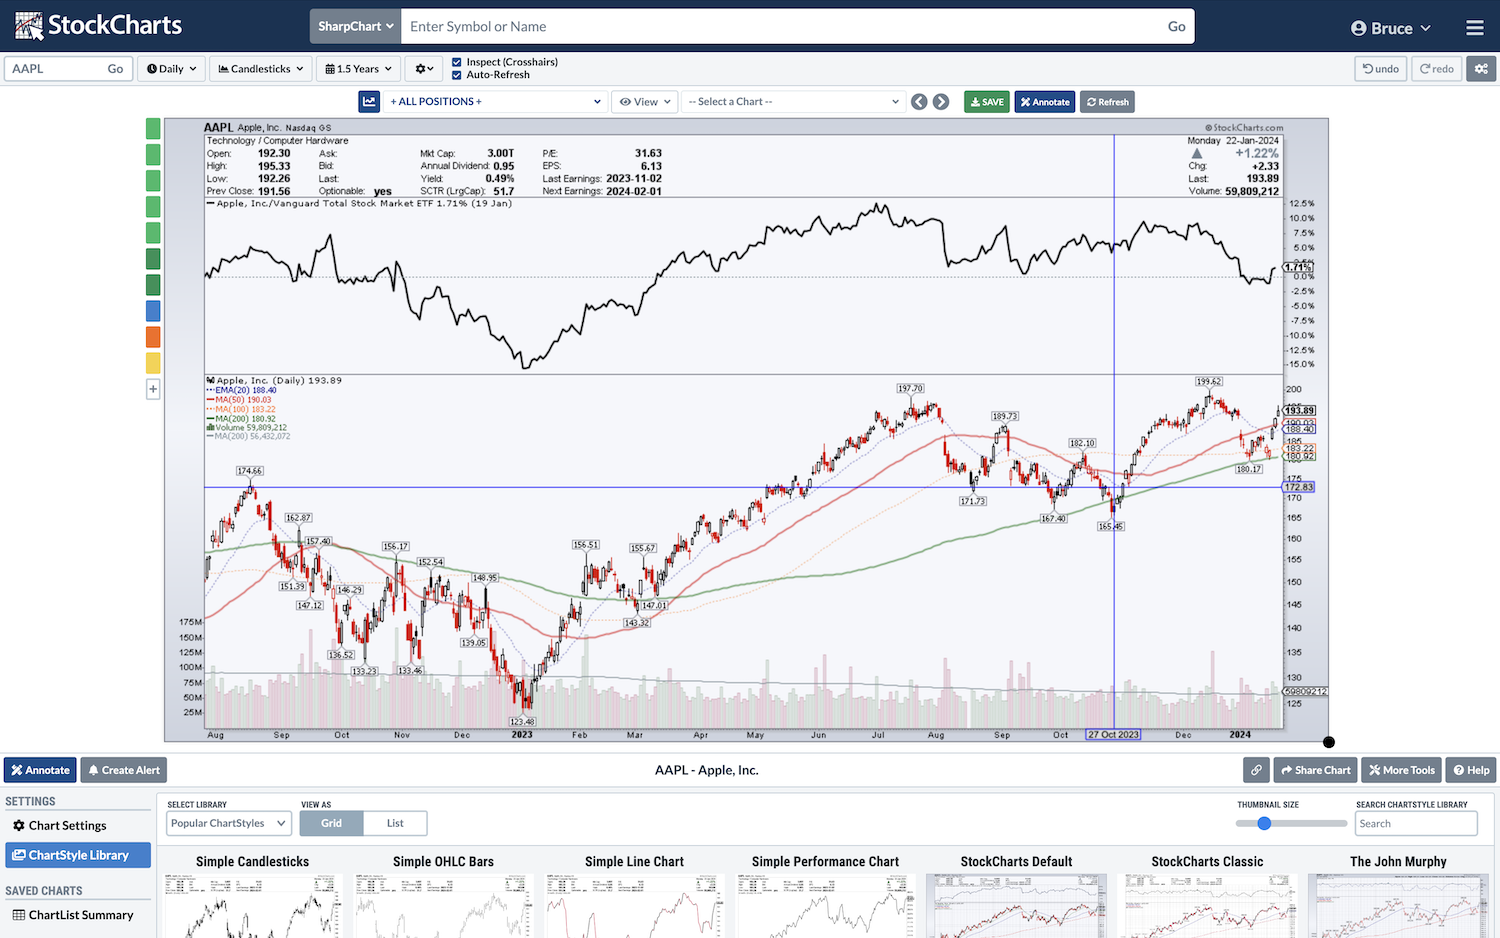
Symbol Summary Tab On SharpCharts Workbench
Our popular Symbol Summary tool is now available on the SharpCharts Workbench!
Designed to provide a wide range of information about a specific security in one convenient location, this tab is now accessible directly below your SharpCharts. It includes stock quotes, important fundamental and technical data, a mini-chart, a company summary, and a listing of predefined scans, price alerts, and saved charts featuring the security. It's a great way to get a quick look at a symbol, and then zero in on the information that matters most to you.
-
4/12/25
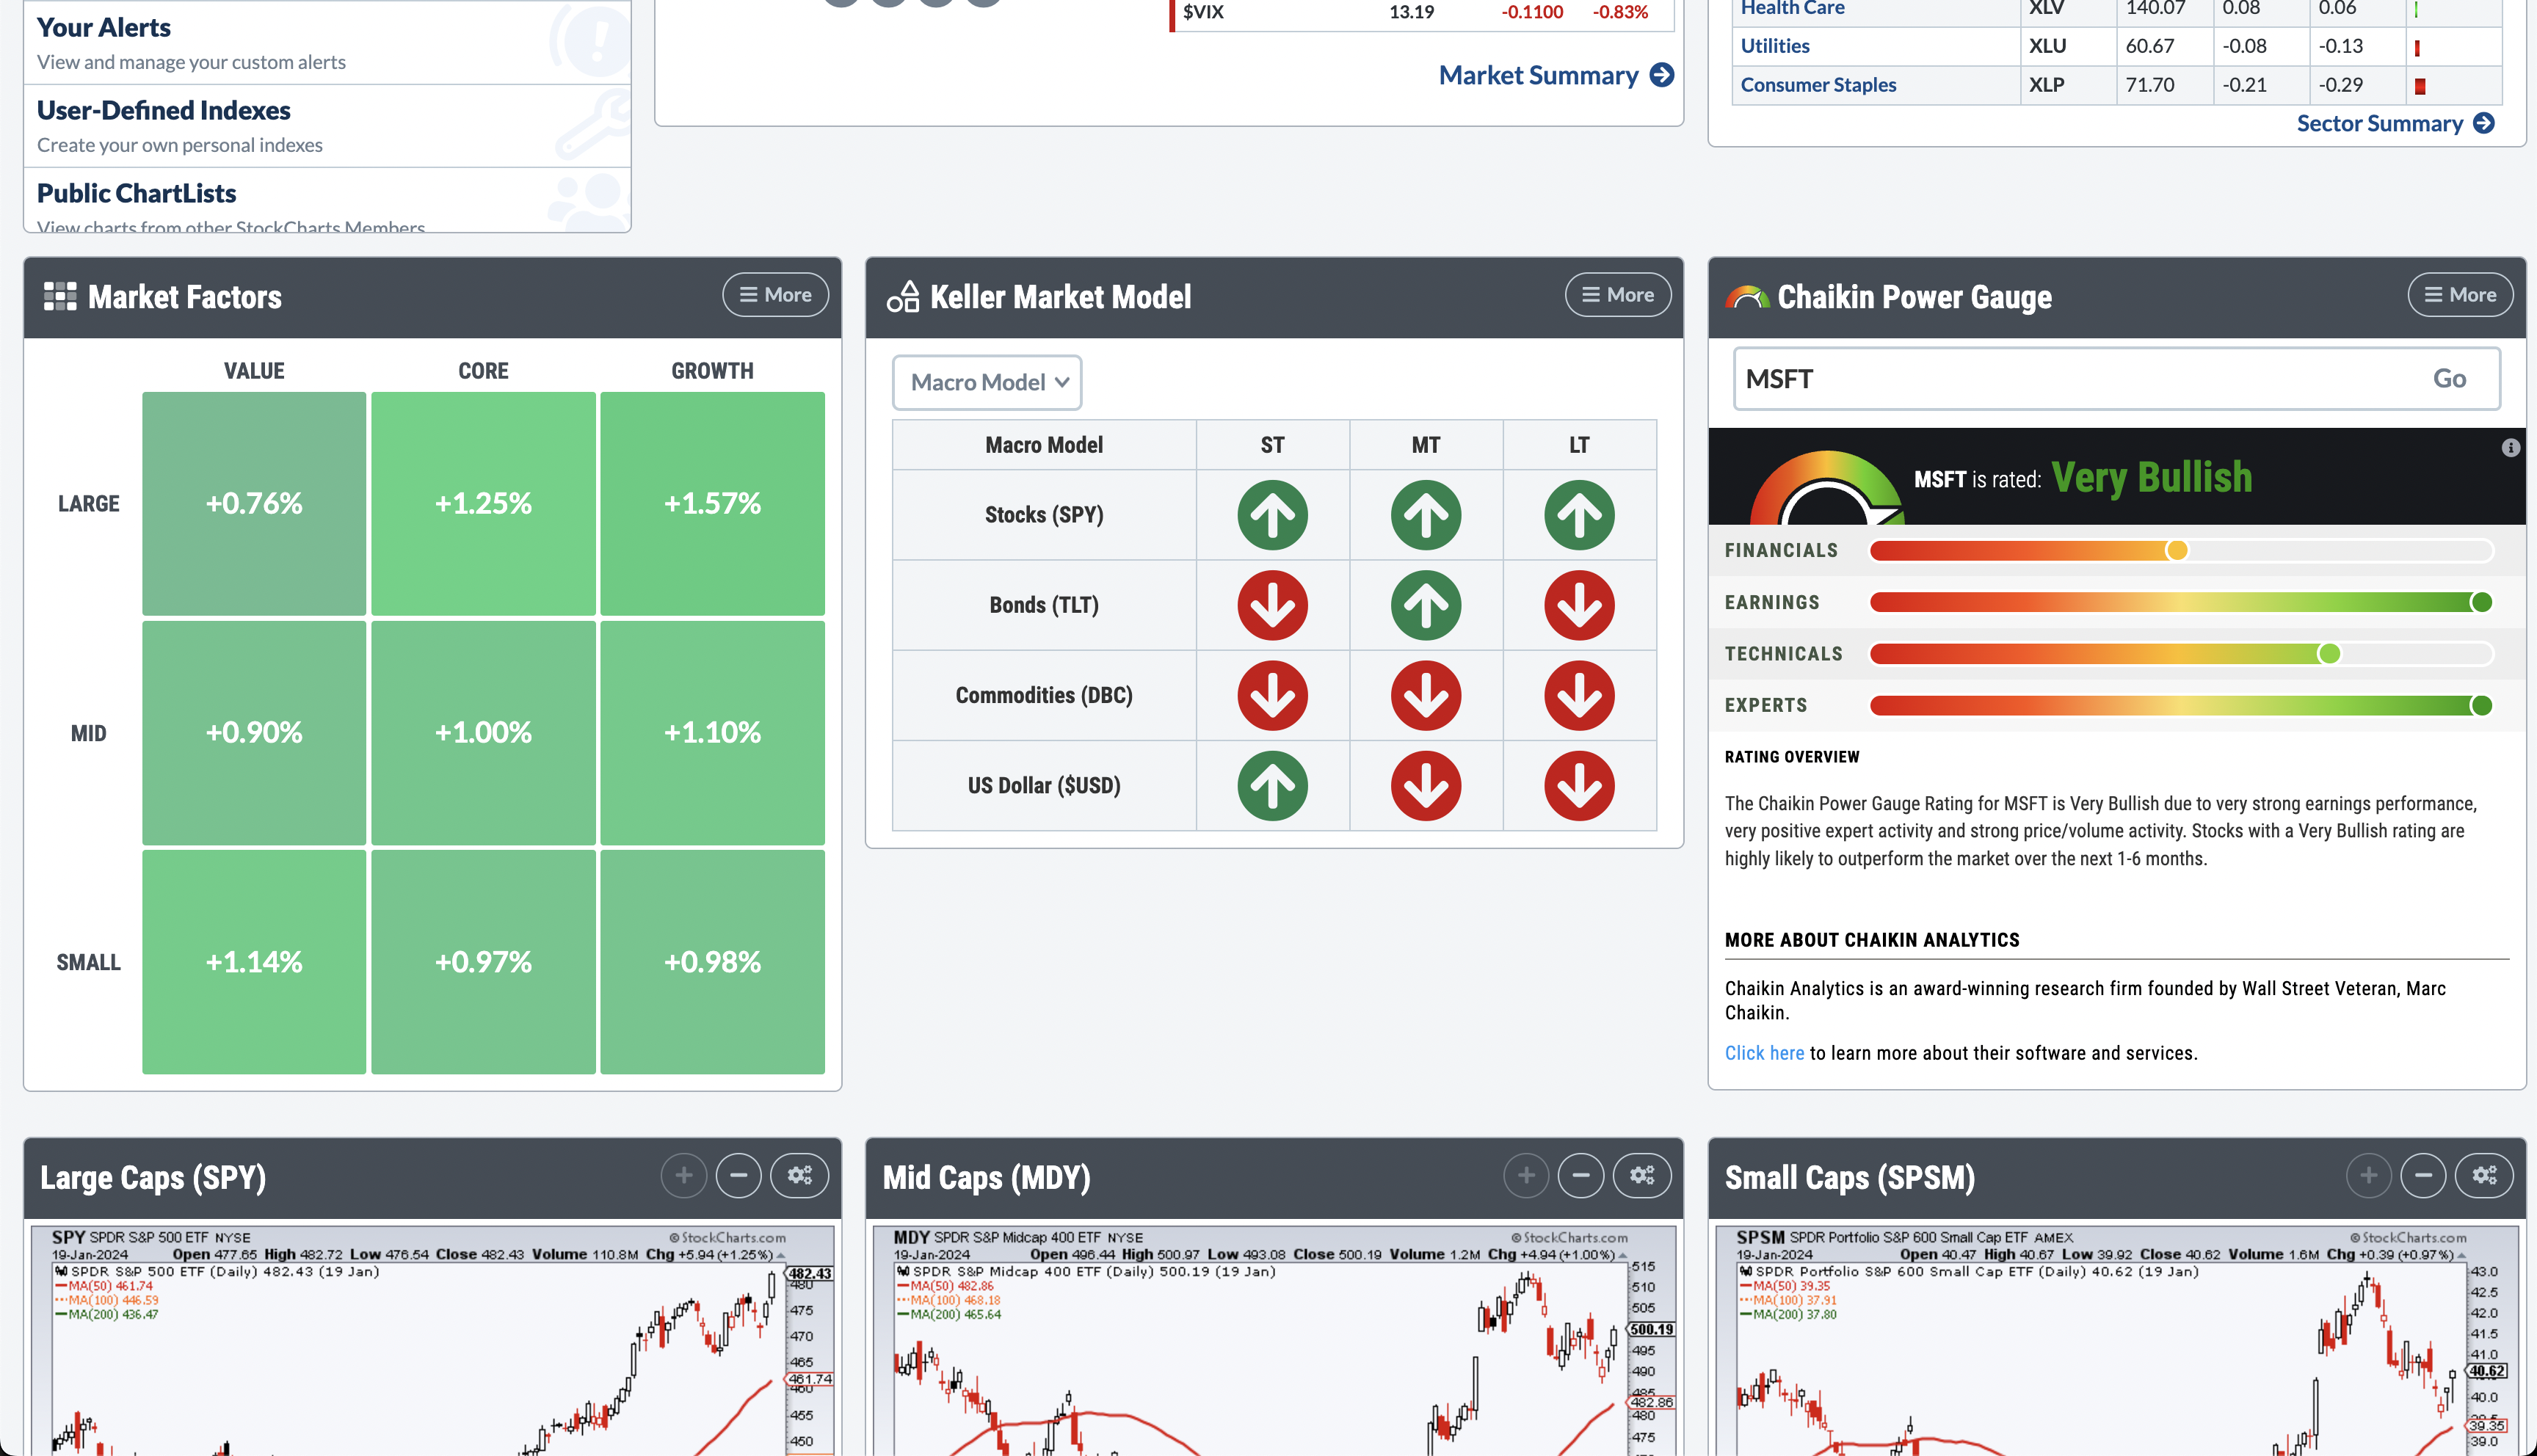
Market Summary Dashboard
Your one-stop shop for making sense of every market environment
Introducing the new Market Summary - our all-in-one dashboard that's been professionally curated with the key data and crucial indicators you need to truly understand current markets and their internals from the top down.
In one single resource, you can now track global equity indexes and compare country funds. You can see US stocks weighted by factors like growth, value, momentum, and quality. You can drill into breadth metrics like percentage of stocks above common moving averages or study sentiment, positioning, and exposure data among traders and investors. You can review sectors and industries to pinpoint the leaders and identify the laggards. And you can review other asset classes like Bonds, Commodities, Currencies, and Cryptos in detail.
Plus, with dozens of pre-built charts to match and accompanying ChartLists that you can save directly to your own account, you can go beyond the data tables and take your analysis to the next level.
-
3/14/25
Jay Woods On StockCharts
A new expert contributor has just joined our list of industry thought leaders
Jay Woods is the Chief Global Strategist for Freedom Capital Markets and Professor of Technical Analysis at Fordham University. Prior to joining Freedom, he was the Chief Market Strategist at DriveWealth. He also served as an Executive Floor Governor at the NYSE, the highest elected position at the Exchange held by only six NYSE members.
Jay spent over 25 years as a Designated Market Maker on the NYSE floor. He started with Spear, Leeds, and Kellogg, then joined Goldman Sachs for 14 years and moved on to IMC after Goldman divested their floor operation. As a DMM, he was responsible for several high-profile IPOs and led trading in some of the most active issues at the NYSE.
As Freedom's Chief Global Strategist, he appears regularly on CNBC, Bloomberg, Fox Business, and Yahoo Finance. He has also been quoted in The Wall St. Journal, Forbes, Business Insider, and Investors Business Daily.
-
11/15/24
The Next Evolution of RRG Charts
An entirely new, massively enhanced version of RRG Charts has just launched on StockCharts. The update features expanded interactivity, and improved user interface, more pre-defined asset groups and a lightning fast charting experience.
Created by industry veteran and StockCharts contributor, Julius de Kempenaer, RRG charts show you a security's relative strength and momentum relative to a collection of other securities. They are an invaluable tool for analyzing markets and pinpointing the strongest securities within a group.
-
10/26/24
OptionsPlay Add-On For StockCharts
OptionsPlay's integration with StockCharts empowers you with customized, real-time options strategies tailored to your ChartLists. Whether you are a seasoned options trader or just starting, our suite of strategies will ensure you are equipped to make informed and confident trading decisions without ever having to pull up an options chain.

-
9/15/24
PerfCharts Now Available On SharpCharts Workbench
A new chart type has been added to the SharpCharts Workbench - PerfCharts! Use this option to quickly and easily create performance comparision charts for the securities you're following. Whether you're comparing the major indexes, digging into the sectors or trying to determine which stock has outperformed the rest of the pack, PerfCharts will help you see it all clearly.

-
2/2/24
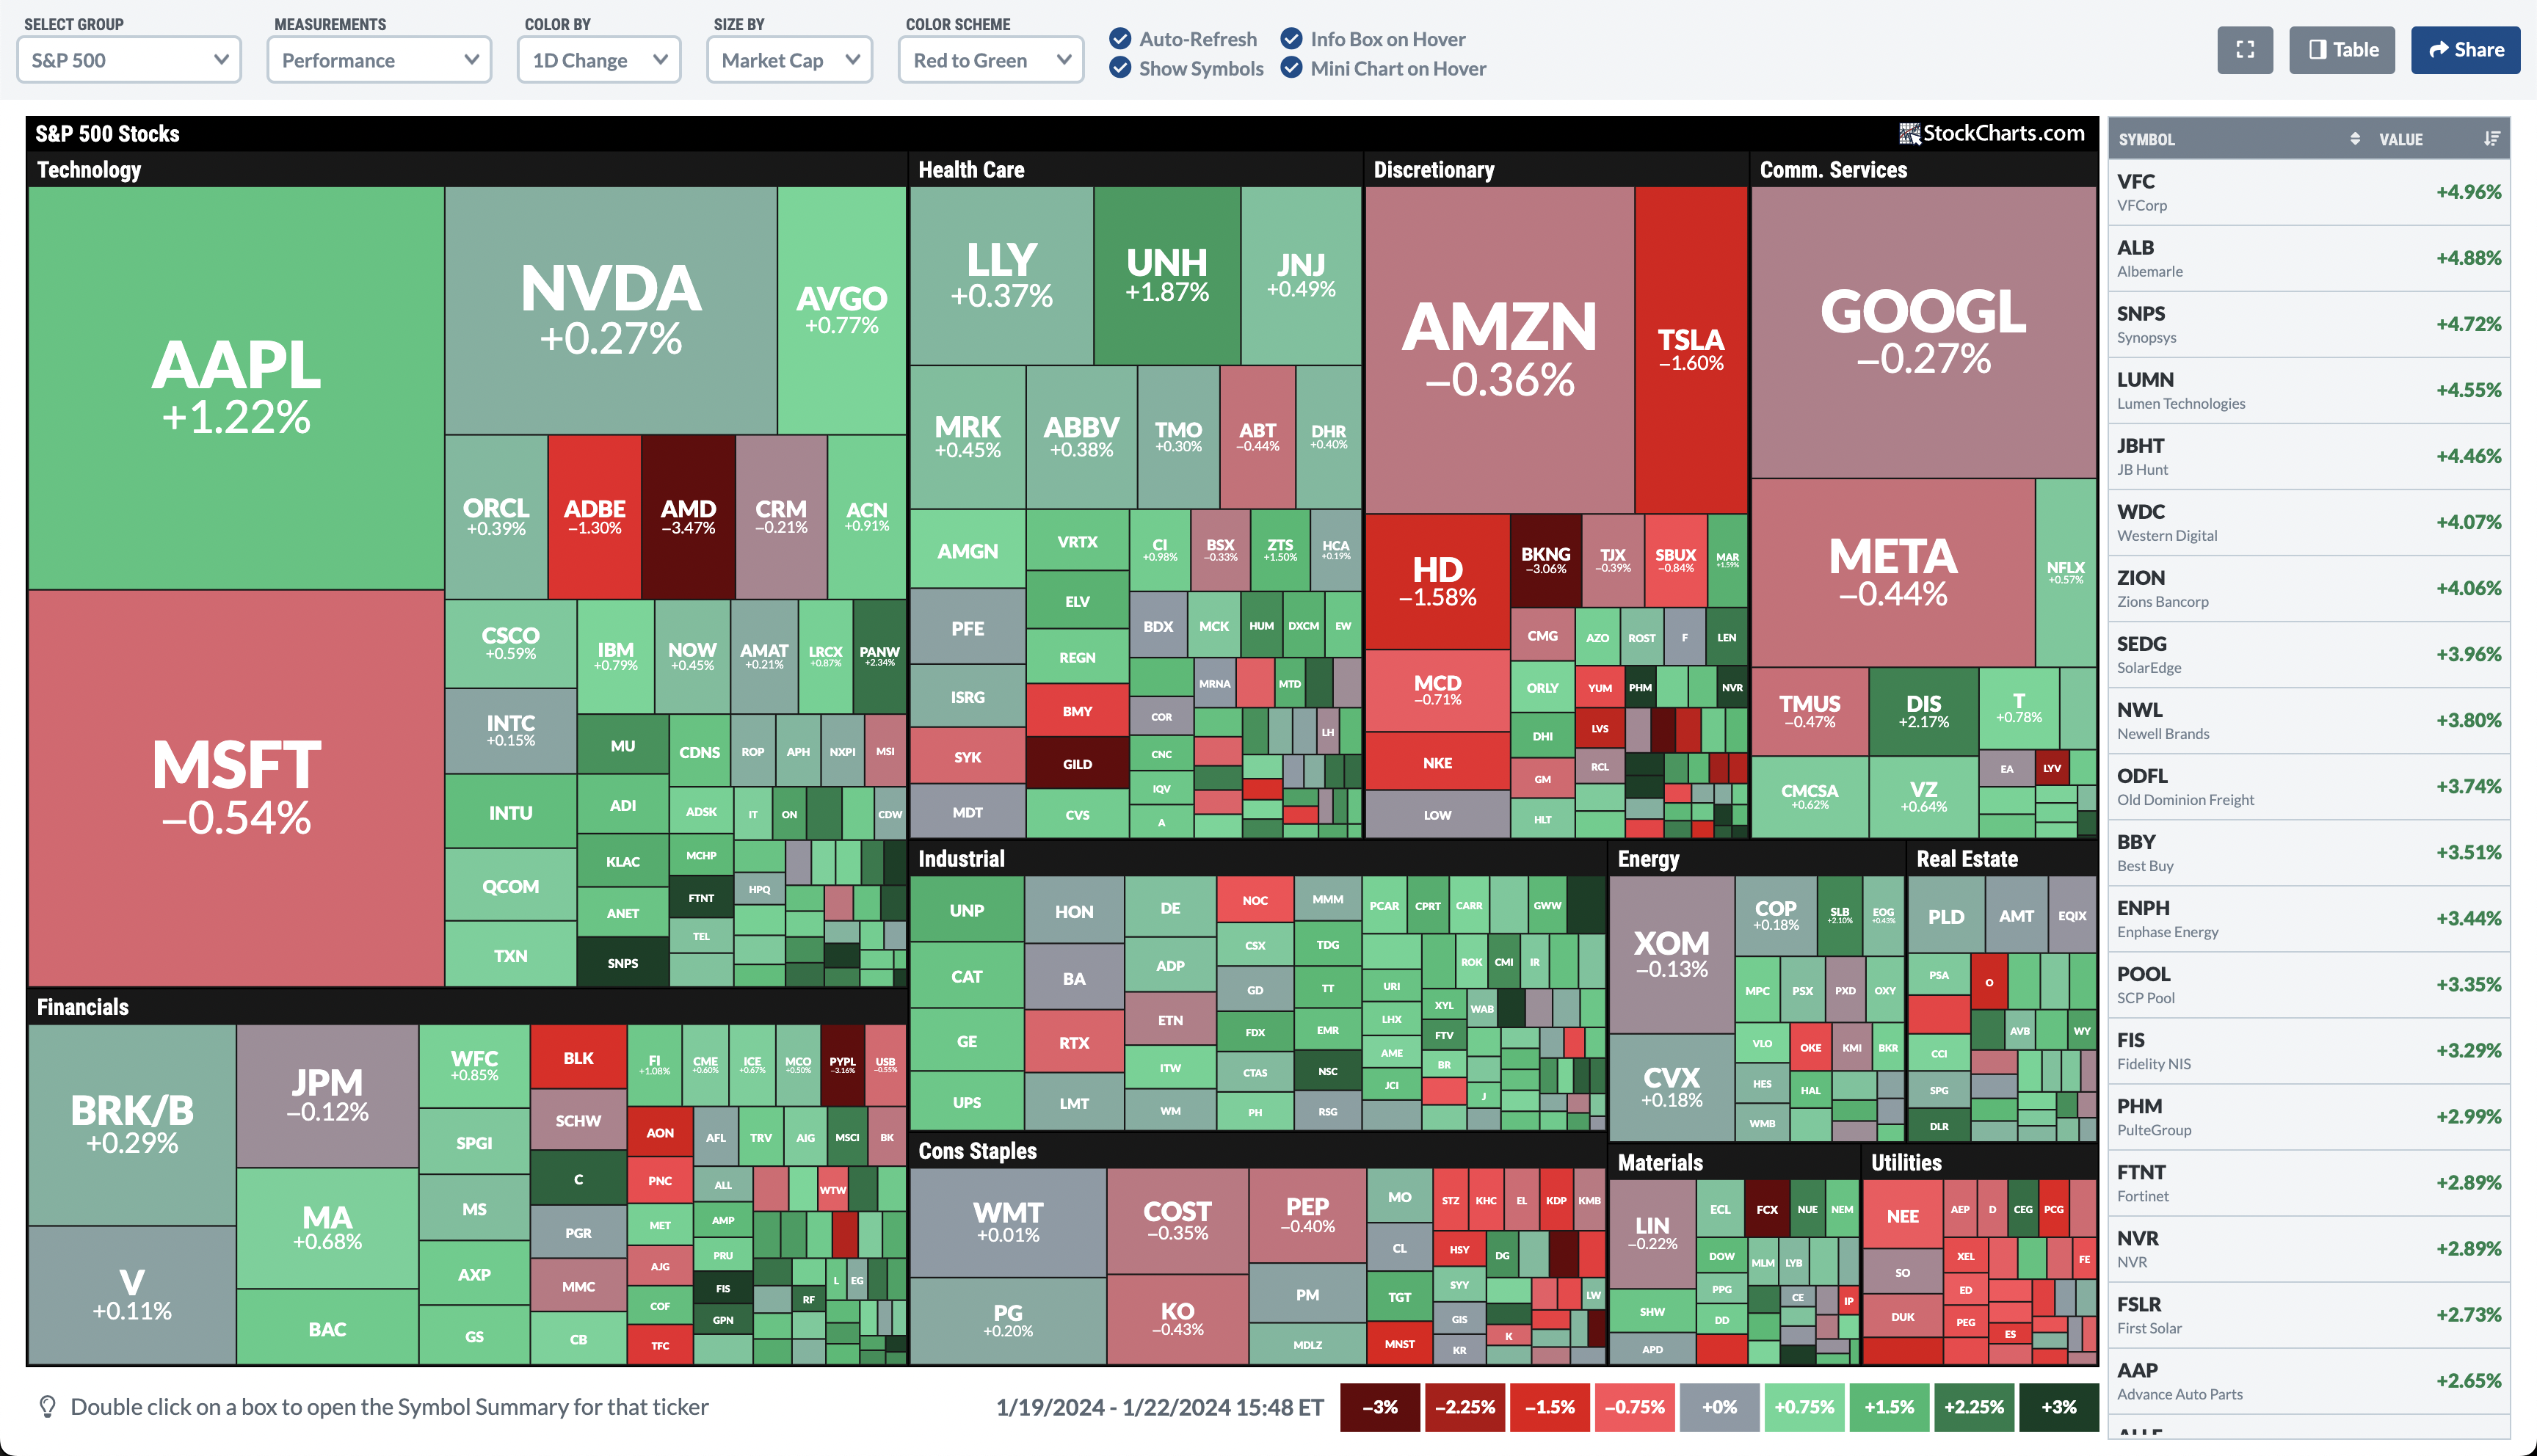
New Tools And Features Just Launched With Our Winter Product Release
A fresh round of sitewide updates brings you an exciting collection of dynamic new tools and features throughout StockCharts, including:
- The NEW SharpCharts Workbench: the next evolution of our classic charting platform
- Entirely redesigned MarketCarpet heat maps with enhanced interactivity
- Index Members summary page supercharges your stock research for key market groups
- Expanded Scan Results with full-sized SharpCharts and CandleGlance views
- Scans and alerts for Relative Strength against any benchmark symbol you want
- Scans and alerts for earnings dates
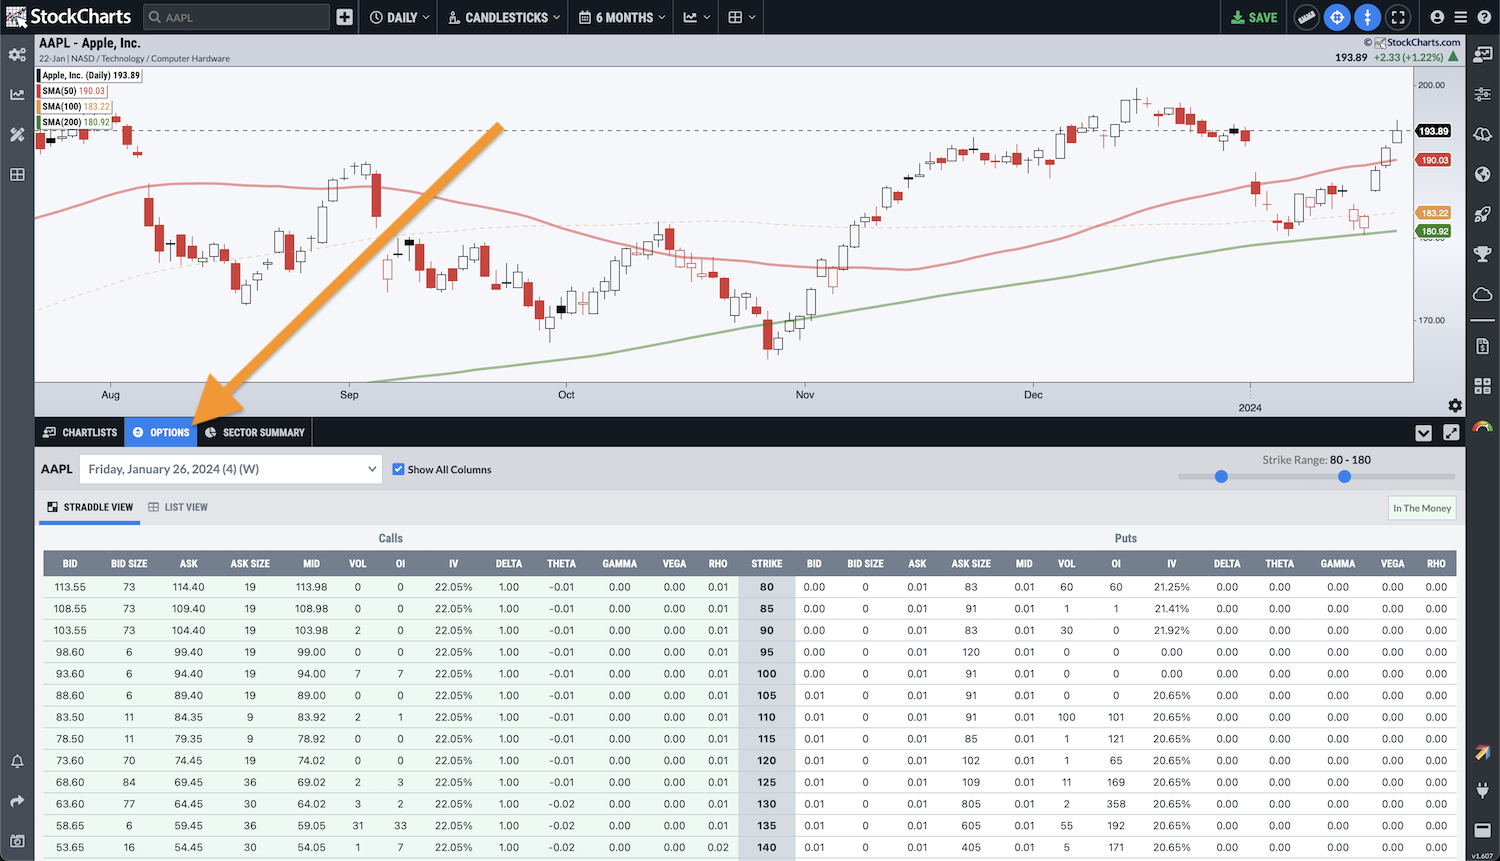
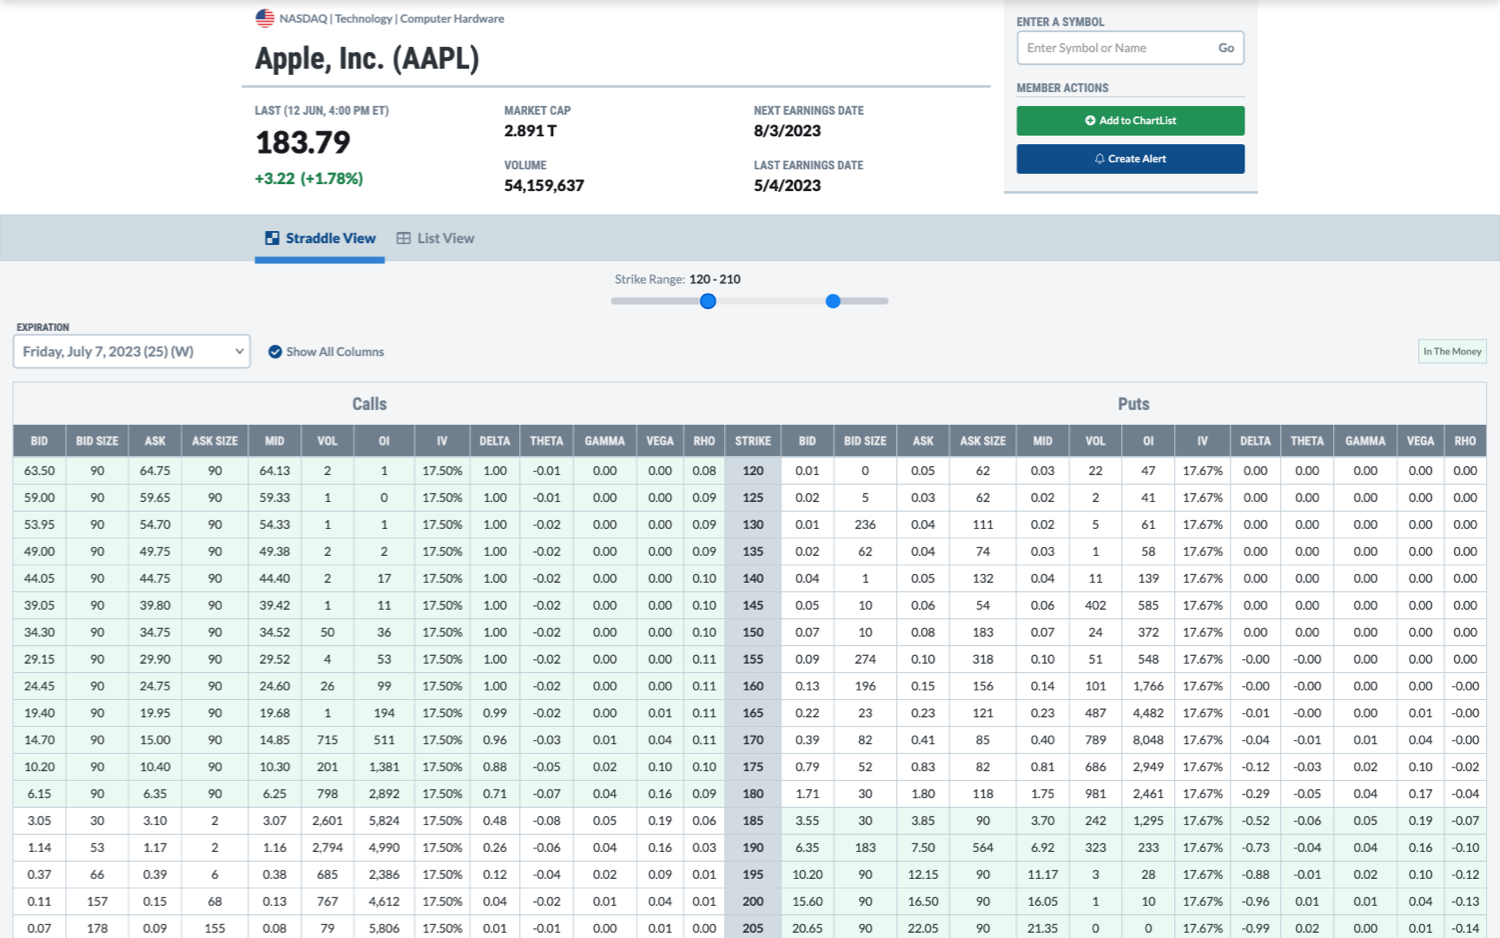
- Detailed options quotes right below your ACP charts
- Time-saving trade calculators in ACP help you enter new positions and set stops with ease
- Three new panel views bring new market insights to Your Dashboard
... AND MUCH MORE! Click the button below for full details.
-
6/23/23
New Tools And Features Just Launched With Our Spring Product Release
A fresh round of sitewide updates brings you an exciting collection of dynamic new tools and features throughout StockCharts, including:
- Expanded options quote tools, now with greeks data
- Earnings and revenue history now on the Symbol Summary page
- Add custom messages to any of your technical alerts
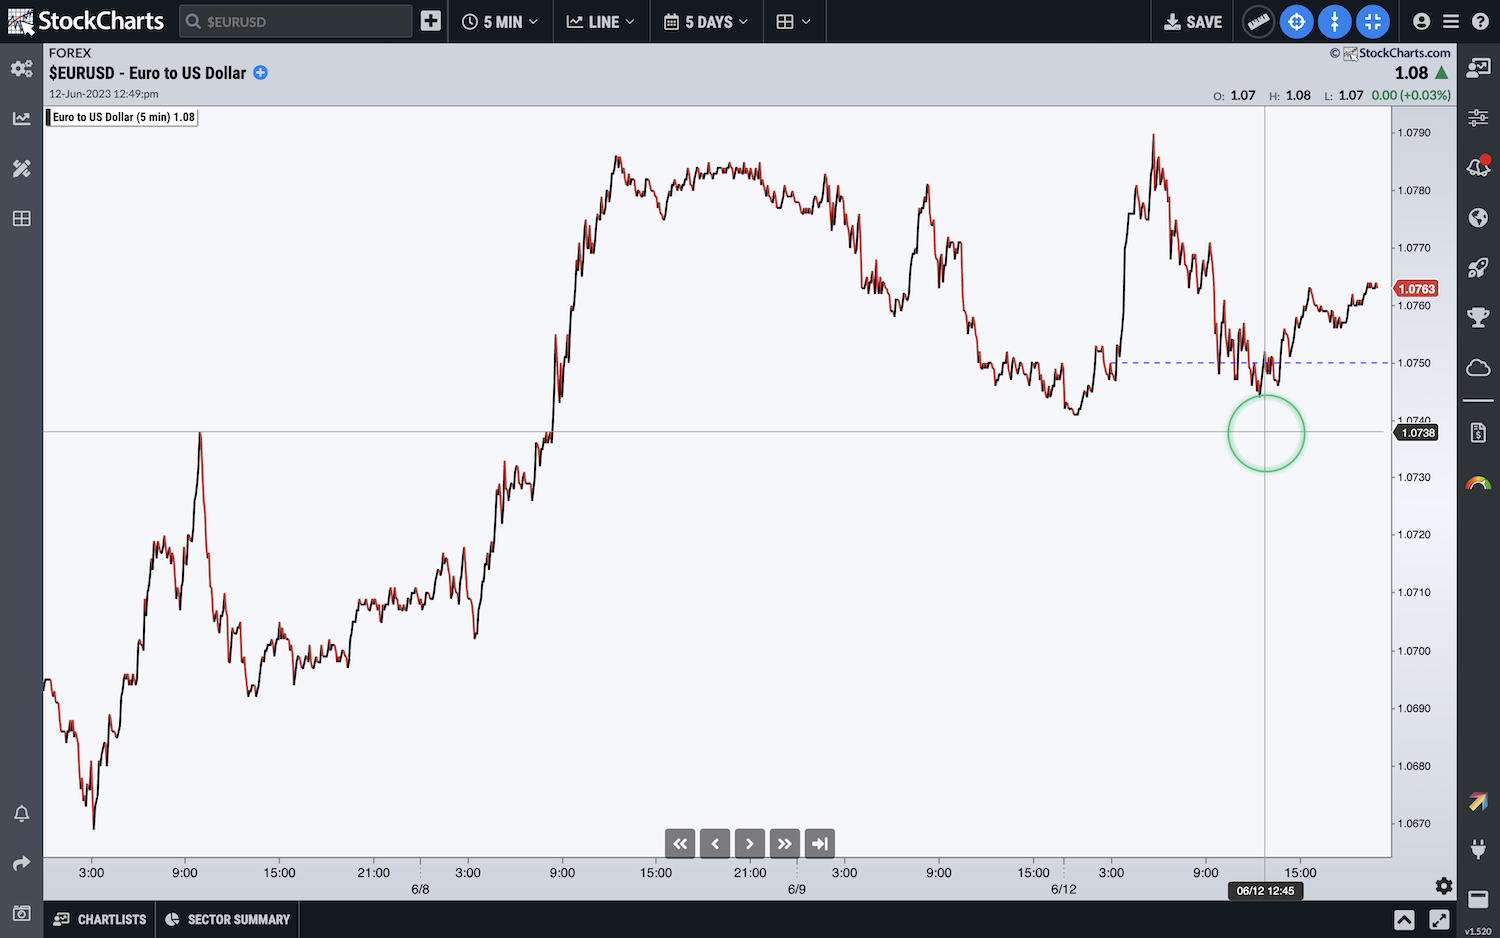
- Intraday FOREX data now available to chart
- Sector Summary tool integrated directly into the ACP drawer
- Dynamic measurement tool brings new power to your charting in ACP
- 7 new technical indicators in ACP help you chart highs, lows and key price levels
- Daily and weekly ChartList Reports now available for your ACP lists
- 8 new annotation tools for ACP
- Helpful group filters for the Earnings Calendar
... AND MUCH MORE! Click the button below for full details.
-
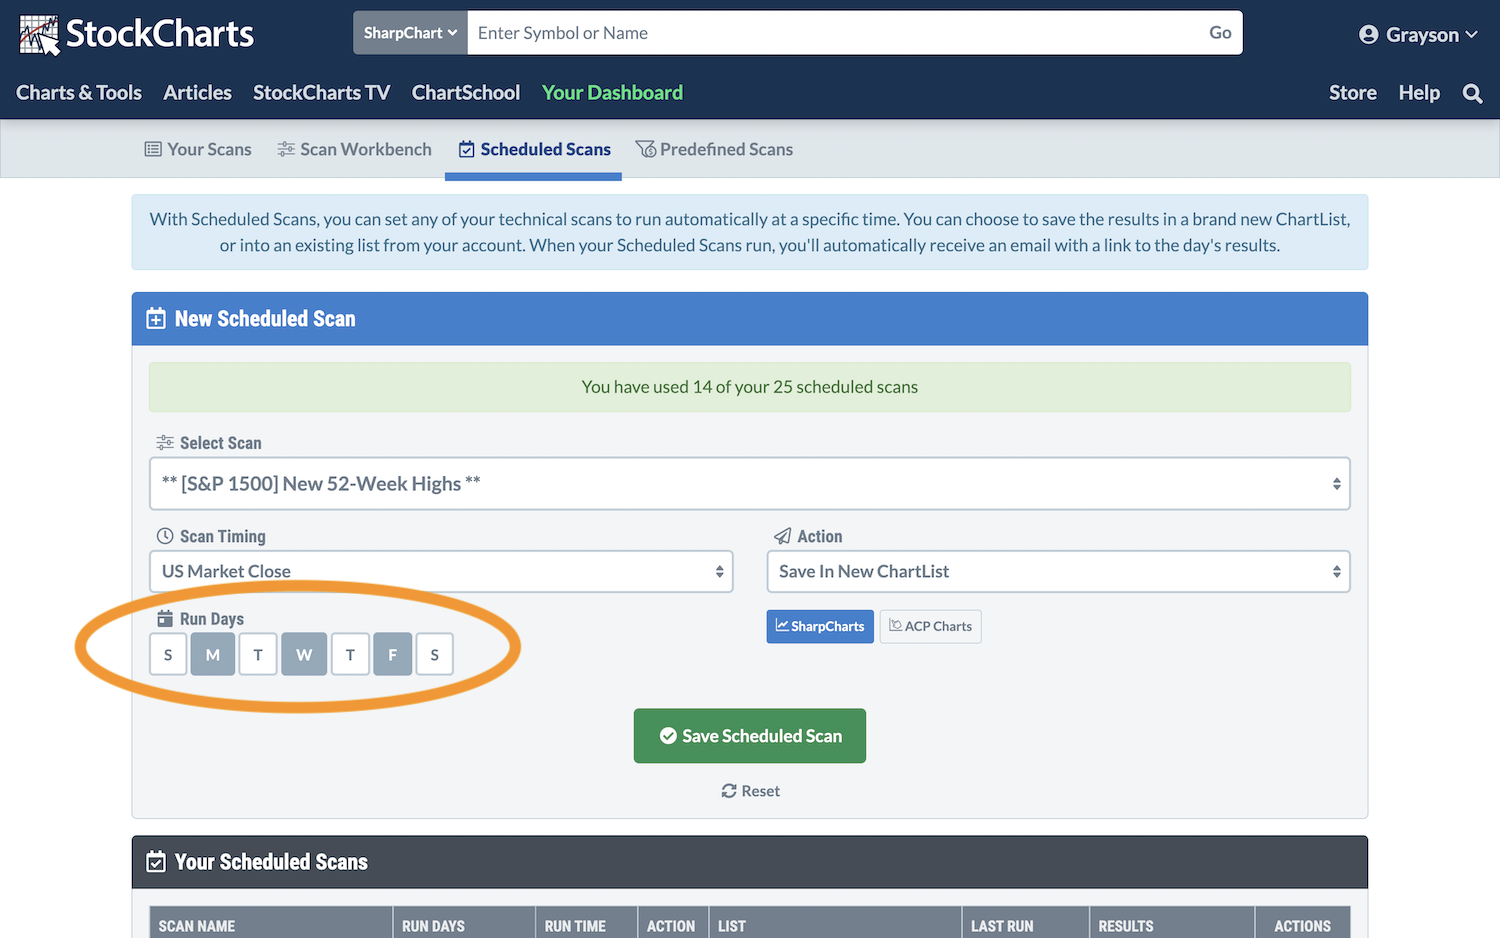
12/16/22
New Tools And Features Just Launched With Our "Camano" Product Release
A fresh round of sitewide updates brings you an exciting collection of dynamic new tools and features throughout StockCharts, including:
- The official StockCharts mobile app for iOS devices
- "Earnings Calendar" with reported results and upcoming announcement dates
- "Options Summary" page with calls, puts, and the complete chain table
- Set specific days and times for your Scheduled Scans
- Sample Chart Gallery gives you access to expertly-crafted chart templates
- Sample Scan Library lets you browse and run dozens of pre-built market screens
- Detachable annotations panel in ACP allows more room for your drawings
- Maximized indicator panels help focus your chart analysis in ACP
- Advanced alert editor
- Streamlined ChartList setup from Your Dashboard and all ChartList views
... AND MUCH MORE! Click the button below for full details.
-
7/18/22
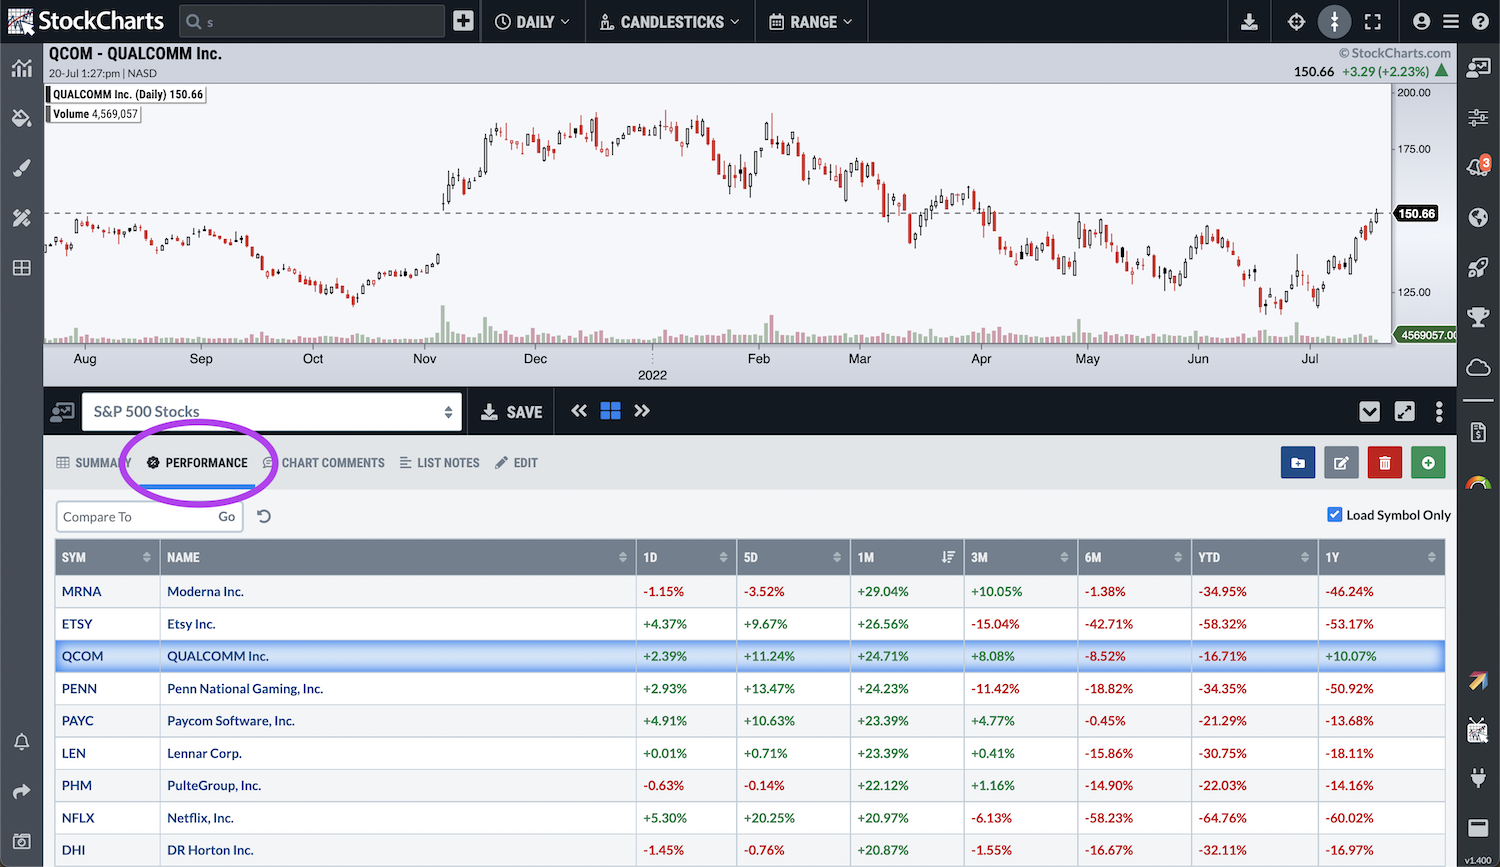
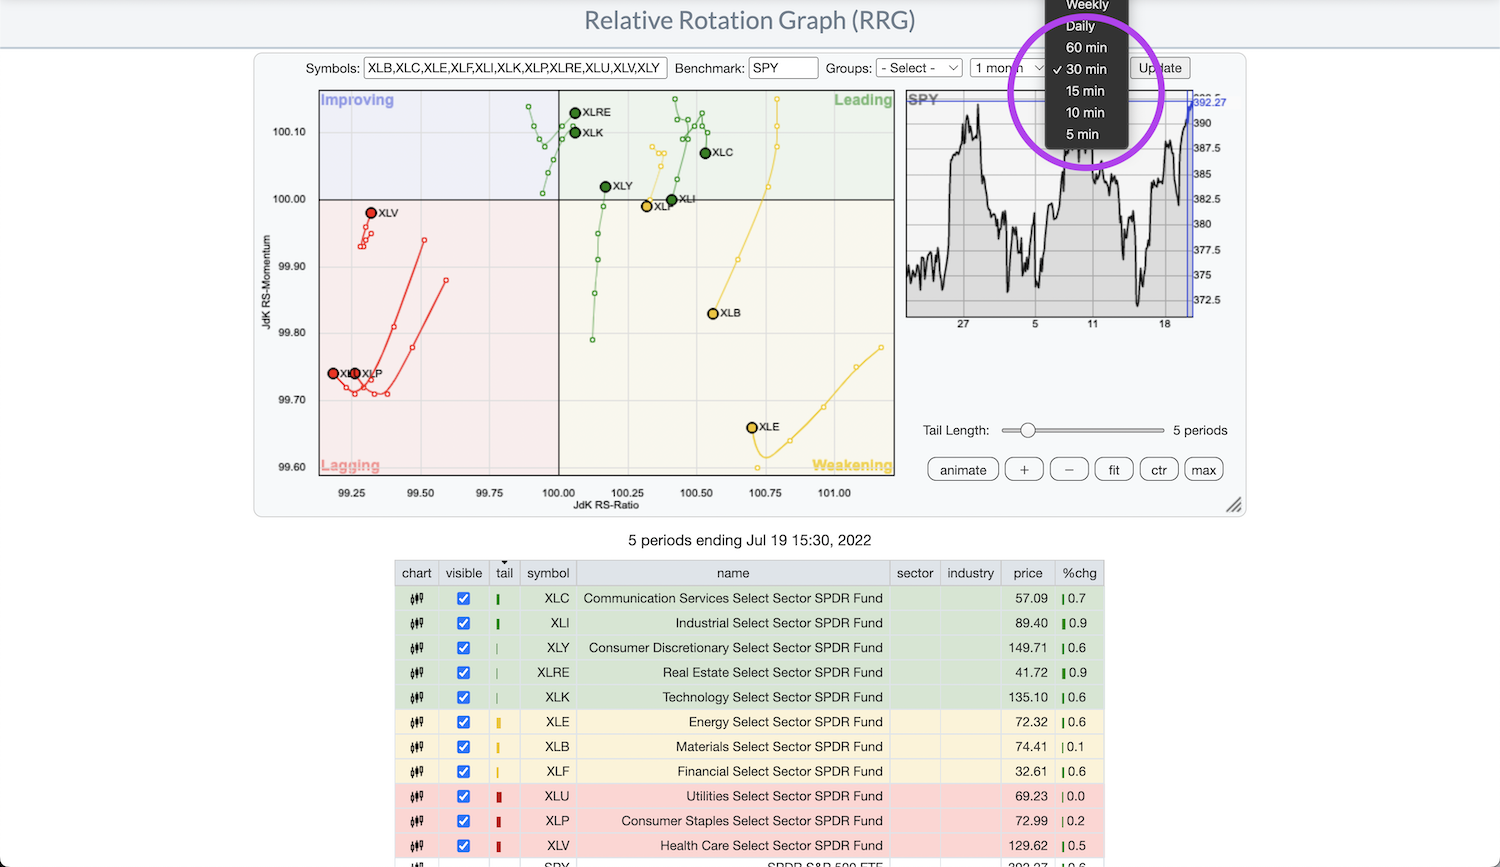
New Tools And Features Just Launched With Our "Bainbridge" Product Release
Another round of sitewide updates brings you an exciting collection of dynamic new tools and features throughout StockCharts, including:
- "Chart Panels" put your most important charts on Your Dashboard
- "Edit View" has been entirely redesigned to streamline your ChartList management
- Five new intraday chart periods that divide the trading day equally
- "Performance View" brings multi-timeframe price performance analysis to your ACP ChartLists
- Price Alerts displayed directly on your ACP charts
- Intraday RRG charts with five different chart periods
- “Earnings Dates” in Summary View for ChartLists
- Custom body, wick and outline colors for candlestick charts in ACP
- Live chat support now available
... AND MUCH MORE! Click the button below for full details.
-
3/31/22
New Tools And Features Just Launched With Our "Alki" Product Release
The latest round of sitewide updates brings you new features like Scheduled Scans, "Earnings Dates" chart markers, new ChartList views and more data options for Summary view
If you haven't heard already, we've recently revamped our approach to updating StockCharts. New "releases" will bring more tools and features to the site on a regular basis. And it all starts now with this month's "Alki" product release! A huge collection of dynamic new tools and features that just rolled out around the site, including:
- "Scheduled Scans" let you set your scans to run automatically at a specific time of your choosing
- "Scroll View" lets you scroll through an infinite feed of your saved charts
- "Performance View" shows price performance history over multiple time periods
- Nine new data options in "Summary View" for your ChartLists
- "Earnings Dates" chart markers
- A completely redesigned chart annotation experience in ACP
- Create scans and alerts for indicators from our ACP plug-ins
... AND MUCH MORE! Click the button below for full details.
-
2/4/22
Enhanced Scan Results Page With New Mini Charts Feature
The "Scan Results" page has just received a major refresh! Whether you're executing a custom technical scan with your own criteria or one of our ready-to-run predefined scans, the update includes an all-new layout that scales perfectly across all devices and screen sizes and an improved interface for saving scan results to your account. Most importantly, the new page also includes the ability to preview a mini chart of any symbol that matches your scan criteria.
-
11/19/21
The "Stock Market Mastery" ChartPack From Gatis And Grayson Roze
Master the markets and streamline your investing routines with this comprehensive ChartList framework.
Built around the time-tested investing roadmap from their book, “Tensile Trading: The 10 Essential Stages of Stock Market Mastery”, Gatis and Grayson Roze have designed the Stock Market Mastery ChartPack with one mission in mind – to make it easy for you to follow your routines, stay focused on the key charts that matter most, and make objective, disciplined decisions throughout your investing process.
The Stock Market Mastery ChartPack brings you a structured group of more than 75 ChartLists, all pre-populated with expertly designed charts and a carefully-crafted organization. This complete package will instantly add value for any StockCharts user, filling in your account with an expansive array of charts, symbols, data and ChartLists. Use it all as-is or draw inspiration from the framework and customize to create your own unique ChartList structure.
-
11/12/21
NEW! "Relative Volume Pack" ACP Plug-In
Dive deeper into your volume analysis and see money flow in an entirely new light with three unique RVOL indicators in this FREE plug-in
The latest addition to our growing collection of ACP plug-ins includes three new relative volume indicator variations: the traditional Relative Volume (RVOL) indicator, a unique Relative Volume "Price Plot" (RVOL-PP) overlay, and the Relative Volume "Time Of Day" (RVOL-TOD) indicator for intraday charts.
All three of these tools are designed to help you pinpoint high or low volume moves with ease and visualize money flow in entirely new ways. And with tons of flexibility built into each one, they can be completely customized to match your unique volume criteria.
With exclusive plug-ins from a wide variety of renowned indicator creators, technical experts and charting legends, we're partnering with the industry's best to bring you even more charting power in StockChartsACP. By installing any of our unique plug-ins, you can instantly enhance your ACP experience with additional indicators, overlays, chart customizations and more.
-
10/29/21
Introducing Two Exclusive "GoNoGo Charts" Plug-Ins For ACP
Carefully designed to help you simplify your charts and stay locked in on only the strongest moves in the market, the unique GoNoGo chart type and associated indicators bring a beautifully clean yet powerfully effective set of visual signals to your charts. Combining trend and momentum analysis into an intuitive, colored-coded package, the GoNoGo toolkit has one clear mission: keep you focused on price.
With the free "GoNoGo Starter Pack" plug-in, you can easily explore the basics of the GoNoGo charting approach within ACP.
When you're ready to put the entire toolkit to work, you can upgrade to the full set of indicators with the complete "GoNoGo Charts" plug-in.
With exclusive plug-ins from a wide variety of renowned indicator creators, technical experts and charting legends, we're partnering with the industry's best to bring you even more charting power in StockChartsACP. By installing any of our unique plug-ins, you can instantly enhance your ACP experience with additional indicators, overlays, chart customizations and more.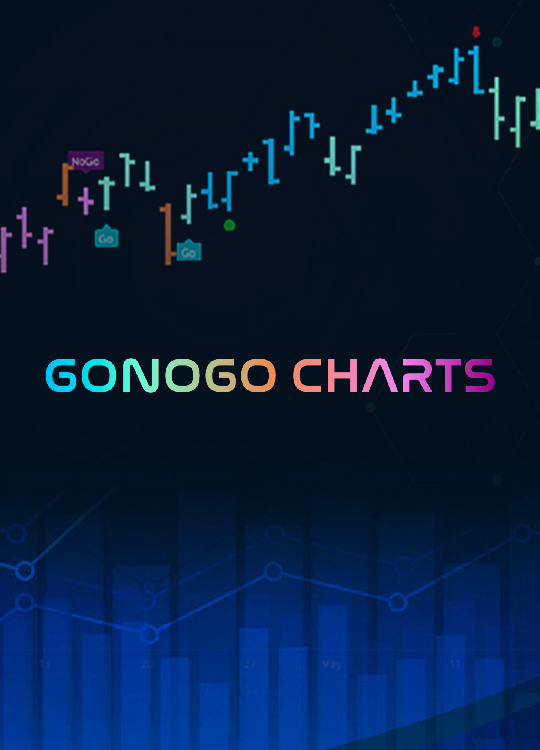
-
10/22/21
Enhanced ChartList Drawer Features In ACP
The new-and-improved "drawer" in ACP brings more features to your ChartList workflow, plus improvements to the StockCharts TV and Tradier Brokerage integrations
With a revised layout, new features in the Summary view, more accessible saved chart navigation and some upgraded list editing capabilities, your ChartList workflow in ACP just got a whole lot more powerful. We've even built in some helpful new SharpCharts options that allow you to easily view dynamic versions of your existing ChartLists right from within ACP.
Plus, additional enhancements within the drawer have made it even more than just a place to work with your ChartLists. It's also where you can watch StockCharts TV right from within the platform, and where you can trade directly from StockCharts via our Tradier Brokerage integration.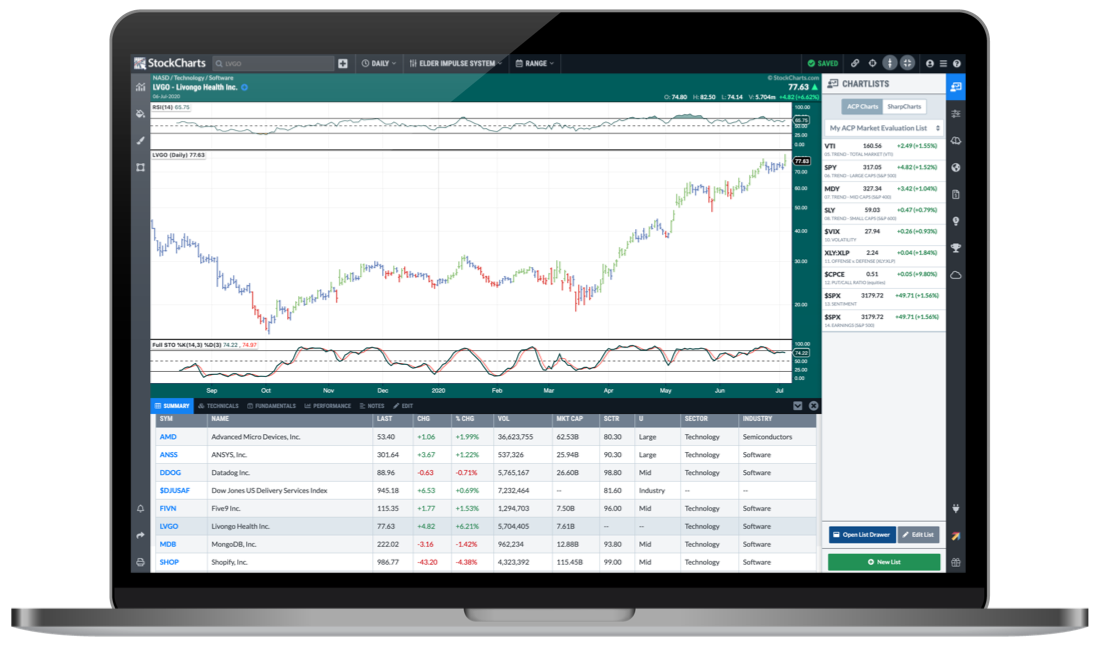
-
9/10/21
Introducing "The Moxie Indicator™" ACP Plug-In From Simpler Trading
While other traders get stopped out by fakeouts or enter too late, you can achieve faster account gains! Designed by veteran trader TG Watkins, the Moxie Indicator™ looks beyond price to identify big moves in stocks before they happen. TG wouldn't trade a day without it. It's the secret weapon behind his ability to pick precise stock trades. Besides its ability to pinpoint killer stock trades that follow a strict checklist focusing on account growth, the Moxie Indicator™, and TG's pre-trade checklist help keep him OUT of account-killing trades.
With exclusive plug-ins from a wide variety of renowned indicator creators, technical experts and charting legends, we're partnering with the industry's best to bring you even more charting power in StockChartsACP. By installing any of our unique plug-ins, you can instantly enhance your ACP experience with additional indicators, overlays, chart customizations and more.
-
8/27/21
Four New Indicators In Larry William's "Stock Trading Starter Pack" ACP Plug-In
The popular Larry Williams plug-in has just been enhanced with four additional indicators: WillVal, Williams VIXFIX, Williams Pinch/Paunch, and Williams Advance Decline Line!
With this unique ACP plug-in, you can use the exact same stock trading tools as Larry Williams, the man whose trading record has yet to be beaten. Each indicator serves a specific and separate purpose and together, these tools will spot trades for you — in advance. You will be able to confirm trades and with Larry's trend catching indicator, help you get into and hold on to winners. All of these tools work on daily and weekly bars, and Larry uses one on intraday charts as ;well.
With exclusive plug-ins from a wide variety of renowned indicator creators, technical experts and charting legends, we're partnering with the industry's best to bring you even more charting power in StockChartsACP. By installing any of our unique plug-ins, you can instantly enhance your ACP experience with additional indicators, overlays, chart customizations and more.
-
7/16/21
Introducing The "Chaikin Analytics Power Gauge Stock Rating" Plug-In For ACP
Take your analysis to the next level when you install the Chaikin Power Gauge Stock Rating plug-in powered by Chaikin Analytics! The Power Gauge Stock Rating is a 20-factor model that combines financial data (like return on equity and free cash flow) with earnings information, expert opinions, and technicals into one easy-to-understand rating from Very Bullish to Very Bearish. The Chaikin Power Gauge quantifies the research process of a stock’s fundamentals, giving you a clear picture that you can incorporate into your technical analysis.
With exclusive plug-ins from a wide variety of renowned indicator creators, technical experts and charting legends, we're partnering with the industry's best to bring you even more charting power in StockChartsACP. By installing any of our unique plug-ins, you can instantly enhance your ACP experience with additional indicators, overlays, chart customizations and more.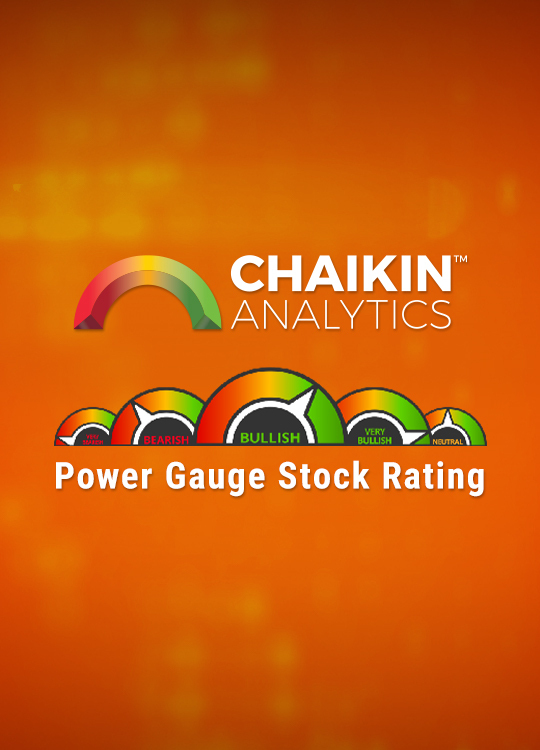
-
5/21/21
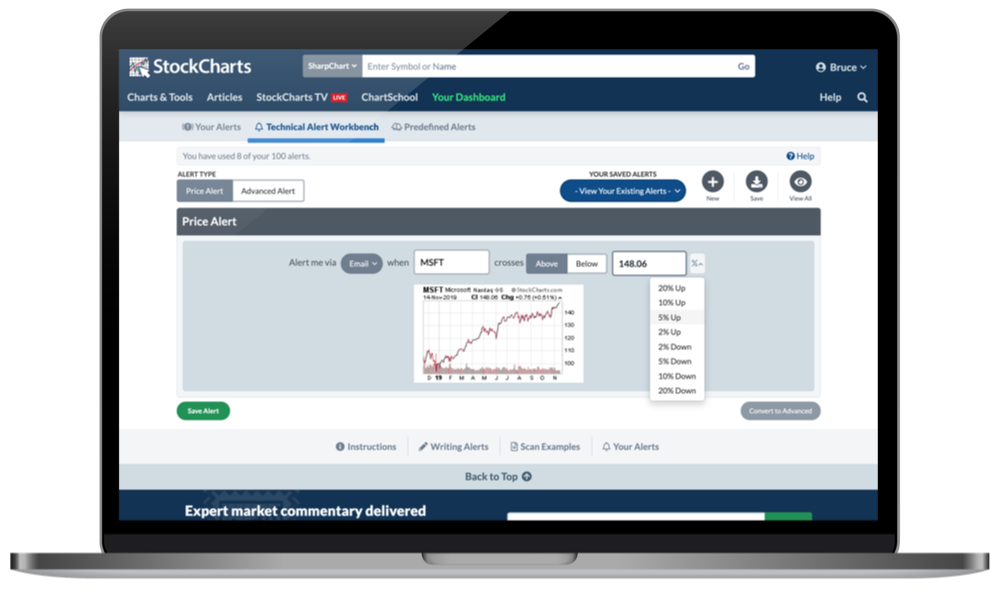
Major Price Alerts Expansion
Our Price Alerts feature gets a redesigned interface and a powerful new data engine behind the scenes that lets you create alerts for thousands of new symbols
We've introduced a significant update to our Price Alerts feature, including a simple and intuitive redesigned interface and a powerful new data engine behind the scenes. These changes allow you to create simple price alerts for thousands of new symbols on the site, including ratios!
-
5/20/21
Member Limits Increased, Giving You More ChartLists, Scans, Alerts & Saved Layouts
Your StockCharts account just got a bigger, with increase storage limits in almost every corner of the platform. All StockCharts members now have more ChartLists, more scans, more alerts, and more multi-chart layouts in ACP. We've also introduced introduced scans and alerts for Basic members.
Pro members now have 500 ChartLists, 500 scans, 500 price alerts, 250 advanced technical alerts and 50 saved layouts in ACP. Extra members now have 250 ChartLists, 200 scans, 200 price alerts, 100 advanced technical alerts and 25 saved layouts in ACP. Basic members now have 1 ChartList, 1 scan, 2 price alerts, 1 advanced technical alert and 1 saved layout in ACP.
-
4/23/21
10 Times More Crypto Data
Chart And Analyze Up To 150 Different Coins On StockCharts
In a major expansion of our cryptocurrency coverage, you can now chart and analyze up to 150 different cryptocurrencies on StockCharts. See the growing digital asset space like never before, with advanced charting tools and resources for a wide range of coins. Plus, run scans across the entire crypto universe to find new opportunites, and stay ahead of what's happening in the crypto market with custom technical alerts for every coin on StockCharts.
-
3/26/21
New Enhancements To ACP With v1.2
Another major update to ACP has arrived, with new features, new tools, new enhancements and more technical charting power than ever before. Version 1.2 is officially here, ready for you to explore and enjoy.
In addition to an entirely new data delivery pipeline behind the scenes, the latest version includes the ability to save symbols to your multi-chart layouts, updates to the "chart outline", tons of new settings to help you customize your charts, price alerts in a single click, a handy new maximize feature on the ChartLists drawer and even the ability to watch StockCharts TV right from within ACP.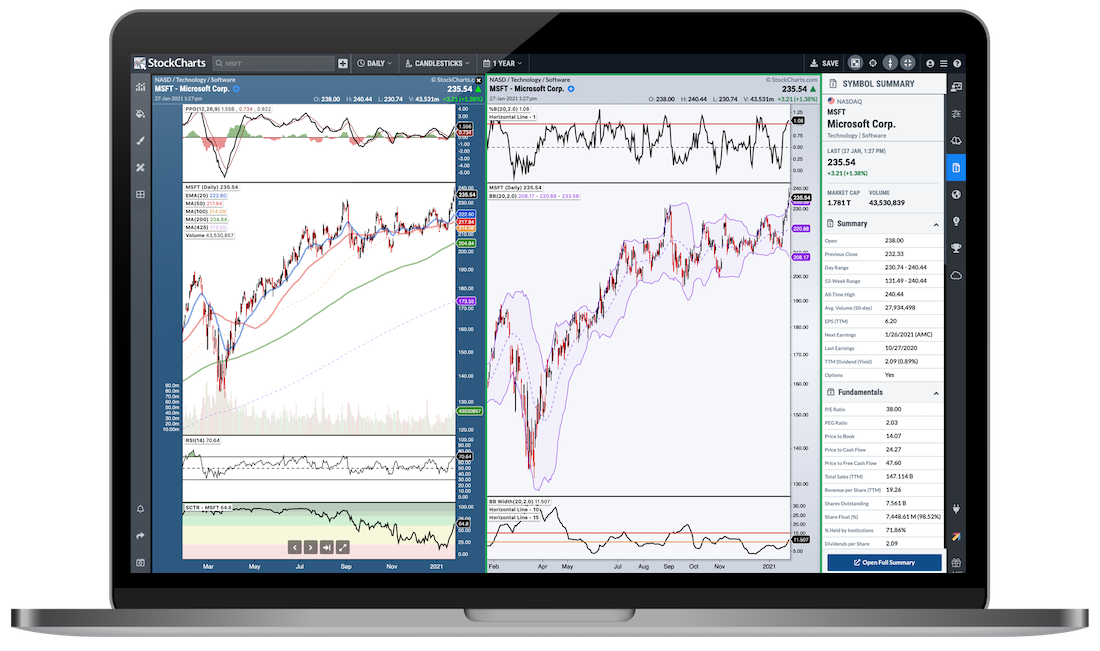
-
2/27/21
Introducing StockCharts TV "On Demand"
Watch StockCharts TV Any Time From Any Device, With New Apps On Apple TV, Amazon, Android, Android TV, Chromecast, Fire TV, iOS And Roku
With an entirely new way to follow the content that you know and love on the channel, the On Demand platform brings StockCharts TV to all of your devices with a seamless, connected experience. Sign up for a free account to watch across apps on your Apple TV, Roku, Android TV and more, mobile apps for your iPhone, iPad and android devices and browser-based access at StockChartsTV.com. And it's all available for you to stream whatever, whenever, wherever – for free.
The new On Demand platform builds on the live viewing experience that you're used to following on StockCharts, and will also complement the content that you see up on our YouTube channel. Ultimately, this move gives you even more ways to watch and stay on top of the markets, no matter where you are or what device you're using.
-
2/12/21
Extended Hours Charting For Pre- And Post-Market
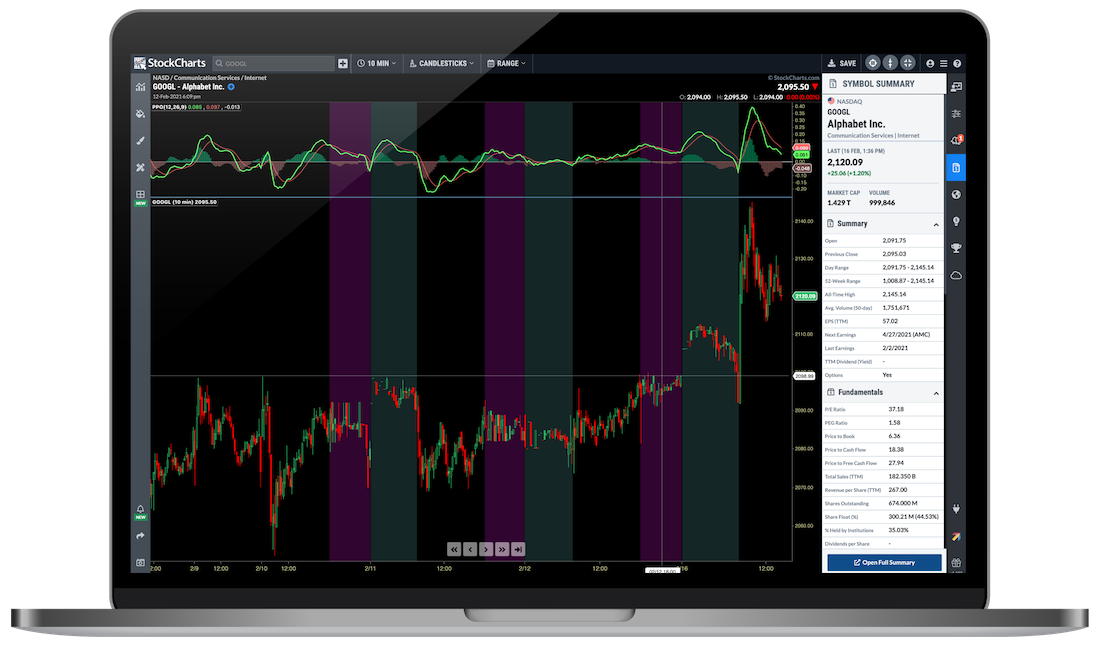
In both SharpCharts and ACP, you now have the option to turn on "Extended Hours" and view after-hours data on your intraday charts. The addition of pre- and post-market charting on StockCharts will help you keep an even closer eye on the stocks you're following and see the full picture of all market activity. Plus, view pre- and post-market quotes on the Symbol Summary page.
-
2/5/21
Create Price Alerts From Your ACP Charts
You can now create price alerts for the stocks, funds and indexes you're watching simply by clicking on the chart. Pinpoint the specific price you're tracking and in one click, you can set an alert for that symbol at your desired price. Whenever triggered, you'll automatically receive notifications via email, text and/or a site notification on StockCharts.
To create an alert from ACP, launch the platform and click the bell icon on the left side of the screen. With the "Alerts" panel open, hover over the chart and click where you want to set your price alert. Then choose "Crosses Above" or "Crosses Below", select your notification type and click "Save Alert" at the bottom of the panel.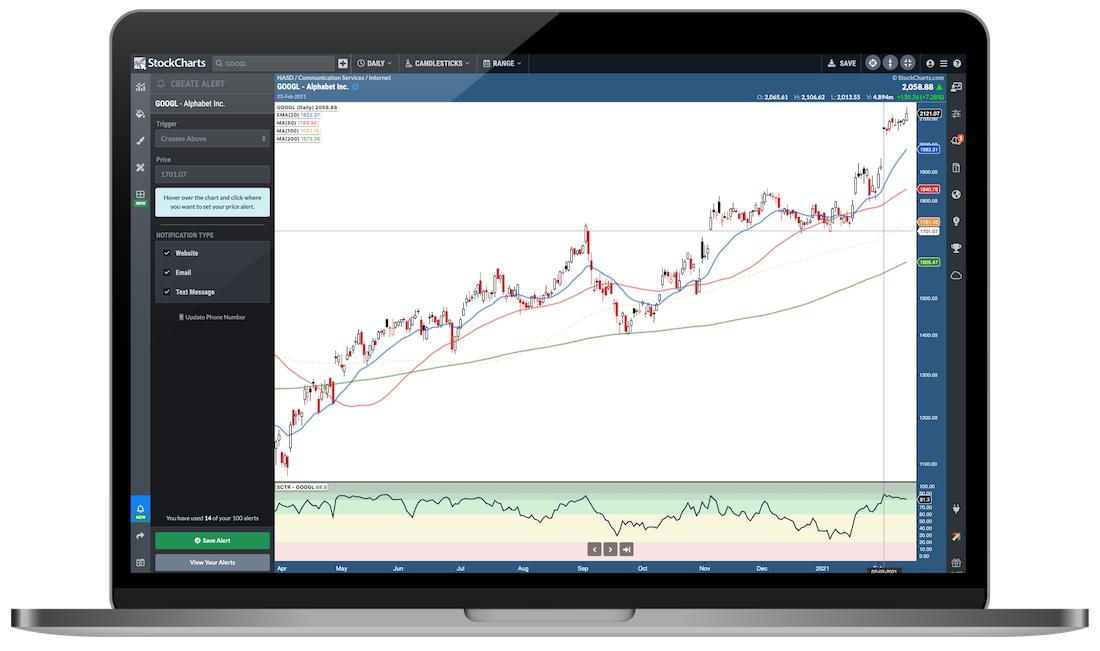
-
1/15/21
Multi-Chart Layouts In ACP
Create And Save Advanced Multi-Chart Layouts With Up To 12 Charts On The Screen At Once
You can now view up to 12 advanced technical charts on your screen at once with dozens of unique layout configurations. Create multi-timeframe views for the stocks and indexes you’re watching, or visualize your entire portfolio on a single screen. Plus, save your custom multi-chart layouts to your account for later use. With the new layout capabilities, ACP puts more charting power in your hands than ever before!
To create layouts in ACP, launch the platform and click the layouts icon on the left side of the screen. Use the "Create Layout" menu to build your own view, then save it to your account with the "Save Layout" button at the bottom of the panel. You can also explore the "Sample Layouts" at the top of the panel and use these powerful predefined views to quickly get started with multi-chart layouts in ACP.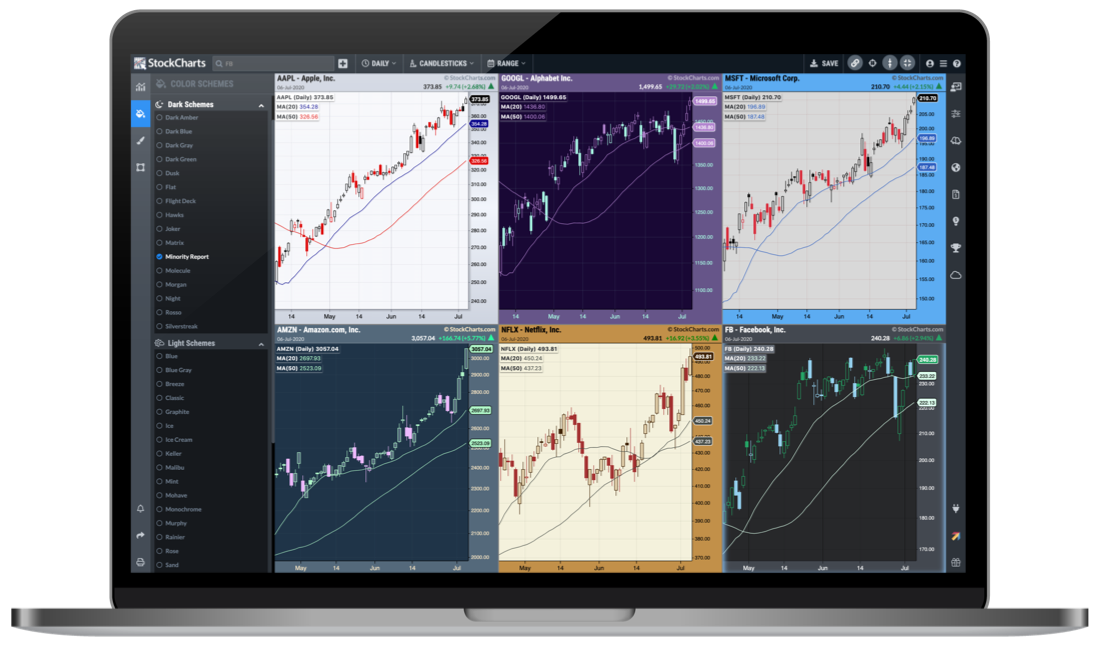
-
11/20/20
Now Playing: "StockCharts In Focus" on StockCharts TV
Join Grayson Roze, VP of Operations at StockCharts, as he guides you through the latest and greatest additions to the StockCharts platform. Packed with tips, tricks and insightful tutorials, each week's episode of "StockCharts In Focus" is carefully designed to help you maximize all that StockCharts has to offer. Explore new tools, uncover powerful features, discover site shortcuts and chart customizations you didn't know about and stay up on the latest content coming to StockCharts TV.
New episodes air Fridays at 3:30pm ET, only on StockCharts TV.
-
11/18/20
Run Scans In ACP
You Can Now Run Advanced Technical Scans Directly Within StockChartsACP, Our Full-Screen, Interactive Advanced Charting Platform
StockChartsACP now includes the ability to run advanced technical scans right from the platform, both your own custom scans and predefined options that we've created for you. With this exciting addition, our full-screen, interactive Advanced Charting Platform is now more powerful than ever before.
To access scans from ACP, launch the platform and click the scans icon on the right side of the screen. Using the tabs at the top of the panel, choose Your Scans to run custom technical scans you've created and saved to your account, or Predefined to choose from a wide array of pre-created scans we've set up for you. Select a scan and click "Run", and you'll instantly see a list of matching results right there in ACP. Click any of the entries in the matching results list to pull up a chart for that symbol.
-
11/16/20
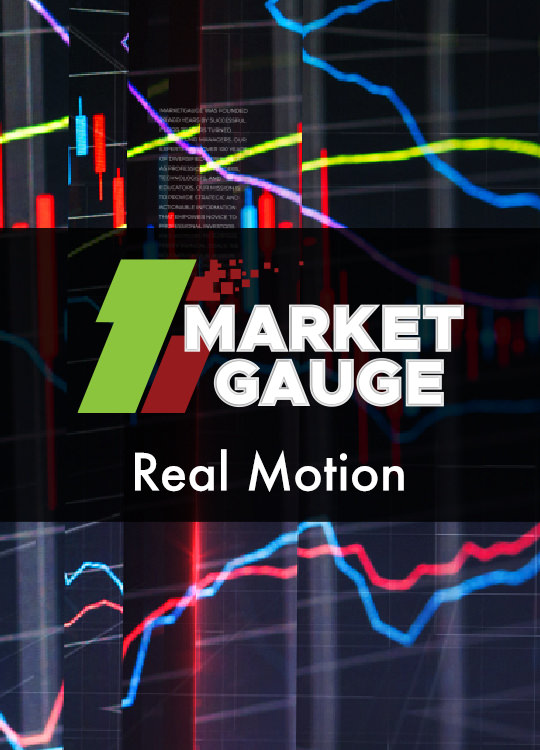
Introducing Two New ACP Plug-Ins From MarketGauge: "Triple Play Indicators" and "Real Motion"
We are thrilled to announce the introduction of two new powerful ACP plug-ins from the MarketGauge team: the "Triple Play Indicators" plug-in and the "Real Motion" plug-in. Designed by veteran traders Mish and Keith Scheider, you can equip yourself with the same unique charting tools they've used to prosper in the markets for decades.
With exclusive plug-ins from a wide variety of renowned indicator creators, technical experts and charting legends, we're partnering with the industry's best to bring you even more charting power in StockChartsACP. By installing any of our unique plug-ins, you can instantly enhance your ACP experience with additional indicators, overlays, chart customizations and more.
-
10/30/20
"Symbol Summary" Now In StockChartsACP
Our new full-screen, interactive Advanced Charting Platform, StockChartsACP, now includes more data than ever before with the addition of "Symbol Summary". Designed to complement the "Full Quote" option on your charts, the Symbol Summary panel provides an expanded overview for the symbols we cover on the site. You can now view after-hours data, key fundamental figures, technical stats, earnings dates, dividend details, corporate information, SCTR rank and more - all in a concise layout conveniently displayed right next to your ACP charts.
To access the Symbol Summary view, launch StockChartsACP and click the file icon on the right side of the screen. The "Symbol Summary" panel will open and automatically load data for the primary symbol on your active chart. As you change the chart and switch from one symbol to the next, the Symbol Summary panel will follow along with you.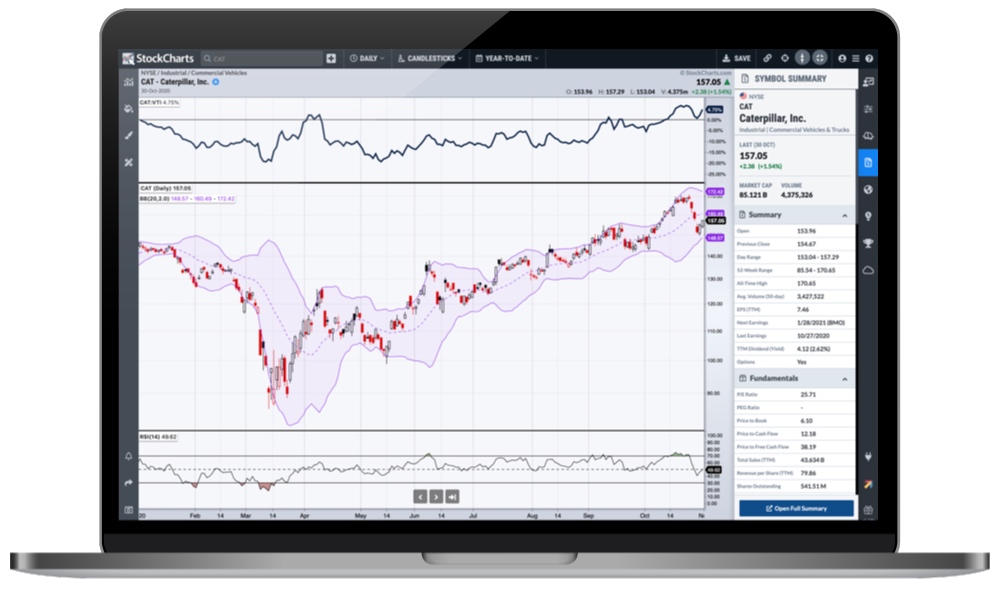
-
10/19/20
"The Presidential Cycle Panel" feat. Tom McClellan, Jeff Hirsch and Bruce Fraser
Tom McClellan, Jeff Hirsch, and Bruce Fraser sit down with David Keller to share their unique insights into the presidential cycle from a technical market perspective. Together, these charting wizards will dig into what the presidential cycle means in an election year, what the historical trends tend to be around this all-important period, and how 2020 may differ from the historical cycles we've seen in past elections.

-
9/22/20
"Introducing StockChartsACP: The Future of Technical Analysis"
Our new interactive Advanced Charting Platform - StockChartsACP - has arrived, and we're taking a deep dive into the future of Technical Analysis with some of the industry's top chartists and most seasoned strategists.
Join Chip Anderson (Founder and President, StockCharts), Grayson Roze (VP of Operations, StockCharts) and David Keller (Chief Market Strategist, StockCharts) as they sit down for an exclusive series of in-depth discussions with charting legends like John Murphy, Ralph Acampora, Martin Pring, Larry Williams, Arthur Hill, Dave Landry, Mish Schneider and others.
In these fascinating conversations, you'll hear their perspectives on how charting and technical analysis have evolved over the years and, of course, dig into the features of ACP to explore how the experts are using the platform in their own approach to today's markets.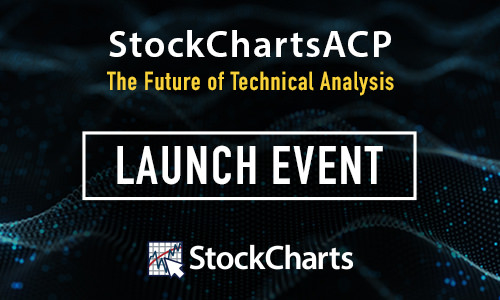
-
7/7/20
"StockChartsACP" Has Arrived!
Our New Interactive, Full-Screen Advanced Charting Platform – The Next Generation of StockCharts Technology and The Future of Technical Analysis
We are thrilled to announce the official version 1.0 release of StockChartsACP. Designed to transform the way you view the financial markets, ACP brings you an ultra-dynamic, highly-engaging, insanely-flexible charting experience unlike anything you've seen before. We've taken our award-winning approach to charting and turned it up to 11.
True full-screen charting is now at your fingertips, with an interactive experience that allows you to scroll through time on your charts like never before. Stunning visualizations, dozens of indicators, overlays, and chart types, advanced customizations and powerful integrations directly in the charting platform - it's all there in ACP.
Electrify your analysis with striking, unique color schemes, and create customizable multi-chart layouts at the click of a button. Save your charts and custom ChartStyles, and even access exclusive plug-ins from industry-leading chartists and renowned indicator creators.
Plus, with StockChartsACP, we're introducing a powerful integration with Tradier Brokerage. StockCharts Members can now get unlimited, commission-free trading for US equities, right on ACP. Streamline your investing workflow with advanced charting and lightning-fast trade execution, all in one powerful platform.
-
4/20/20
Now Playing: "Your Daily Five" on StockCharts TV
With key insights and top charts from leading analysts, "Your Daily Five" is a concise yet action-packed daily rundown of the five most important charts you need to be watching. Each episode during the week features a different host, bringing a wide variety of perspectives and strategies to your screen every day.
New episodes air weekdays at 1:00pm ET, only on StockCharts TV.
-
4/16/20
"The Big Board: Behind The Scenes At The NYSE"
In this two-part special from StockCharts TV, David Keller, CMT (Chief Market Strategist, StockCharts) and Grayson Roze (VP of Operations, StockCharts) receive a behind the scenes tour of the historic NYSE trading floor from Jay Woods, CMT, Executive Floor Governor and designated market maker with IMC.
Learn about the history of the exchange, see how the traders on the floor operate, hear how charts factor into Jay's unique role as a market maker and go inside the heart of global finance in this rare, in-depth exploration of the New York Stock Exchange.
-
4/7/20
"Navigating a Bear Market" ChartPack
Exclusively for StockCharts Members, we've collected the most important charts from 13 of our top contributors and organized them in a special "Navigating a Bear Market" ChartPack that you can install right into your own StockCharts account.
Based on the presentations that were covered in our recent StockCharts TV special, "Navigating a Bear Market", you'll be able bring these experts' charts straight into your own workflow and follow along with the presentations while analyzing the latest charts in your own account. We've even included three bonus lists with charts from John Murphy, Martin Pring and Grayson Roze.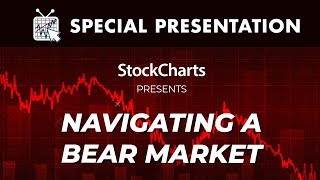
-
4/1/20
"The Pitch: 15 Stock Ideas In Uncertain Times" on StockCharts TV
Three of our top contributors - Tom Bowley (EarningsBeats.com), Mary Ellen McGonagle (MEM Investment Research) and Grayson Roze (VP of Operations, StockCharts) - sit down with David Keller to share five of their most strategic stock picks for today's chaotic conditions.
Dive into the action with these seasoned equity analysts as they reveal the themes they are tracking, names they are following, and the charts they are watching to find strength in a time of uncertainty for markets. Plus, see how they respond as David Keller brings our three experts together for a Q&A session to close out the panel.
-
4/1/20
Now Playing: "Mish's Market Minute" on StockCharts TV
Join veteran swing trader Mish Schneider weekly on "Mish's Market Minute" as she covers key market relationships across equities, commodities, bonds and currencies. She'll talk you through the action, walk you through her charts and demonstrate how her trading plans are evolving for the current climate.
New episodes air Fridays at 12:30pm ET, only on StockCharts TV.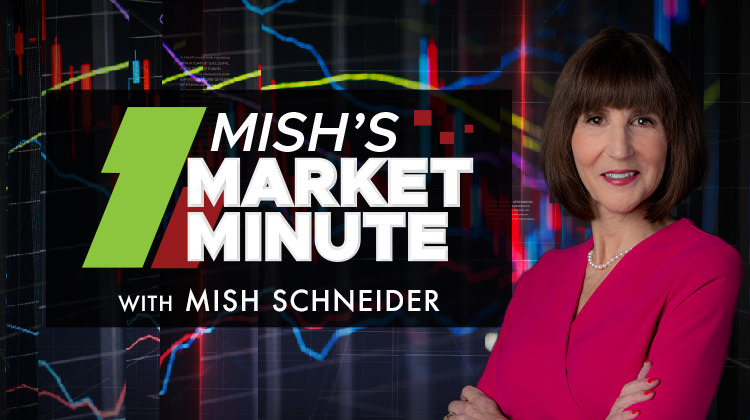
-
2/21/20
Pre- And Post-Market Data, Now On "Symbol Summary"
Expanding on our new "Symbol Summary" research tool, we've added after-hours data for both the pre- and post-market trading sessions. You can now view after-hours moves for US stocks and many major ETFs, helping see how the markets are reacting to earnings reports or the latest company news.
With pre- and post-market pricing added to "Symbol Summary", our team is now working on incorporating this data into our charts and other pages around the site. Stay tuned for much more coming soon!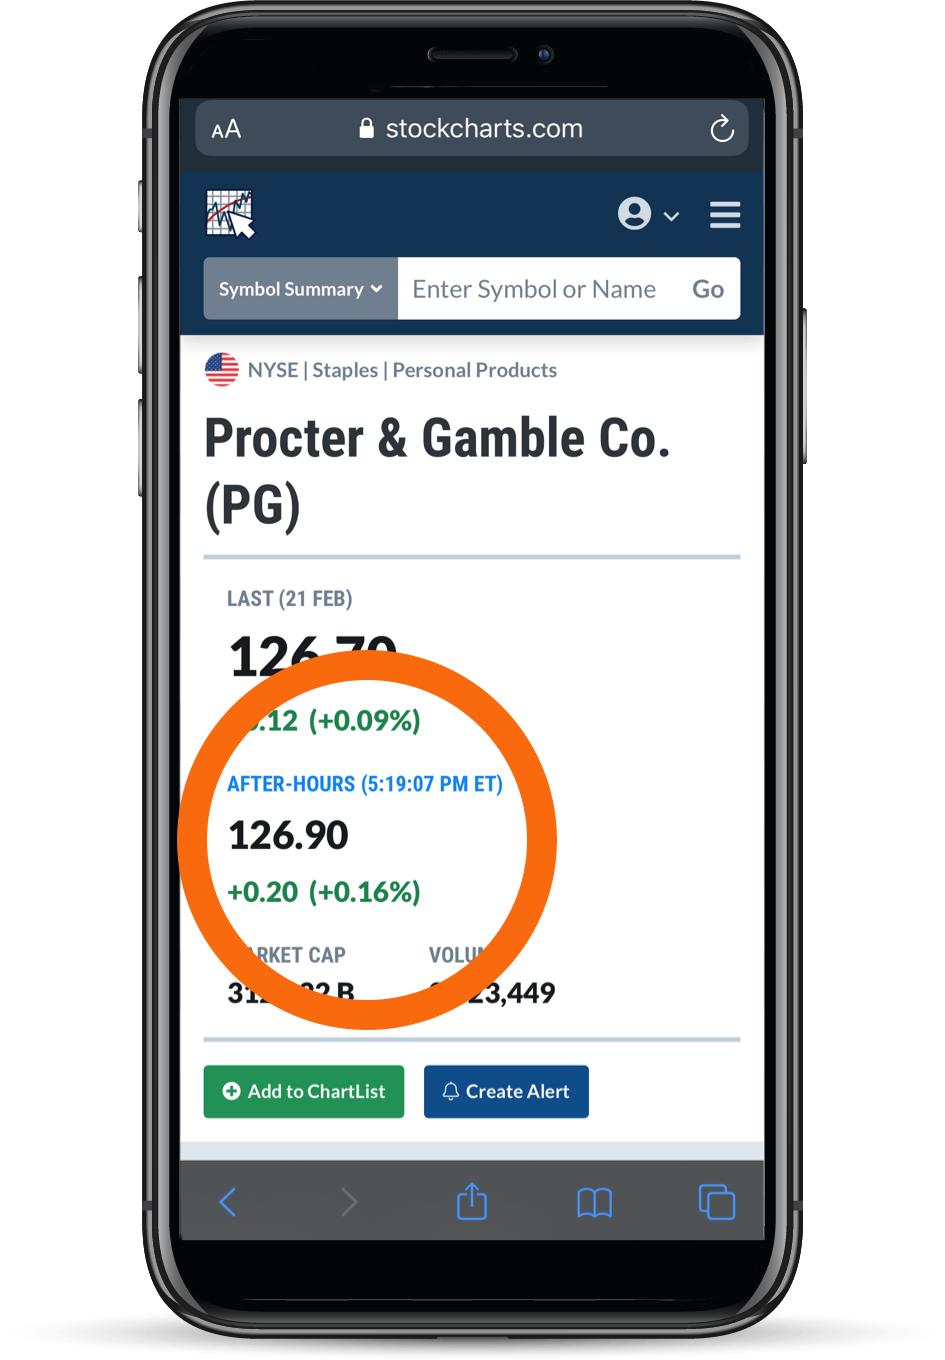
-
2/10/20
Now Playing: "Behind The Charts" on StockCharts TV
Featuring exclusive, behind-the-scenes interviews with the charting world's very best technical minds and financial analysts, this unique show brings you timeless wisdom and invaluable insights each and every week. Hear the stories behind the legends and the history that made them such successful market technicians as we take you "Behind The Charts".
Catch new episodes LIVE, Mondays at 12:00pm ET only on StockCharts TV.
-
1/30/20
Introducing "Symbol Summary"
A Full Quote Summary Page for Stocks, ETFs, Mutual Funds and Indexes, Including Technical Stats, Fundamentals, Earnings, Dividends, Corporate Info and More
We are thrilled to bring you a powerful new way to analyze stocks, funds, indexes and more on StockCharts with the introduction of our Symbol Summary page. Designed to complement the "Full Quote" option on SharpCharts, the Symbol Summary provides a complete overview for the symbols we cover on the site.
From a single page, you can see the latest price info, view a chart in multiple timeframes, browse high-level summary stats, fundamentals and popular technicals, get earnings dates and dividend info, visualize the symbol's latest SCTR info, read full company or fund descriptions, and much more. With tons to explore in this dynamic resource, this just might become your new favorite StockCharts tool.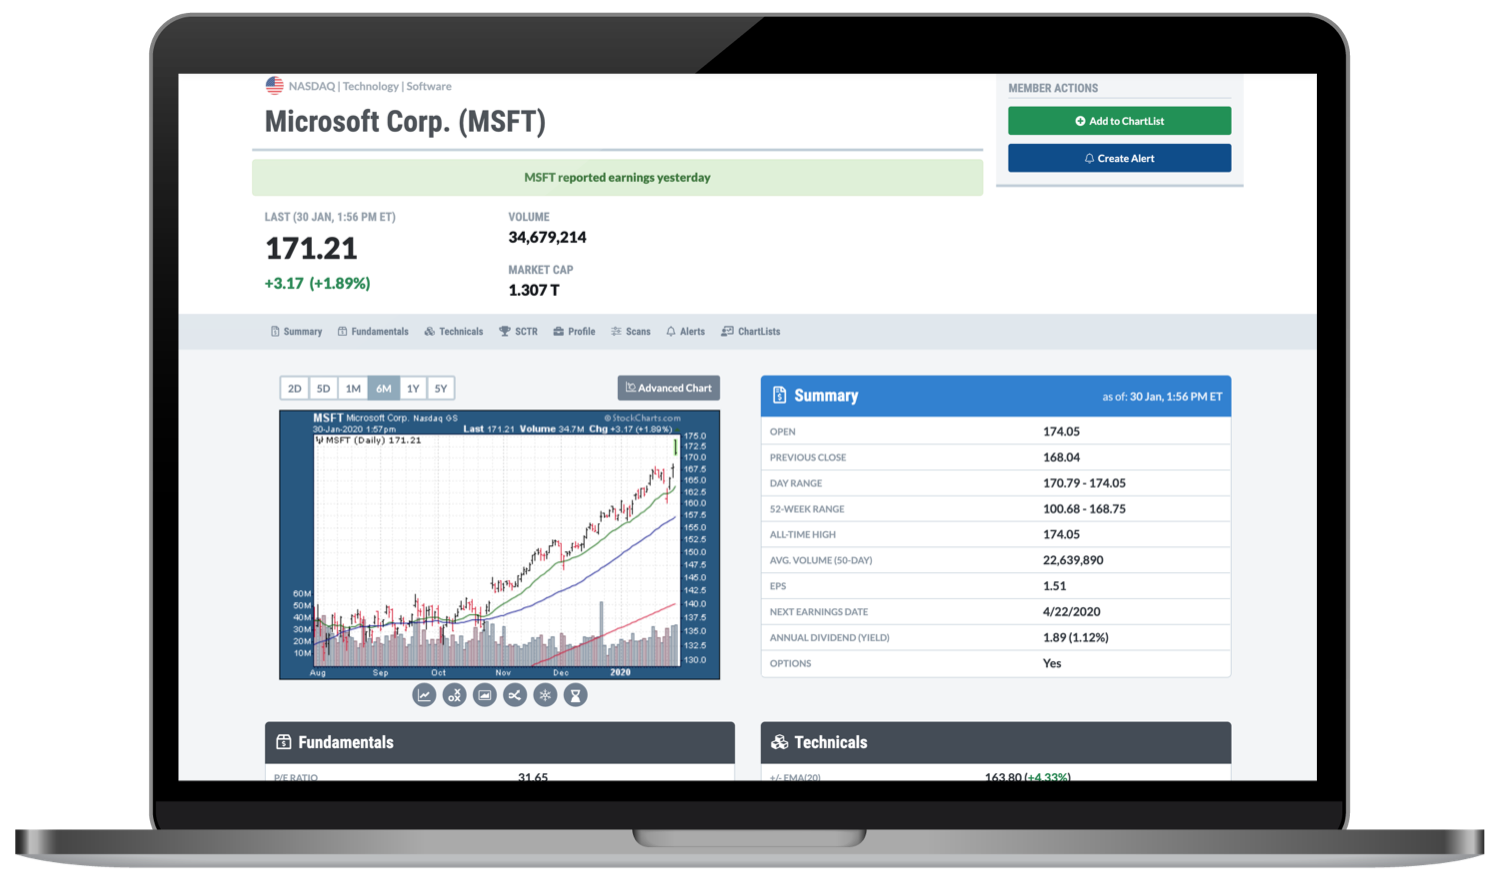
-
1/29/20
"50 Years On Wall Street" Feat. Ralph Acampora | A StockCharts TV Exclusive
In the first original documentary from StockCharts.com, Ralph Acampora, the Godfather of Technical Analysis himself, takes David Keller on a tour through the history of the stock market with a visual unlike anything you've ever seen – the side of his very own barn. Listen and watch as Ralph reflects on his five decades in the markets in this exclusive, up-close look at one of the world's great minds of market analytics.

-
1/9/20
Arthur Hill's "Next Level Charting" on StockCharts TV
Designed to help you step up your analysis process, “Next Level Charting” shows you how to combine classical charting techniques with quantitative insights. Catch new episodes from Arthur Hill LIVE, Thursdays at 12:00pm ET only on StockCharts TV.
-
12/6/19
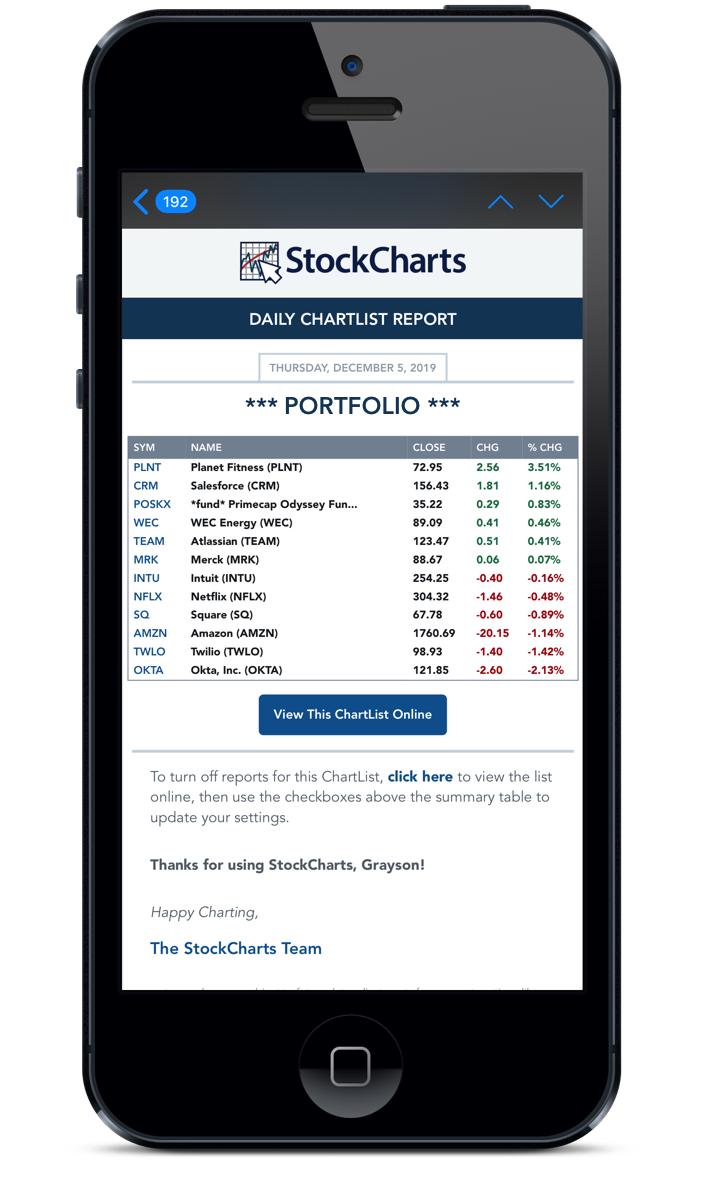
Introducing "ChartList Reports"
Daily and Weekly Performance Summaries Sent Right To Your Inbox
To further enhance one of our most popular members-only tools - ChartLists - we've added a powerful new tracking feature called "ChartList Reports". With the simple click of a checkbox, you can now turn on daily or weekly ChartList Reports for any of your saved lists and we'll automatically email you a performance summary for all the stocks, funds, indexes or other securities saved in that ChartList after the market closes.
-
12/1/19
David Keller's "Morning Coffee Routine" ChartPack
Follow the markets through David Keller's eyes and make his "morning coffee routine" your own with this unique ChartPack. Free to install, you can add this expertly-curated collection of ChartLists to your own StockCharts account in seconds.

-
11/8/19
Crypto Data, Now On StockCharts
24/7 Real-Time Pricing And Advanced Charting For Digital Assets
With the addition of 24/7 real-time price data for the market's most important cryptocurrencies, you can now use StockCharts to track, chart and analyze the crypto market like never before.
-
10/10/19
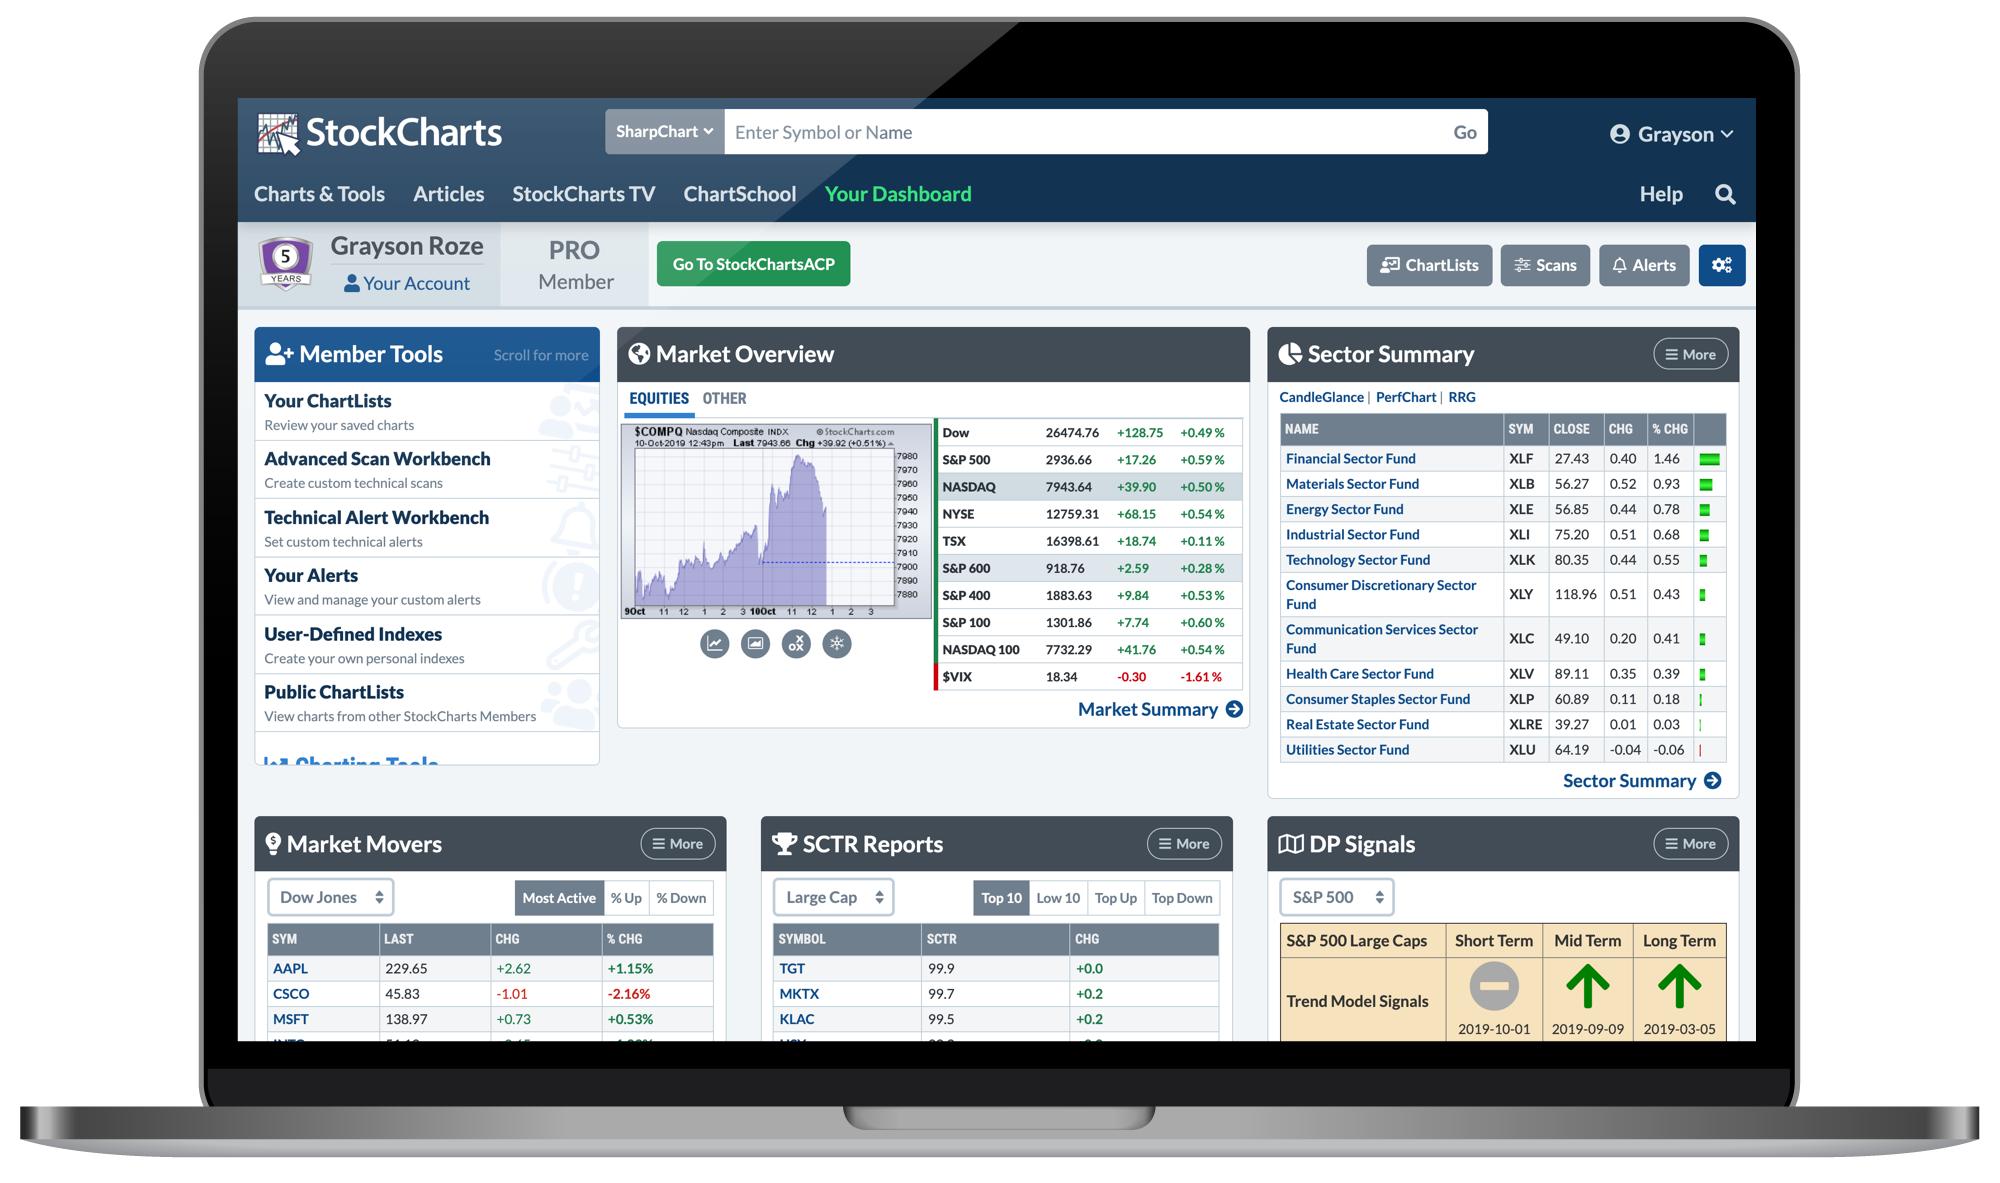
"Your Dashboard" Upgrades
More Data, Better Charts, ChartList Actions And New Content
For StockCharts Members, "Your Dashboard" has been upgraded with some major enhancements. This includes a totally revamped Market Overview panel with more data than ever before, a Sector Summary option for the data panels on Your Dashboard, the ability to add new symbols to your top ChartLists right from the dashboard, a Latest Articles panel that includes recently-published articles on StockCharts, and a StockCharts TV panel with the live player and a quick link to new episodes.
-
9/30/19
StockCharts TV "Fall Lineup"
We've kicked off the fall with the launch of six new exclusive shows from David Keller, Larry Williams, Dave Landry, Julius de Kempenaer, Tom Bowley, Chip Anderson. Hosted by some of the industry's leading technical chartists, you can count on these shows to provide helpful, actionable, insightful market commentary.

-
2/1/19
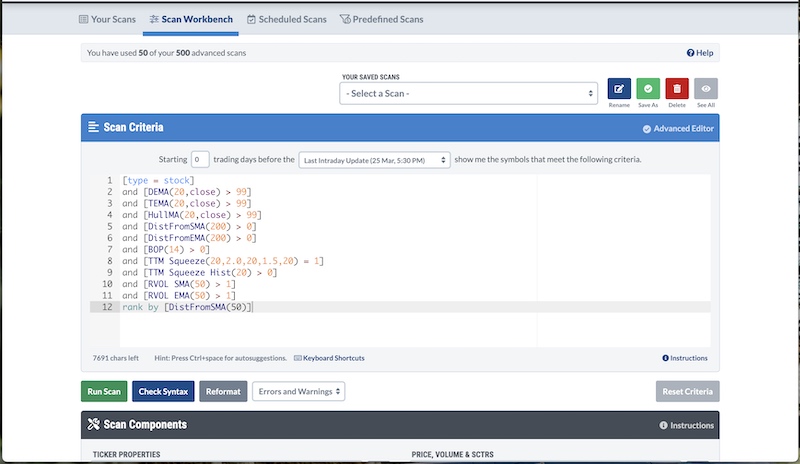
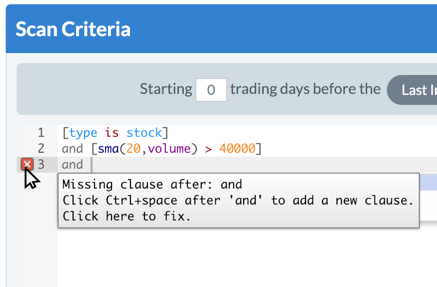
The "Advanced Scan Editor"
Create Powerful Technical Scans With Ease
As you write your custom technical scans, our new Advanced Scan Editor provides helpful tips, warnings, error messages and other guidance while you work. This addition to our scanning workbench is designed to help you take your scanning to the next level.


