Art's Charts July 26, 2024 at 07:53 AM
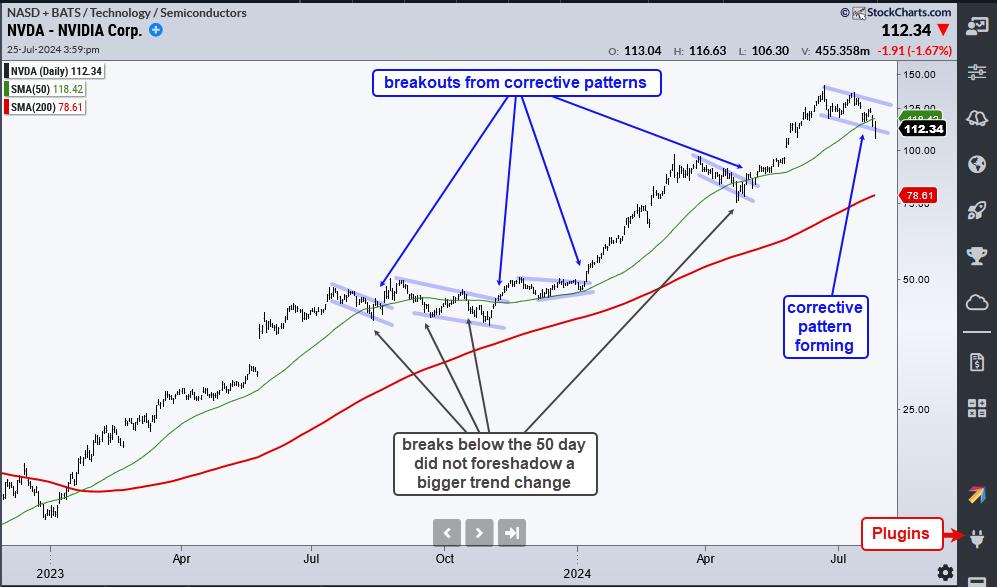
After a big run this year, Nvidia (NVDA) fell over 15% from its high and broke its 50-day simple moving average (SMA). On the face of it, a break below this "key" moving average seems like a short-term bearish signal... Read More
Art's Charts July 19, 2024 at 04:18 AM
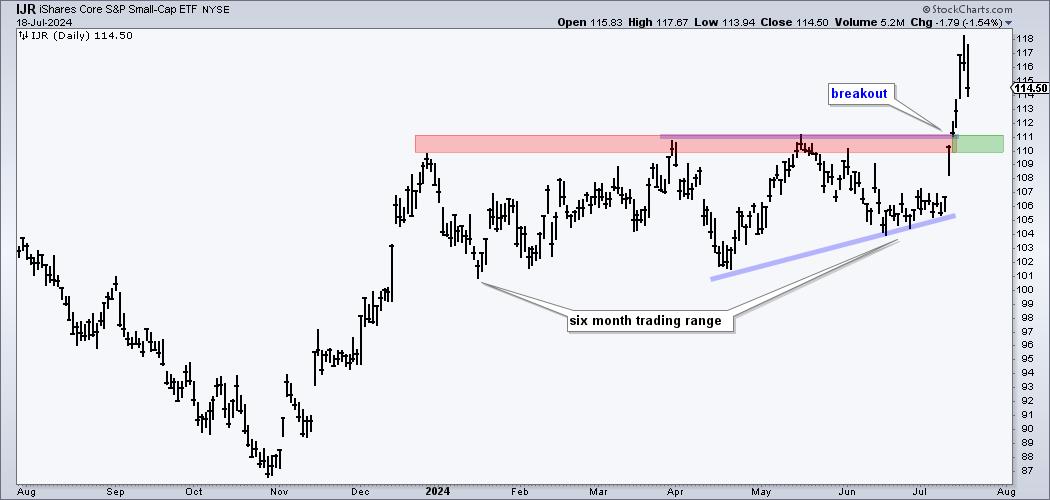
Small-caps took the lead over the last two weeks with the S&P SmallCap 600 SPDR (IJR) surging over 10% in five days and hitting a new high. IJR also broke out of a long consolidation and this breakout is bullish. There are now three possibilities going forward... Read More
Art's Charts July 15, 2024 at 10:34 AM
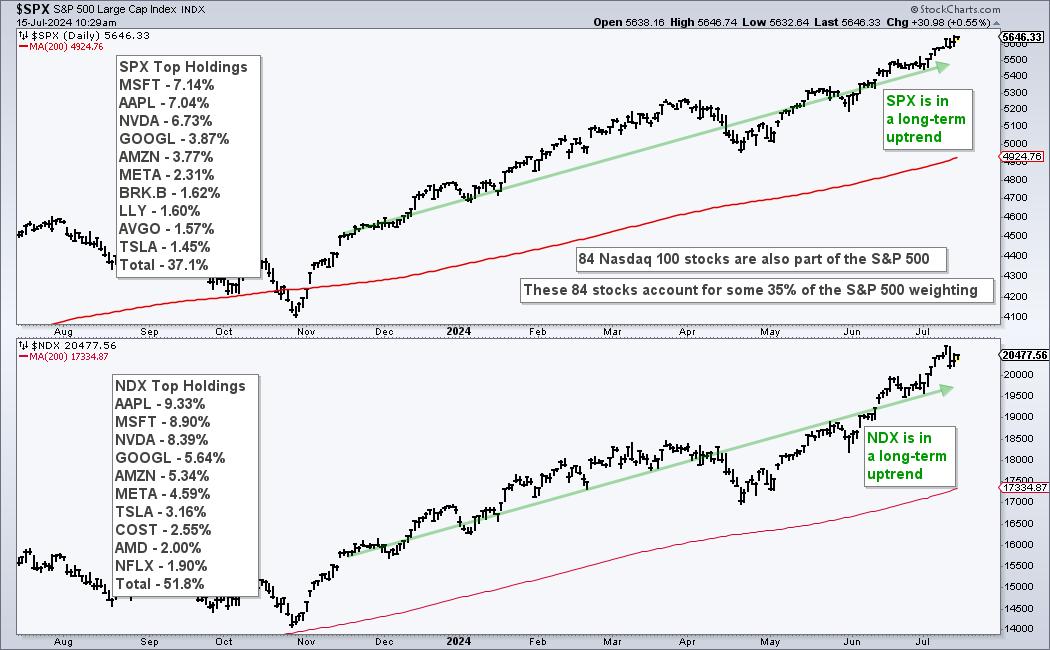
The Nasdaq 100 is a major driver in the stock market and Nasdaq 100 breadth indicators should be part of our broad market analysis routine. 84 Nasdaq 100 stocks (16.8%) are also in the S&P 500 and their weighting accounts for over 30% of the S&P 500... Read More