
At EarningsBeats.com, we track the best U.S. companies in a "Strong Earnings ChartList." In order for a company to be included in our ChartList, they must do 3 things:
(1) Beat quarterly revenue estimates
(2) Beat quarterly EPS estimates
(3) Look solid technically
If a company doesn't meet those 3 requirements, we ignore them. Plenty of energy and materials stocks have met requirements 1 and 2 over the past 90 days, but the sectors have been shunned by Wall Street due to a strengthening U.S. Dollar Index and many of these companies are in downtrends, or at least relative downtrends (vs. the S&P 500). Therefore, they do not meet requirement 3 above. We currently have 273 companies on our Strong Earnings ChartList, broken down by sector as follows:
Aggressive sectors:
Technology - 83
Industrials - 46
Consumer Discretionary - 45
Financials - 26
Communication Services - 17
Total aggressive sector stocks - 217
Defensive sectors:
Healthcare - 26
Consumer Staples - 12
Real Estate - 12
Utilities - 1
Total defensive sector stocks - 51
Other sectors:
Energy - 4
Materials - 1
Total other sectors - 5
A couple things really stand out to me. Firstly, the ratio of aggressive sector stocks to defensive sector stocks is more than 4 to 1, the highest ratio we've ever had at EarningsBeats.com. If more aggressive stocks are beating earnings estimates and looking good technically than defensive stocks, it's a signal that Wall Street believes the stock market will move higher. It's not just analysts talking bullishness - it's analysts putting their collective money where their mouths are!
We see a similar aggressive-to-defensive ratio when we compare consumer discretionary stocks (XLY) against consumer staples stocks (XLP). It's nearly 4 to 1! The following chart is how the consumer discretionary stocks (aggressive) have been performing vs. their consumer staples counterparts (defensive) on a technical basis:
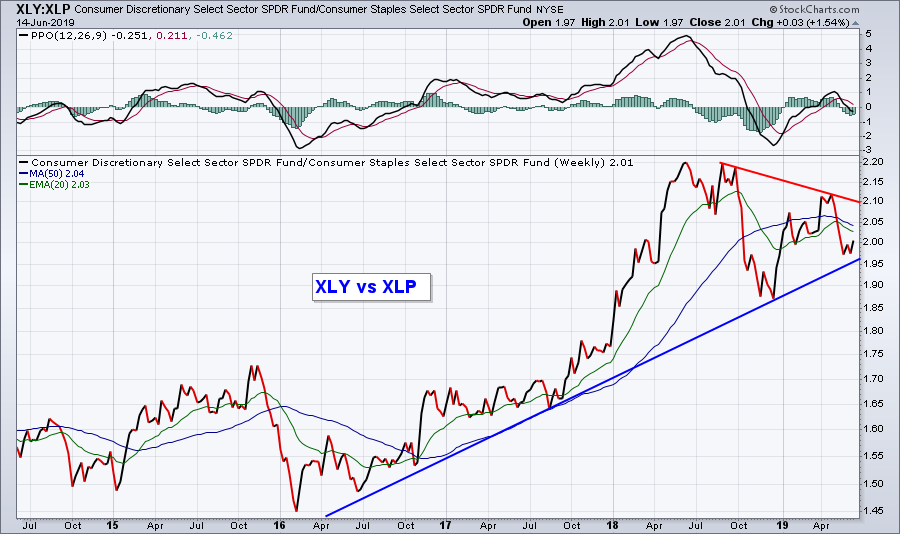 This further confirms the rotation to aggressive areas of the market vs. defensive areas, as the overall uptrend is clearly higher in spite of the consolidation over the past year or so.
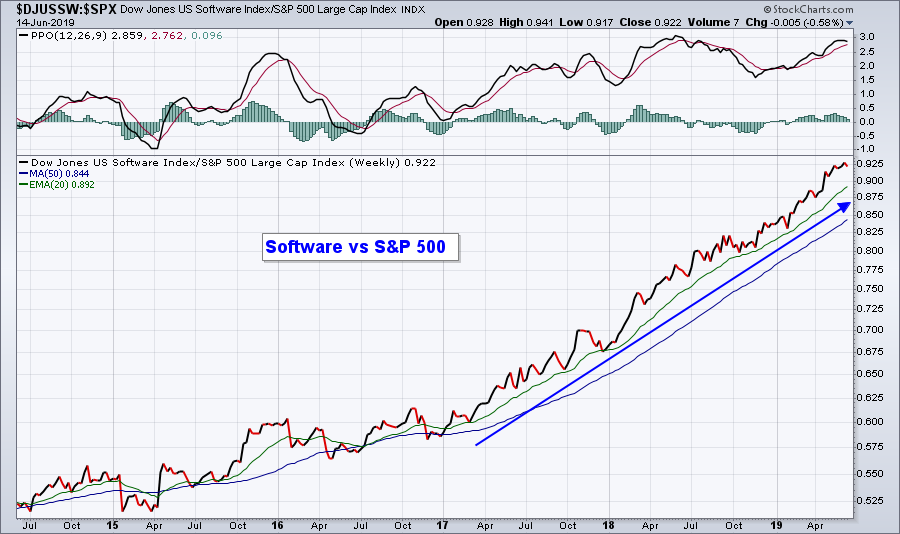
Here's a second impressive stat from this ChartList. The software industry is represented on our ChartList by 42 companies. 42!!! That's almost as many stocks as the entire list of defensive sectors, which totaled 51. And when you look at a relative chart of software vs. the S&P 500, it's no wonder why!
 Wall Street commits to aggressive stocks in this fashion for only one reason: they believe earnings will accelerate later this year and they want to own the stocks that will benefit the most. You should want to own those stocks as well.
Would you like to see the 273 stocks that made the cut at EarningsBeats.com? If you sign up for our free 3-times-a-week newsletter, which will feature articles highlighting earnings and relative strength, we'll also provide you a link where you can access all 273 Strong Earnings ChartList stocks, annotated with key price support levels!!! CLICK HERE to gain access and to get your FREE subscription started!
At your service,
John Hopkins
EarningsBeats.com