ChartWatchers March 27, 2025 at 08:06 AM

Wednesday's stock market price action revealed a caution sign, and with it, any hope that rose from Monday's price action just got buried. The Tech sector sold off, with the Nasdaq Composite ($COMPQ) falling over 2%. The chart of $COMPQ indicated hesitation... Read More
ChartWatchers March 26, 2025 at 04:30 PM

Gold at $3,100 and silver at $50? That might've sounded wild a year or two ago, but it's now the upper trajectory some analysts are eyeing... Read More
ChartWatchers March 25, 2025 at 07:08 PM

The stronger-than-expected Services PMI reported on Monday injected optimism into the stock market. There was also some relief as news hit that the April 2 implementation of tariffs may be scaled back... Read More
ChartWatchers March 21, 2025 at 07:46 PM

If one word could characterize this week's stock market price action, it would be "sideways." At least it's better than trending lower... Read More
ChartWatchers March 20, 2025 at 07:20 PM

You already know about diversification. You've set your investment goals, picked a benchmark, and decided on the weighting of your allocations. Now, it's come down to selecting the assets—stocks or ETFs—to build your portfolio... Read More
ChartWatchers March 19, 2025 at 08:00 AM

Tuesday's stock market action marked a reversal in investor sentiment, with the broader indexes closing lower. The S&P 500 ($SPX), Nasdaq Composite ($COMPQ), and Dow Jones Industrial Average ($INDU) are still below their 200-day simple moving average (SMA)... Read More
ChartWatchers March 18, 2025 at 08:30 AM

Last week, tariff talks, recession fears, and waning consumer sentiment sent stocks lower. This week, the narrative may have shifted, as investors prepare for a macro-filled week and NVIDIA's annual GTC developers' conference... Read More
ChartWatchers March 14, 2025 at 10:25 PM

In this exclusive video, legendary trader Larry Williams breaks down why the stock market is primed for a rally, using technical analysis, fundamental signals, and seasonal trends... Read More
ChartWatchers March 14, 2025 at 01:50 PM

No one can predict how tariffs will play out or how severe their effects will be on everything from consumer goods to the broader economy. But investors have gotten a taste of the market chaos such uncertainties can bring... Read More
ChartWatchers March 12, 2025 at 05:03 PM

Problem: How can you tell if an index is about to reverse—even before the price reflects it? Answer: Look at what's happening internally within the index—in other words, analyze market breadth, also called "participation... Read More
ChartWatchers March 11, 2025 at 06:38 PM

The S&P 500 ($SPX), Nasdaq Composite ($COMPQ), and DJIA ($INDU) are trading below their 200-day simple moving averages (SMAs). It doesn't paint an optimistic picture, but the reality is that the stock market's price action is more unpredictable than usual... Read More
ChartWatchers March 10, 2025 at 05:48 PM

"The trend is your friend, until the end when it bends... Read More
ChartWatchers March 06, 2025 at 05:44 PM

If the essence of stock investing is to buy low and sell high, then buying not just low, but at a steep discount, optimizes your potential returns. This strategy is what's popularly called "buying the dip... Read More
ChartWatchers March 06, 2025 at 01:51 PM
Follow along with this must-see video, where Tony will show you how to use the tools in the OptionsPlay Add-on to help find winning trades with just a few clicks... Read More
ChartWatchers March 05, 2025 at 06:53 PM

Tariffs have thrown the stock market into dizzying moves, moving up and/or down based on whatever news headlines circulate. The broader stock market indexes have all declined, although they are holding on to their 200-day simple moving average (SMA)... Read More
ChartWatchers March 04, 2025 at 06:04 PM
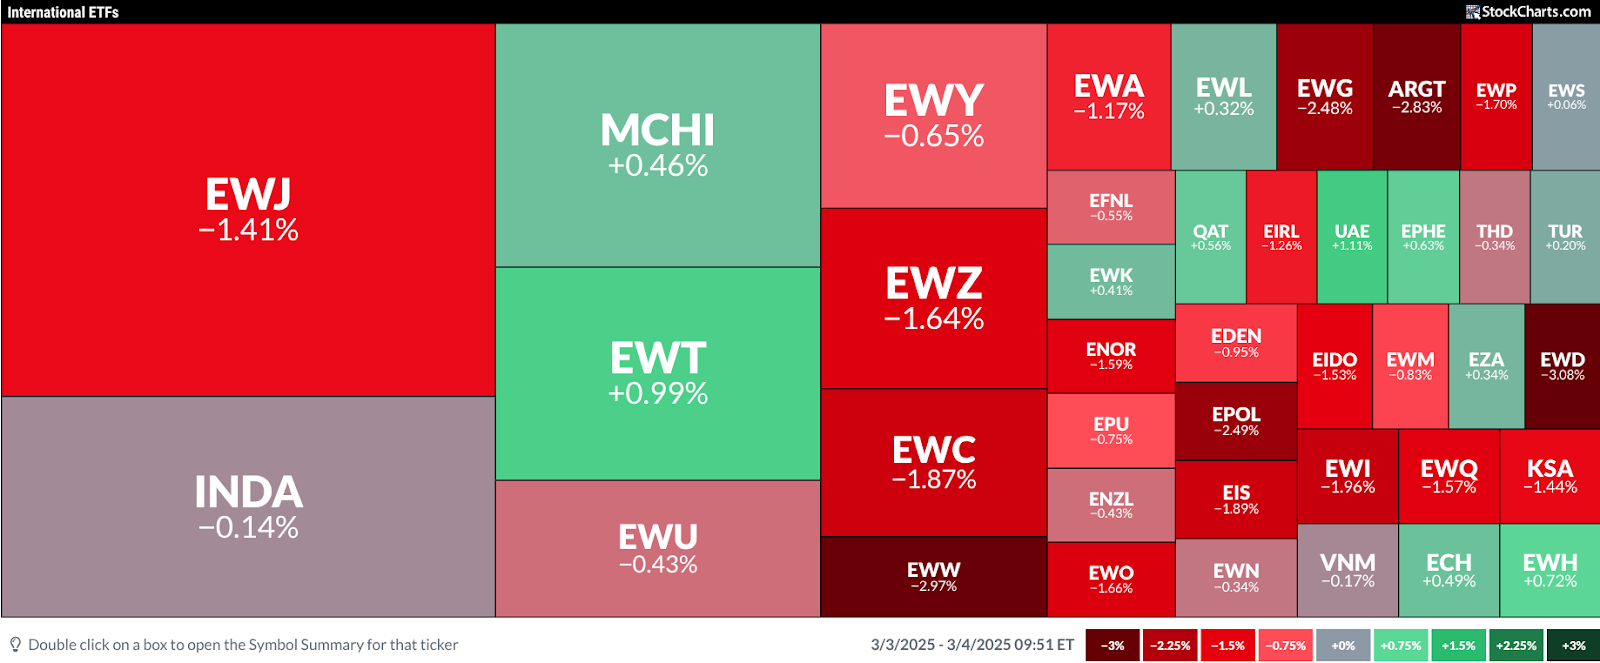
With US tariffs on Canada, Mexico, and China having taken effect at midnight on Tuesday, US indexes extended their Monday losses, deepening concerns over the escalating trade war... Read More