 Most market analysts will tell you that market corrections are times when the market takes a rest and declines for more than just a few days. Ten percent has also been bandied about for years as to what makes a good correction, or at least what generally qualifies as a correction in the market. Most will also state that these corrections; while painful and downright scary; are a necessary event for a healthy uptrend to resume. This argument is not unlike the one about recessions being beneficial for the economy. Free markets require periods to realign from their excesses. Good corrections in the market are actually healthy, just like shallow recessions in the economy. A closer to home analogy might be how medicine helps us when we are sick. It is when they get beyond that stage that people pay a dear price for complacency. More on this later!
Once a correction begins, my question to all those who have immediately identified it as such, is: how do you know if it is just going to be a correction? The answers are wide ranging and usually more steeped in hunches and hope than anything. Then I ask it a little differently, how do you know it is not going to develop into a full-fledged bear market? Their answers are usually even less well formulated than their first answer. Table A shows all of the drawdowns in the S&P 500 Index since 12/30/1927 up to 12/31/2014. The Drawdown Range shows the bears (-100% to -20%), the Corrections (-15% to -19.99% and -10% to -14.99%), the Pullbacks (-5% to -9.99%), and the daily volatility (-0.01 to -4.99%). The last column “Percentage of time spent in Drawdown” shows that bear markets accounted for over 65% of the total time, daily volatility was 13.4% of the time, and the remainder were corrections and pullbacks. Bottom line is that the market (S&P 500) was in a state of Drawdown almost 95% of the time. See my previous article Drawdowns and New Highs for a similar table using the Dow Industrials.
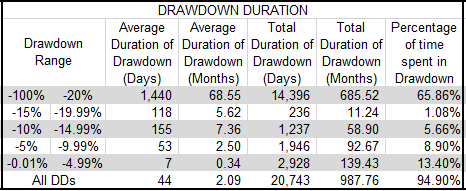
Table A
Here’s a question for you. During the late fall of 2007 at what point did you know it was not going to turn into a correction or worse? If you weren’t sure, at what point would you be concerned about losing 15%, 20%, or 50% or more of your wealth? I would guess there are some circumstances where it isn’t as important for some as it is for others. However, for most of us (especially when older), losing money stinks. I prefer to follow rules that will not let me ride out drops in the market. I do not know if a few down days will turn into a correction and I am not going to find out by riding it down with my money. If my model improves and gives me the green light I will re-enter the market. If I re-enter at a price above where we were, then it is known as a whipsaw.
Whipsaws
A whipsaw is when you exit the market, the market does a quick reversal, and by the time you re-enter, the entire event results in a small loss. Whipsaws are an inevitable consequence of not adapting a buy and hold mentality and becoming a victim of a bear market, let alone a correction or a pullback. It is just the cost of doing business, a risk adverse business if you will. I know this fact to be true, watching the market plummet from the sidelines is not a bad thing, emotionally or financially. I do not know if a few down days are going to turn into a correction or if a correction is going to turn into a bear market. No one does, but at least we are prepared for the worst outcome. And that is what I do, I try to participate in the good times and avoid the bad times. Am I always right? Heck no, but I also know that there is only one thing worse than being wrong, and that is staying wrong. Chart A shows a typical whipsaw scenario where you got stopped out and then bought back in at a higher price. Chart B shows the other type of whipsaw where you got invested early in an uptrend and then the market reversed and your stops took you out. I know you all use stops, right?
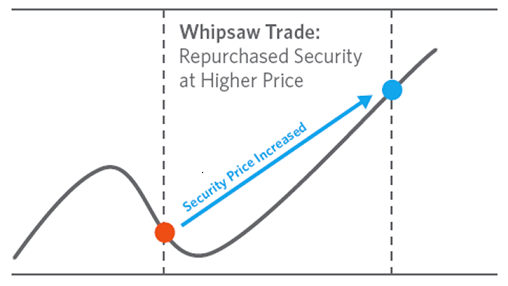

Chart A
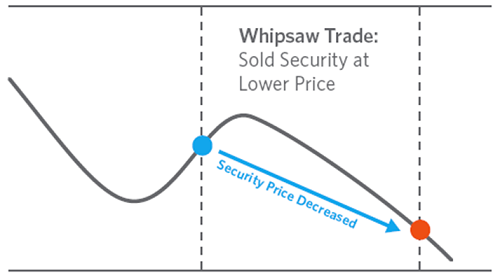

Chart B
I’ve had the pleasure to meet and talk with Ed Seykota on a couple of occasions, one of the most successful trend followers ever. He has written and performed a tune called the Whipsaw Song which he sings while playing his banjo. Click Here to watch and listen to it. While the tune is catchy, the message is critical to understanding trend following – pay attention to the lyrics. One of the funniest things he said was if you wanted to avoid taking whipsaw losses – quit trading.
I once took a poll when I was working of the other employees in the office. Which emotion is more enjoyable: being fully invested when the market rises, or being fully defensive (cash) when the market declines. The results were fairly close and not outside of expectations. Enjoyable emotions usually are the result of your money doing well. Even for employees of an investment advisor, who strives to avoid the downside risk, the more enjoyable emotion was to participate in the upside of the market. I also asked which emotion was the most horrid: being fully invested when the market declines or being fully defensive when the market rises. Again, the results were not really surprising as when the market is down while invested was the worse. That is the one where your money is involved, and like I said, losing money just stinks.
Trade with confidence in your process,
Greg Morris


