 All books on candlesticks offer detailed descriptions of the relationships among the open, high, low, and close. They also deal with the concepts of trend determination which I did in the previous article; while this article focuses on pattern identification. In addition, a method of determining long days, short days, doji days, etc., is needed, including the relationship between the body and the shadows. The latter is essential for proper identification of patterns such as the Hanging Man and Hammer. The following will show the multitude of methods used to accomplish these and similar tasks. I wish to note that all of the Japanese books on candlesticks do not delve deeply into this subject; most just show a drawing of how it should look. However, when you are programming a computer to identify them you must accept some flexibility or no patterns would ever appear.
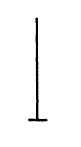
For example, what is a long day? Long compared to what? What is a short day? I hope you begin to see the problem. Once you see a candlestick chart with lots of days, it is easy to pick out the long and short days. But then again, maybe the small section of time that you are viewing were really only short days and when you explore more data you find that what you thought was a long day wasn’t. And remember, the Japanese always focused on the body (the difference between the Open and the Close), in only a few instances did the High and Low come into play.
Long Days
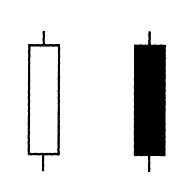 Any of three different methods below are available, where each or any combination of the three can be used to determine long days. The term minimum in these formulas refers to the minimum acceptable percentage for a long day. Any day whose body is greater than the minimum value will be considered a long day.
1. Long Body / Price – Minimum (1 – 100%)
This method will relate the day in question with the actual value of the price of a stock or commodity. If the value is set at 5% and the price is at 100 then a long day will be any whose range from open to close is 5 points or more. This method does not use any past data to determine a long day.
2. Long Body / High to Low Range – Minimum (0 to 100%)
This method uses the body length in relation to the high-low range for a given day under this technique. If a candle does not have long shadows, it is considered a long day. Used by itself, this is not the best method, but used in conjunction with one of the other methods it is good. This method will eliminate days that might appear more as spinning tops when viewed with the surrounding data.
3. Long Body / Average Body of Last X Days – Minimum (0 to 100%)
An average of the body sizes of the last X days is used to determine a long body. The value for X should be anywhere between 5 and 10 days. If the percentage was set to 130, then a long day would be identified as if it was 30% greater than this average. This method is good because it falls in line with the general concept of candlesticks and their use for short term analysis.
Short Days
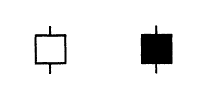 The exact same concept used for determining long days is used for short days with one exception; instead of minimum percentages, maximum percentages are used in these formulas.
Small Body / Large Body Relationship
The Engulfing Pattern and Harami use both a large body and a small body for their patterns. This large body and small body concept is not the same as the long and short body concept discussed previously. Here the large and small bodies refer only to their relationship with one another. One must decide how much engulfing constitutes an Engulfing Pattern. If the concept is held to the letter of the law, then only one tick or minimum price movement is required to cause an engulfment. Can this be at just one end of the body when the prices are equal at the other end? In other words, can the open-to-close range be different for only one tick? The following formula will let you control the situation:
Small Body / Large Body – Maximum (0 – 100%)
The inverse of this value can be used for the Harami. It is recommended to use values that represent what could easily be identified if the determination were made visually. If a small body is engulfed by a large body by 70%, it means that the small body cannot exceed 70% of the size of the large body. Said another way, the large body is approximately 30% larger than the small body.
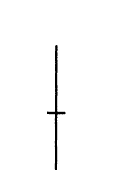
Umbrella Days
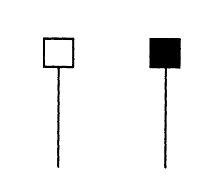 Remember, an umbrella day occurs when the body is at the upper end of the day’s range and the lower shadow is considerably longer than the body. One must also take into consideration the length of the upper shadow if one exists. The body and lower shadow relationship is defined by as a percentage of the body length to loser shadow length.
Umbrella Body / Lower Shadow (0 to 100%)
If this value is set to 50, then the body cannot exceed 50% of the size of the lower shadow. In this example, the lower shadow would be at least twice the length of the body. The upper shadow on an umbrella day can be handled in a similar fashion, such as:
Umbrella Upper Shadow / High to Low Range (0 to 100%)
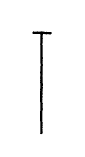
The upper shadow is related to the entire day’s range. A value of 10% means that the upper shadow is only 10% (or less) of the high-low range. These variables will help identify the Hanging Man and Hammer candle patterns. Patterns such as the Shooting Star and Inverted Hammer use the inverse of these settings.
Doji Days

Doji occurs when the open and close prices are equal. This is an exceptionally restrictive rule for most types of data and should have some leeway when identifying candle patterns. The formula lets you set a percentage difference between the two prices that will be acceptable.
Doji Body / High to Low Range – Maximum (0 to 100%)
This value is a percentage maximum of the prices relative to the range of prices on the Doji day. A value in the neighborhood of 1 to 3% seems to work quite well.
Equal Values
Equal values occur when prices are required to be equal. This is used for patterns like Meeting Lines and Separating Lines. Meeting Lines require that the closing price of each day be equal while Separating Lines require the opening prices to be equal. The same concept used in determining a Doji day can be used here as well. There are a few instances when setting the parameters to the literal definition will restrict, rather than enhance, the pattern concept.
While I know most of you will never get into writing code for pattern identification, my purpose was to show that you need to be very careful using software that does this if the process isn’t available. There were a huge number of decisions that had to be made when I did all this 25+ years ago, the good news it seemed to work then and still works.
Dance with the Trend,
Greg Morris


