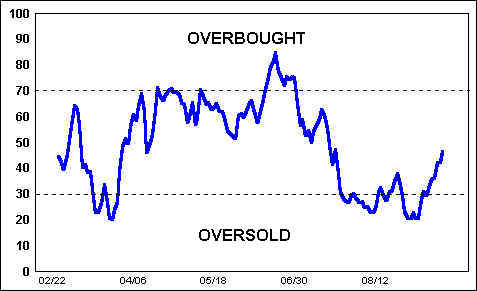
 Overbought / Oversold – These terms have got to be the most over-used terms when talking about the markets. Overbought refers to the time in which the prices have risen to a level that seems as if they cannot go any higher. Oversold is the opposite, prices have dropped to a point it seems as they cannot go any lower. While this sounds simple enough, the term is usually based upon someone’s personal observation of price levels and not on sound analysis.
If I had to pick a concept in technical analysis that is so misunderstood, abused, and near worthless, it would be the concept of overbought and oversold. Let me try to explain. There are many types of conditions in the market where the pundits start hollering about overbought or oversold conditions. The condition can even be on a price chart after the price has moved so far in one direction that the expert thinks it has gone too far and must correct. The other misused of these terms is on technical indicators. There are two types of technical indicators: bounded, such as Stochastics and RSI, and unbounded, such as OBV, AD Line, Momentum, etc.
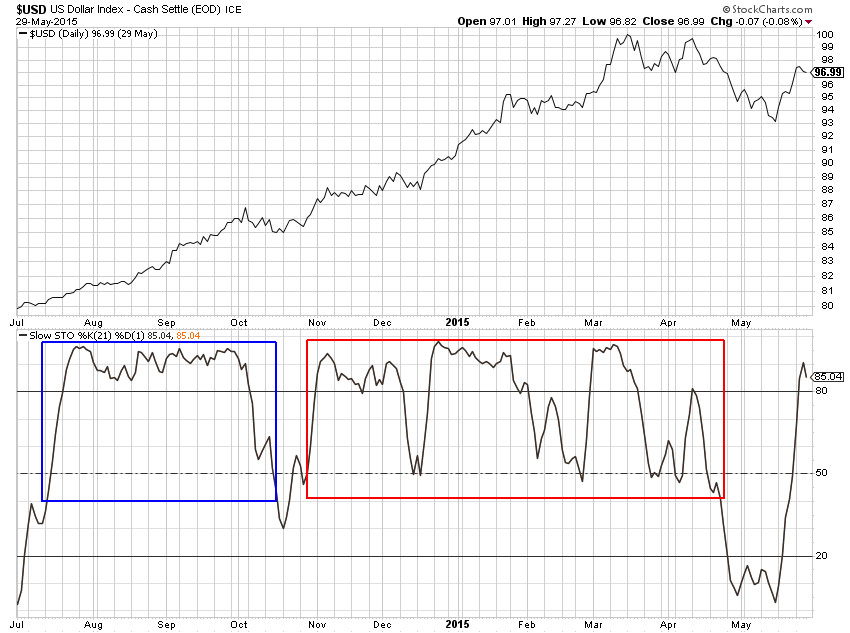
A bounded indicator such as a 14-day Stochastics %K, because of the calculation will remain between 0 and 100; it was mathematically designed to do that, somewhat like normalization. A generally accepted level for overbought is when it is over 80 and oversold is when it is below 20. So let’s work through an example. Chart A shows the US Dollar Index and a 21-day Stochastics in the lower panel. The period from early July, 2014 until mid-October, 2014; Stochastics remained above 50 and also above 80 for most of that time period. If you reacted in July as if Stochastics was overbought and took action to sell, place stops, etc. you would have been wrong for almost 4 months. That’s a really long time if you stop to think about it.
If you sold when it went below 50 in mid-October, you would have missed the next 6 months of up move in the issue. The red rectangle shows more of the same. The indicator remained essentially above 50 for almost 6 months. The point I’m trying to make is that relying on nebulous terms such as overbought and oversold, even when looking at price action can be quite costly. I stopped using the terms decades ago. And to make it even worse, using them on unbounded measures such as the AD Line, Momentum, etc. can be difficult at best.
 Chart A
Some of the best arguments I have heard about the benefits from using overbought and oversold are when perfect hindsight is implemented. Sorry, you cannot trade with hindsight. However, like I always say, if it works for you, run with it.
Taking a couple of weeks off, headed to India for a speaking engagement. Stay safe.
Dance with the Trend,
Greg Morris


