 First of all, I must apologize for my lack of creativity for these article titles. The previous two “Filtering the Noise” and “Filtering the Noise II” were about moving averages and suggesting a better way to use a relationship between two moving averages, similar to the ubiquitous MACD. In this creatively named article I will attempt to explain my process for finding the shorter-term average using detrending. If you recall from the previous articles, once you have the shorter-term average, you then know the longer term one and the signal value. Instead of rewriting it, I’ll just pull if from an article, I wrote over 30 years ago. See the end of this article for more information on Stocks and Commodities magazine – a must read.
Determining the dominant short-term cycle is necessary to obtain the smoothing parameters for this indicator. There are many good books available on cycles. One that I have found to be the most useful is The Profit Magic of Stock Transaction Timing, by J.M. Hurst (Copyright 1970). Despite the horrendous title, the book is exceptionally logical in its explanation of market cycles and how to identify them.
One method of determining cycles is to detrend the data. This is a simple concept involving the price data and a moving average. The moving average length is based upon the trend you want to follow. For short-term, a moving average of 25-35 days works quite well. Basically, you subtract the moving average from the price and plot the results. This is as if you had grasped the moving average line at both ends and pulled it tight so it looked like a straight line with the price data remaining in its same relative position to the moving average.
Of course, you can always just count the days between lows from any daily chart or use sophisticated maximum entropy or Fourier analysis. Detrending just makes those lows stand out a little better.
For this indicator, you need to identify the short-term cycle for the market you are analyzing. Detrending the data as mentioned earlier will assist you in identifying market lows and finding the dominant short-term cycle. Once the cycle has been identified, select an exponential average equal to one half of the short-term cycle. For the Dow Jones Industrial Average, the short-term cycle is 14 to 15 days. Therefore, you should use seven days for your exponential average. Most software programs allow you to work with periods instead of smoothing constants when dealing with exponential averages. Periods are somewhat easier to grasp than smoothing constants. The reason behind using an average equal to one half of the short-term cycle is to maximize the price movement without smoothing the dominant cycle. (A)
(A) From "Trend of the Trend" by Greg Morris. Technical Analysis of STOCKS & COMMODITIES magazine, Vol. 5, No. 2 (Feb 1987). Copyright © Technical Analysis, Inc. Used with permission.
You can detrend using StockCharts.com by selecting MACD and setting the short average to 1 (price) and the second to a longer value, say 21 and it will display a detrend of price and its 21-day exponential average. Chart A shows an example of this using the MACD with 1,21 for the parameters. Looks like about a two-month cycle which would result in the first average being 21 (one month), the second one being 21 x 6= 126, and the signal at 3 x 21=63. The bottom plot is the MACD with those parameters and the black histogram from the signal line. I did not spend much time trying to find the near-perfect example, I only wanted to explain the process. My days of research are over.
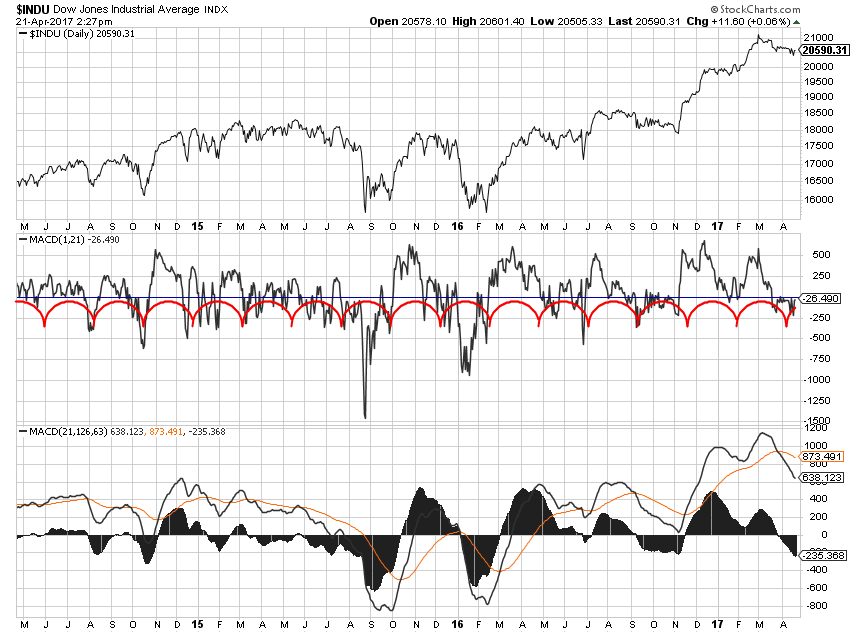 Chart A
If you are not familiar with the magazine, Stocks and Commodities, you should take a look. I have read and own every issue from their beginning in 1982. It is packed full of technical analysis ideas from traders and technical analysts from all over the world. I cannot recall for sure, but I think I wrote my first article for them in 1985 called “Facelift for an Old Favorite,” where I discussed various other ways to use Wilder’s RSI.
Dance with the Trend,
Greg Morris


