 In my first article of this series I outlined the concepts that would be discussed in this series. See HERE. In this article we need to discuss some of the building blocks that will be used and how to interpret them.
Description of Binary and Analog Measures
I actually prefer to call them digital measures because they can yield more than two signals. Binary means that it only gives two signals; it is either on or off similar to a simple digital signal. Hence, going forward we will call them digital measures as I have a technique of using multiple digital signals that can build on each other. An example will be shown in Chart E. Note: I have edited the outline in the previous article to reflect this.
Most technical indicators that we use are displayed in an analog format. However, when using an analog indicator that has signals associated with it, a digital version of the signals cleans up the chart. First of all, some definitions from dictionary.com.
Analog - Adjective measuring or representing data by means of one or more physical properties that can express any value along a continuous scale. For example, the position of the hands of a clock is an analog representation of time.
Digital - displaying a readout in numerical digits rather than by a pointer or hands on a dial; involving or using numerical digits expressed in a scale of notation, usually in the binary system, to represent discretely all variables occurring in a problem.
Chart A below is an example of an analog indicator. Let’s say this is an indicator used to identify medium term trends and when it is above the blue line it means the trend is up and when it is below the blue line the trend is not up.
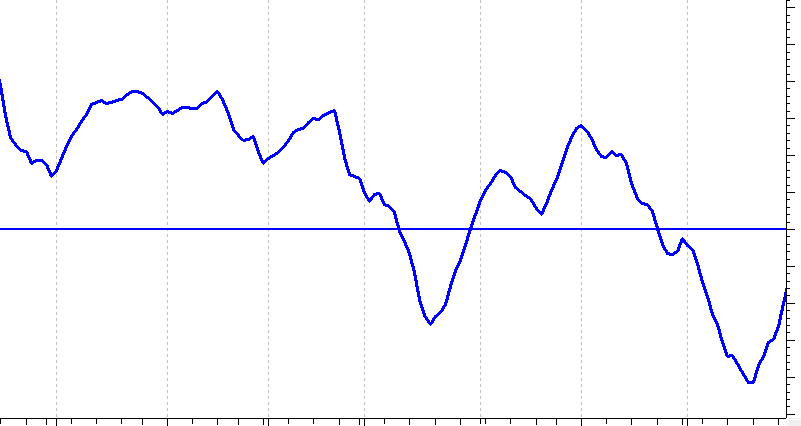 Chart A
Chart B shows the indicator in Chart A with the digital signal overlaid. The digital signal is now simplified with the on / off red line (rectified wave). You can see that when the blue indicator goes above the horizontal line the red digital signal is up and when the blue indicator goes below the horizontal line the red digital is below. One could then actually remove the blue indicator and the blue horizontal line and just show the red digital line and no information would be lost. One might argue that the proximity of the blue line to its signal line (blue horizontal) is important to know, but I disagree as one should not anticipate signals if trading with real money.
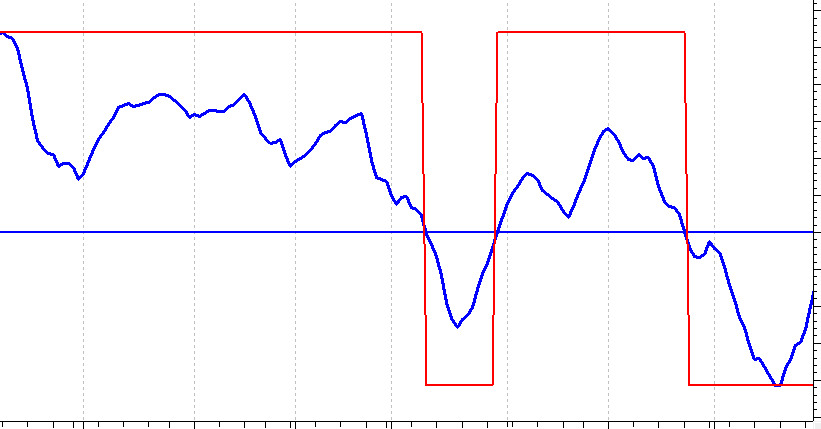 Chart B
Taking this further, one could then overlay the red digital line on a trading vehicle, say a stock or ETF. Chart C does just that. The stock is shown in candlesticks with the digital signal line overlaid. The analog indicator (blue) is shown below. You can see that the blue line and the red line are essentially giving the same information.
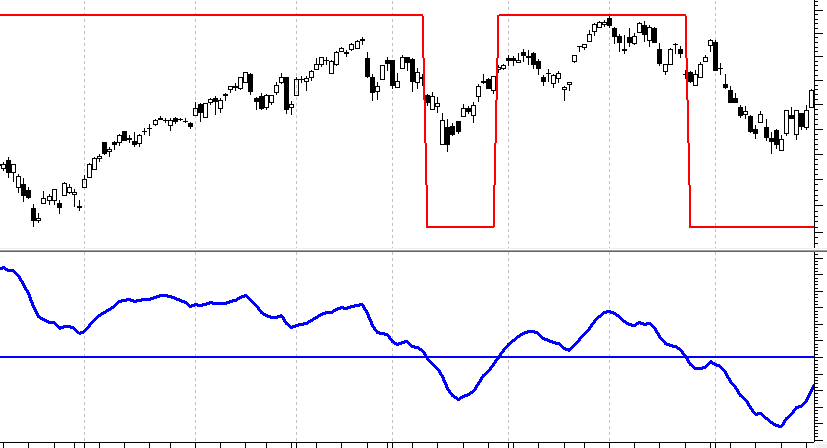 Chart C
OK, let’s go one step further. Chart D shows the stock plot along with the digital signal line from the analog indicator. I have totally removed the analog indicator from the chart. If you are using a basket of indicators, then this is a great way to show them by displaying only their signals and removing the noise of the analog indicator.
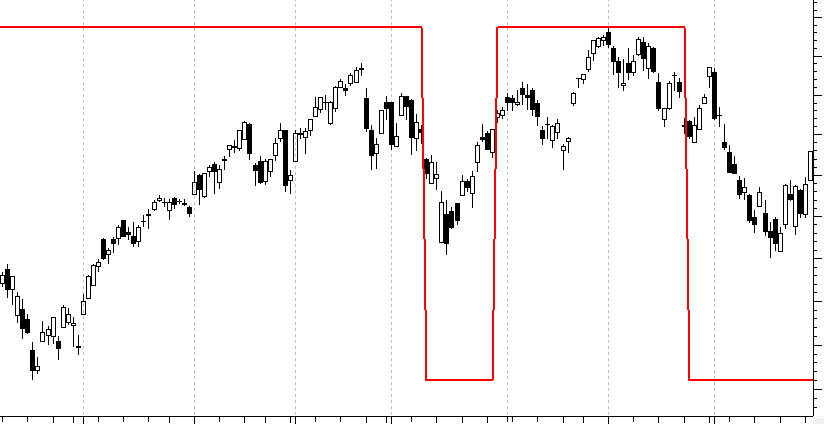 Chart D
We can expand on the digital concept by generating multiple signals using a basket of indicators, or as I prefer to call it; the weight of the evidence. Chart E is an example of a digital indicator generated from 9 technical indicators. As the technical indicators turn on it adds to the binary and as they turn off it is removed from the binary. Each little step in the black line is an indicator turning on when the line goes up and turning off when the line goes down. The amount of the move is based upon the weight put on each indicator. Hence, one digital line can give you all the information from any number of analog or digital indicators.
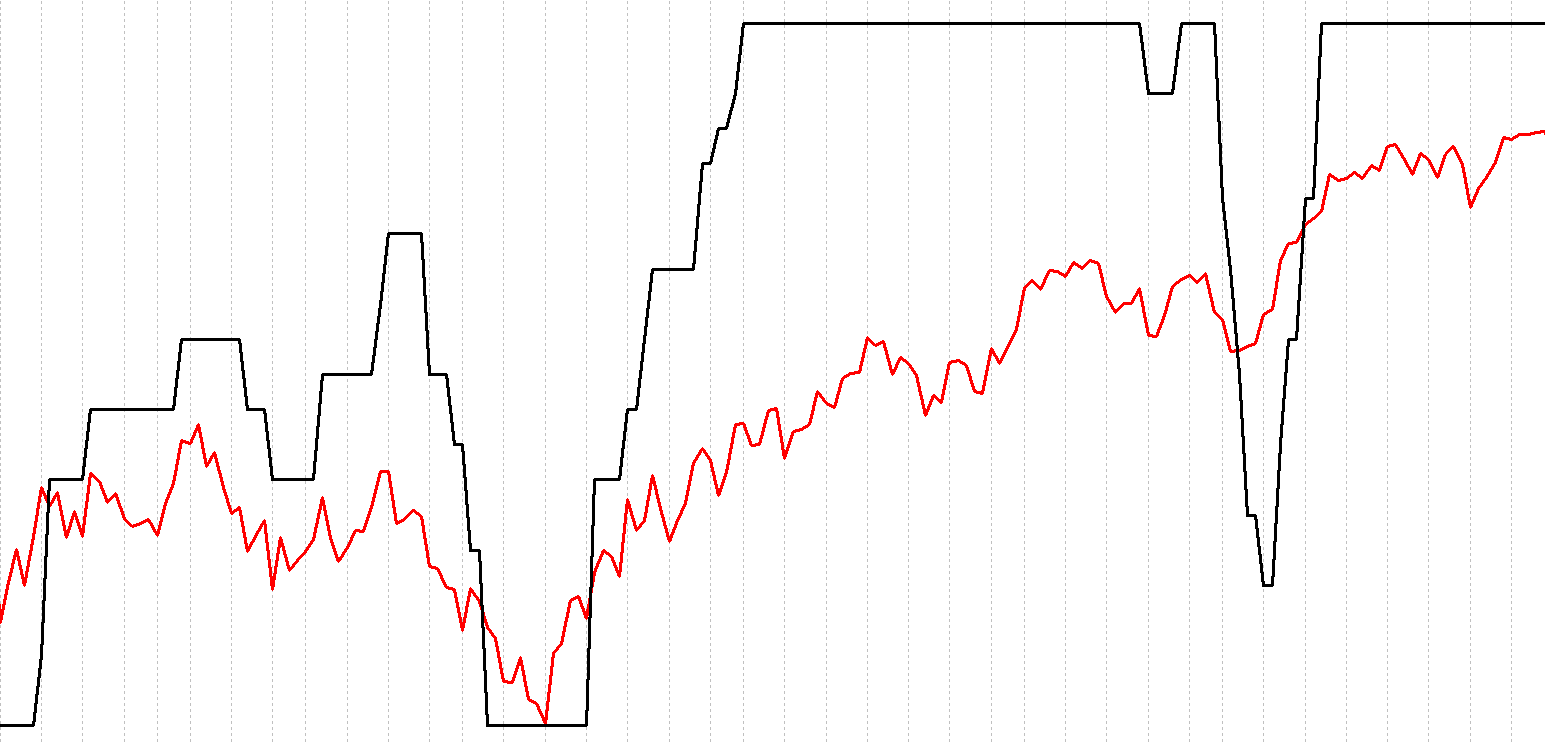 Chart E
Don’t panic. We are just covering some basics in these first few articles on building a rules-based trend following indicator.
Dance with the Trend,
Greg Morris


