 Since there are many new readers, I thought an overview on trend following might be appropriate. As I have stated often, I use a market analysis methodology called trend following. Sometimes it should be called trend continuation. Why? My trend analysis works on the thoroughly researched concept that once a trend is identified, it has a reasonable probability to continue. I know that is the case because most of the time markets are trending markets and I see no reason to adopt a different strategy during a period of mean reverting, such as we have experienced recently. Besides, if Newton was in agreement with his First Law of Motion, how could I be wrong? An object at rest stays at rest and an object in motion stays in motion with the same speed and in the same direction unless acted upon by an unbalanced force. Mean reverting measures are those that oscillate between predetermined parameters, often the selection of those parameters is the problem. Mean reversion strategies are clearly superior during these volatile times but the implementation of a mean reverting process requires a level of guessing that I refuse to do.
In technical analysis there are many mean reverting measures that could be used. They are the ones where you frequently hear the terms overbought and oversold. Overbought means the measurement shows that prices have moved upward to a limit that is predefined. Oversold means the opposite, prices have moved down to a predetermined level. The problem with that type of indicator or measurement is that a parameter needs to be set beforehand to know what the overbought and oversold levels are. I wrote an article on overbought and oversold on July 6, 2016.
Clearly, mean reverting measurements would work better in highly volatile markets, such as we have seen in the last two months. One might ask the question: Why don’t you incorporate both into your model? A fair question, but one that shows the inquiry is forgetting that hindsight is not an analysis tool that will serve us well. When do you switch from one strategy (trend following) to the other (mean reversion)? Therein lays the problem.
Another question that might be asked is why not use adaptive measures to help us identify the two types of markets. Again, a fair question. I think the lag between the two types of markets and the fact that often there is no clear period of delineation is the issue. It is an instinct to want to change the strategy to respond more quickly from one to the other. Natural instincts are what I am trying to avoid, simply because they are generally wrong; and painfully wrong at the worst times.
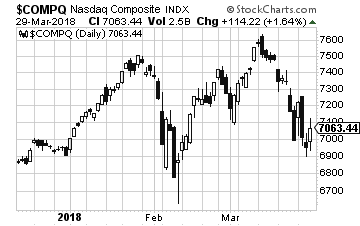
The transition from trend following to mean regression can be difficult to see except with 20/20 hindsight. For example, the current period, when you view a chart, clearly has gone from trending to reversion on or about the last week in January. Of course you didn’t know that for a week or more. From that point if I had used a simple mean reverting measurement, I would have looked like a genius. However, periods like that have existed many times in the past in overall trending markets. Then the next problem becomes when to move away from a mean reverting strategy back to a trend following one. Again, hindsight always gives the precise answer, but, it is extremely difficult to implement in real time.
The bottom line is that with markets that generally trend most of the time, keeping a set of rules and stop loss levels in place, will probably always win over the long term. Sharpshooting the process is the beginning of the end.
“Given the difficulty of forecasting the future, it is very useful to simply know the present.” Unknown.
Dance with the Trend,
Greg Morris


