 I’m going to return to discuss the final part of my Weight of the Evidence. As a reminder this is a collection of price and breadth measures designed to tell me if the Nasdaq Composite is in an uptrend or not. You might want to review some of the past articles in this series as I’m going to try to not repeat unless necessary for clarity.
The model uses a basket of technical measures to determine the overall risk levels in the market as defined by the Nasdaq Composite Index. The model has been constructed so that each technical measure carries a specified weight based upon extensive research. These weights (percentage points) are cumulated to derive a total model point measure to build the Weight of the Evidence. This approach gives one the ability to protect assets in difficult market environments (low Weight of the Evidence totals) while also allowing one to make tactical shifts to better performing assets when the investment environment is more favorable (high Weight of the Evidence totals).
Each of the Weight of the Evidence components is assigned a weight (numerical value) based upon their percentage contribution to the overall model, with the total of all components equal to 100. The Weight of the Evidence is further broken into four different levels. For example, if the sum of the weights of the indicators is equal to 65, the model would be deemed to be yellow as the yellow range is from 51 to 80. These ranges and the number of ranges are determined during model development and research. In this example, I have four ranges, with the middle two considered as transition ranges. This allows the model to absorb some market volatility without penalizing the process.
0 – 30 = Red
31 – 50 = Orange
51 – 80 = Yellow
81 – 100 = Green
These levels serve the model concept as they determine what set of rules to use to buy, sell, or trade up. Asset allocation (equity exposure) values are also a function of the Weight of the Evidence Level. The Weight of the Evidence model uses these primary components that, when used together, help determine the most appropriate asset allocation level as measured by the model. The terminology below of “turning on” refers to the fact that the measurement is indicating a positive or upward trend. In this example, the price-based components are:
Trend Capturing with Price
Price Short
Price Medium
Price Long
Adaptive Trend
The next group of components falls into the category of Market Breadth measures. Market Breadth indicators allow one to look at the market internals that are not always reflected in the price action of the market. This is much like a physical examination performed by your doctor. You might be feeling fine but when the doctor runs his diagnostic tests he is getting an internal look that can potentially find a health risk that you were not aware of. That is the precise reason it is recommended you have routine physical exams. In this article I attempted to illustrate how such Breadth measures can be used to evaluate potential risk in the markets that is not readily apparent in the price action alone.
Here are the breadth-based measures used in this example of the weight of the evidence used in my Dance with the Trend model:
Advance/Decline
New Highs / New Lows
Up Volume/Down Volume
Breadth Combination
Trend Capturing with Breadth
The single remaining weight of the evidence component is the relative strength measure. It is a compound measure using small cap versus large cap, growth versus value, and breadth versus price. I added this component in this article because I used it for over a decade but have since abandoned it as its contribution seemed to diminish. Chart A shows the Nasdaq Composite in the top plot color-coded as to what the weight of the evidence is. The blue line is the actual weight of the evidence as it moves between zero and 100. Below that are the nine components I use for my weight of the evidence along with their digitals. That terminology was explained at the beginning of this series if you are not familiar with it.
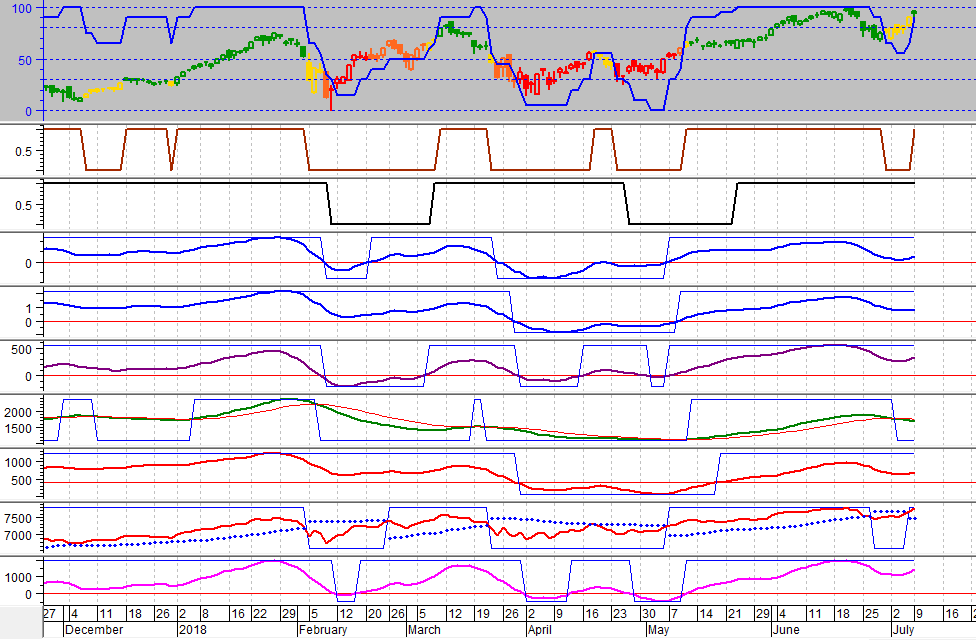 Chart A
Chart B shows how the colors are assigned to the Weight of the Evidence. The blue is the actual weight of the evidence with a gray line plot of the Nasdaq Composite behind it. Think of Chart B as an expanded look at the top plot in Chart A.
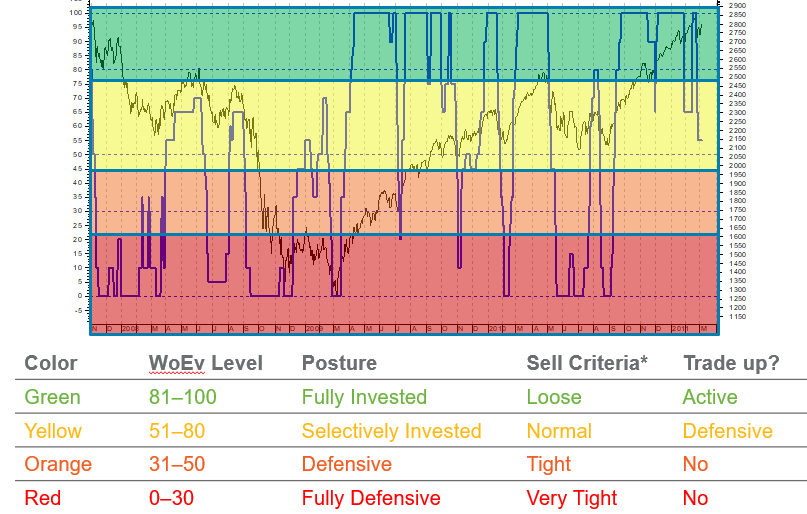 Chart B
The next article in this series will be about the rules and guidelines that are invaluable in a rules-based trend following model.
I’m really looking forward to speaking at ChartCon 2018 in Seattle next month. You will not want to miss this seminar which features all the leading technical analysts in the country.
Dance with the Trend,
Greg Morris


