StockCharts.com's bookstore is offering a limited time, very low price on both books. See the end of this article for details.
The success of the first edition (1992) originally called Candlepower, and the second edition (1995) made the decision to do an expanded third edition easy. I added 20+ new complementary patterns to fill the holes that existed in the Japanese literature. A giant section dedicated to traders has been added. Hundreds of updated charts and tables with statistics from millions of days of data have also been added. This is almost a totally new book.
The classic Japanese candlestick reference updated with all-new insights and tools to improve your predictive accuracy. Candlestick Charting Explained takes the subjectivity out of Japanese candlestick analysis by providing you with standardized, straightforward coverage of 89 powerful candlestick charts patterns. You will learn what they indicate about current trader behavior and how you can use each to instantly improve your market knowledge and analytical precision.
In this revised and greatly expanded third edition, Greg Morris updates his influential guidebook with valuable new material and patterns to give you:
Thorough coverage of candlestick patterns to allow instant analysis of investor attitude and probable market direction. Current insights into trader psychology, and how it impacts interactions between buyers and sellers.
The most valuable and completely new chapter deals with actually trading with candle patterns written by my trading friend, Ryan Litchfield. Methods for integrating candlesticks with traditional Western charting analysis for enhanced signal verification. This chapter alone is worth the price of the book.
Its in-depth exploration of traditional as well as all-new candlestick charts, Candlestick Charting Explained will show you how to make candlestick charting a logical, understandable, and profitable component of your current trading program.
Japanese candlestick charts dramatically improve your understanding of short-term (less than a week) market sentiment, making you a much more informed and focused trader of stocks, futures, and indices. The bestselling Candlestick Charting Explained focuses on the patterns themselves and highlights the key facts you need to know to apply each pattern to your trading. For each of 89 distinctive candle patterns, its standardized format provides you with the following features.
Commentary--Description of pattern and significance of its name, insights into unique features, and other concise explanation. Rules of Recognition--Simple rules for quick, accurate identification along with precise, day-by-day descriptions of pattern development. Scenarios and Psychology Behind the Pattern--Trading scenarios that could have led to the pattern's development, with general discussion of the psychology of each day's action. Pattern Flexibility--Situations that change the pattern's effectiveness with explanations of allowable deviations from the classic pattern. Pattern Breakdown--Instructions for reducing the pattern to a single candle line and whether outside confirmation is suggested or unnecessary. Related Patterns--Patterns that have similar formations, could be considered variations, or are a part of this pattern. Example--A graphic example of the pattern to both aid in recognition and eliminate costly confusion in pattern identification.
Additional information and insights present different interpretations of candlesticks based on intraday instead of end-of-day events and action, improving signal reliability. The author's unique candle pattern filtering concept, instrumental in answering the "how" question, is updated to utilize today's larger universe of stock data. An all-new chapter provides practical application and perspective traders need to view candles in the context of today's computer-driven marketplace.
For millions of traders, candlesticks have become a key tool in creating and verifying trading signals. Candlestick Charting Explained is the only book you need to start integrating their proven versatility and effectiveness into your technical trading program.
After the phenomenal success of Candlestick Charting Explained, McGraw-Hill wanted me to also produce a workbook for it. This was not a task I was interested in but agreed to tackle the job. However, once I began, I found it easy and enjoyable to produce.
The simple purpose of the workbook is to further the reader's understanding of Japanese candle patterns and their usefulness. The reader is delivered the hands-on knowledge you need to make candlestick charting and analysis a key element of your portfolio-building strategy. With this workbook you will be able to:
Identify candle patterns and quickly see what traders and investors are thinking.
Use reversal candle patterns to enter or reverse you position.
Identify continuation patterns to establish additional positions.
Utilize charting software to recognize patterns automatically.
Packed with study questions, data tables, diagnostic tools, terminology, sample charts, and market analysis, Candlestick Charting Explained Workbook helps you speed up the learning process and ramp up the profits.
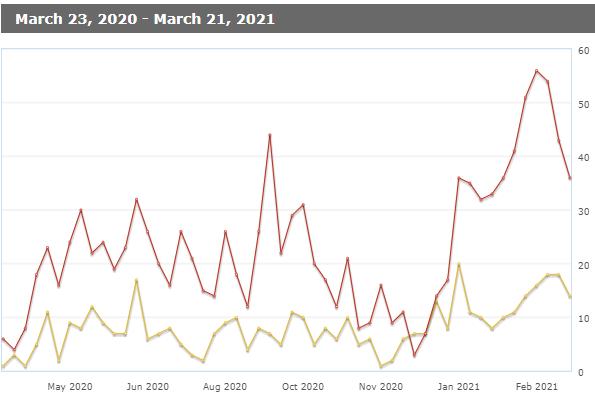
Candlestick Charting Explained and its Workbook have continued to sell very well. The chart below shows the sales for the past 52 weeks. Red for Candlestick Charting Explained and yellow for the Workbook. And these are just the sales from Amazon. Total sales are even higher.
StockCharts.com is offering the following pricing:
Candlestick Charting Explained: $29.95
Candlestick Charting Explained Workbook: $18.95
Remember this is a limited time offer and only while supplies last.
Dance with the Trend,
Greg Morris


