
Let's look at using DecisionPoint indicators in SharpCharts first.
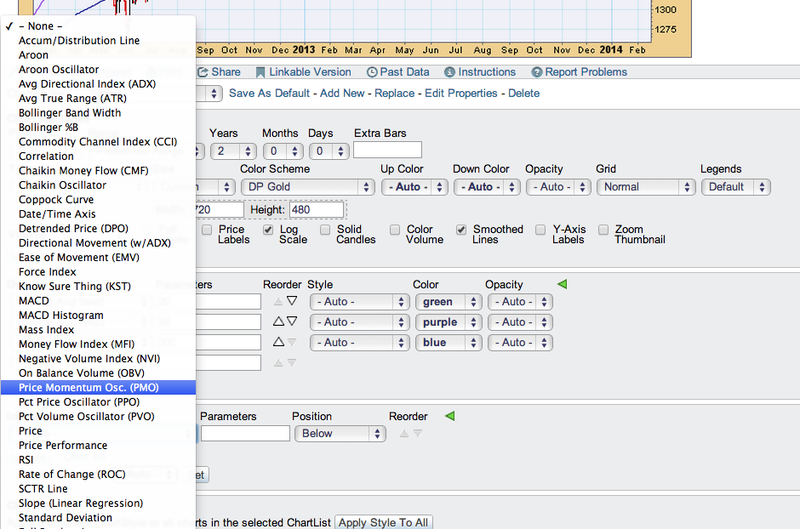
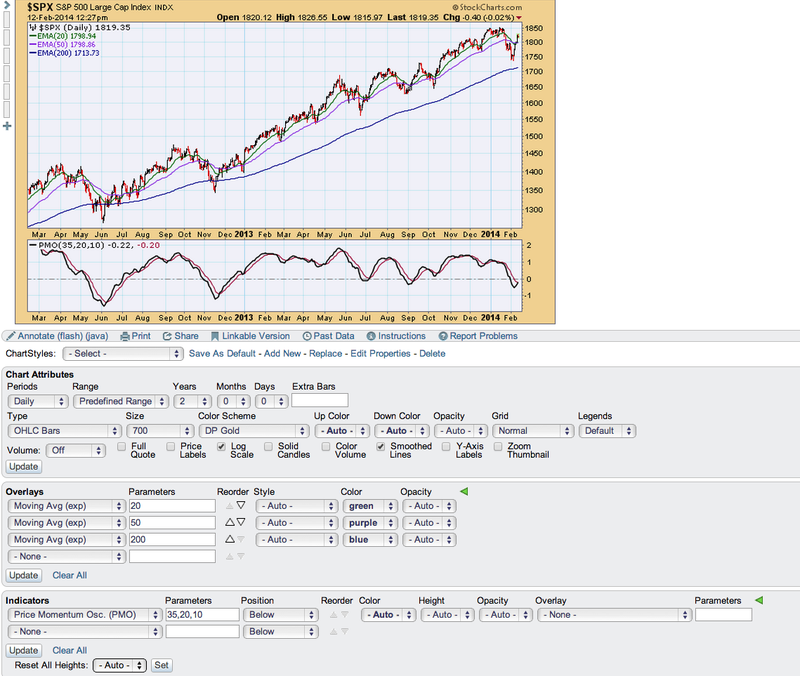
First you need to know what indicator you are looking for. Right now, the most popular indicator is the DecisionPoint Price Momentum Oscillator (PMO). This is easily charted because the PMO is now an option in the indicator drop-down menu on SharpCharts.
You can choose to overlay the PMO, or put it at the top or bottom of your chart. I've chosen the "DP Gold" color scheme and put the PMO on the bottom to make it look like the charts on the DecisionPoint.com website.
(Click here for a live version of this chart.)
But this is an easy example. Let's look at using a DecisionPoint indicator from the "!" set.
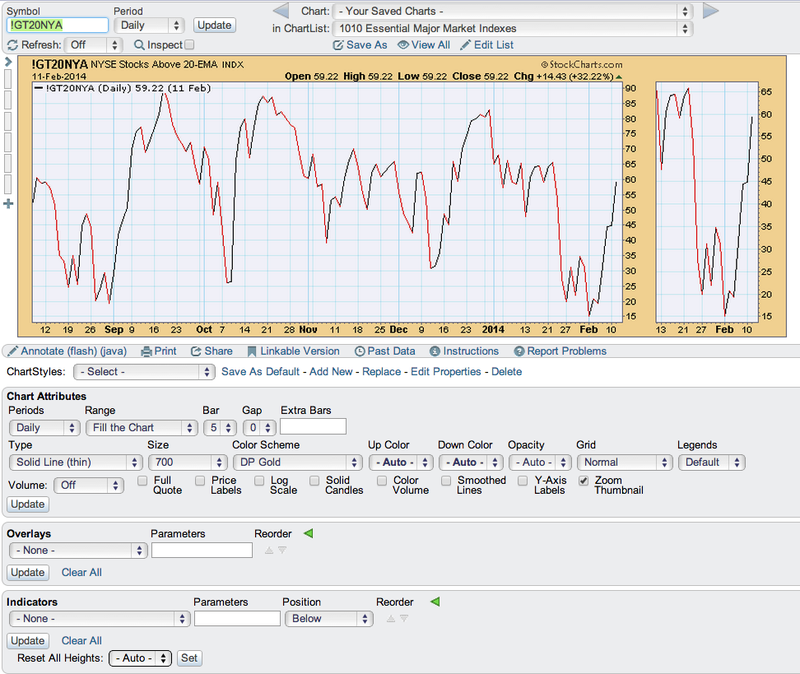
We need to find what indicator we are looking for. If you know the name but not the symbol, start typing part of the name into the "Create a SharpChart" box at top of a StockCharts.com page. For example let's find "stocks above 20-EMA for NYSE". I only need to type in part of the name before it appears in the drop-down.
Alternately, you can just type "!" and look at all of the results for the DecisionPoint indicator set. Or better yet, bookmark this link to a complete list.
I select the indicator and create the chart. (Note it will create the chart in whatever your "default" style is, so it will likely look different than mine. I use a "DP Default" that I created as my default style.)
That's great, but personally I like the index the indicator is related to on my chart. It is the NYSE, so I add $NYSE as a "Price" indicator and place it above above !GT20NYA. I've adjusted the look to have the indicator "Line (thin)" and use "OHLC" bars for the index. You can use whatever your preferences are, annotate, adjust etc. etc. (great, right?).
(Click here for a live version of this chart.)
This section is for current DecisionPoint subscribers.
If you have a favorite DecisionPoint indicator chart that is pre-made on the DecisionPoint.com site and want to create it in SharpCharts, you can find the "!" indicator symbol right from the chart on DecisionPoint. Here's how.
(1) Go to the chart on DecisionPoint.com,
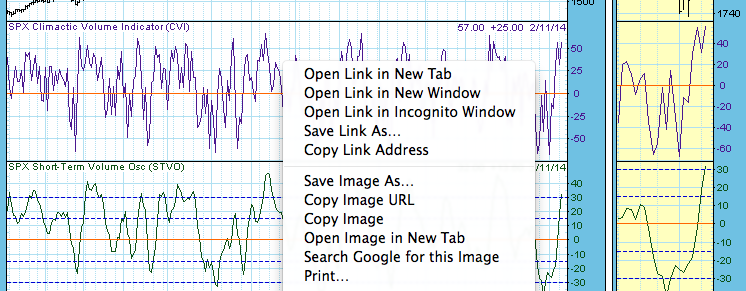
(2) Move your cursor over the specific indicator on the chart you want, hover your cursor right on top of that indicator pane,
(3) Right click. You will see a menu. One of the choices should be something like "Open Image In Separate Window" or "Open Image in New Tab". Key word: IMAGE. Click that.
The indicator part of the chart will open in a separate window. Look in the url. After the "=" sign is a symbol that begins with an exclamation point "!". Write it down for future reference and use it in the StockCharts.com chart workbench.
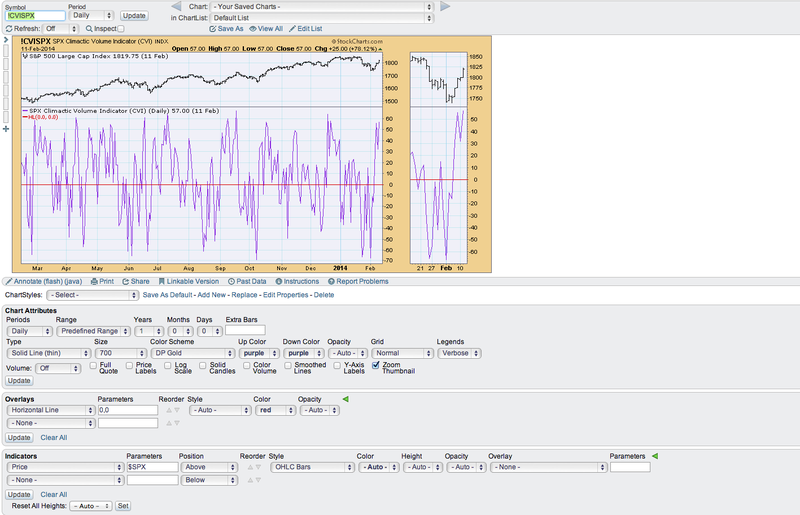
Now you are ready to create it in SharpCharts. This is the CVI indicator for the SPX. To recreate this chart, I type in $SPX as a "Price" indicator and place it above the CVI. This is a daily, 1-year chart, so I adjust the chart attributes accordingly. I make the CVI lines purple and add a Horizontal line overlay on the zero line for the CVI since it is an oscillator (I chose red). Finally, I changed the "Legend" to "verbose" because I want to see the name of the indicator, not just its symbol. You can adjust the look to what YOU like, as well as annotate it, save it for use later, etc. etc.
(Click here for a live version of this chart.)
Remember DecisionPoint subscribers, we are working on creating ChartPacks that have our indicator charts ready-made, so you do not have to recreate all of your charts yourself . These instructions are a way for you to get started now while you wait. Also remember, the DecisionPoint.com website and all of its charts are still accessible and will continue to be until we have transferred content over.
If you have questions, concerns or feedback, we welcome it!
Happy Charting!
Erin

