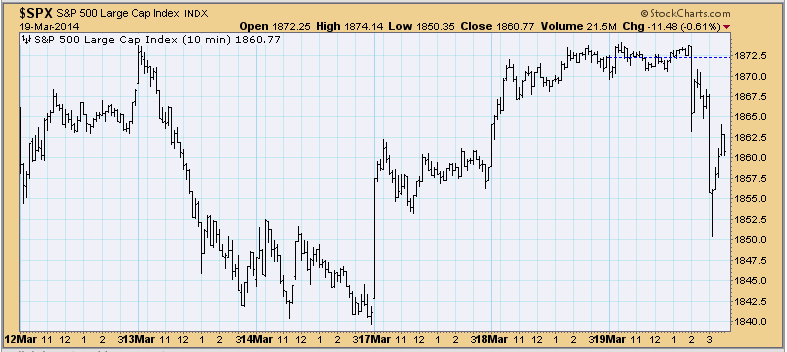
Today saw a sell-off after the Fed announced that it would likely be raising interest rates sooner rather than later. Looking at the 10-minute bar chart below from the DP Intraday ChartPack, we see that while price dropped fairly far, it rebounded to make up almost half of the loss.
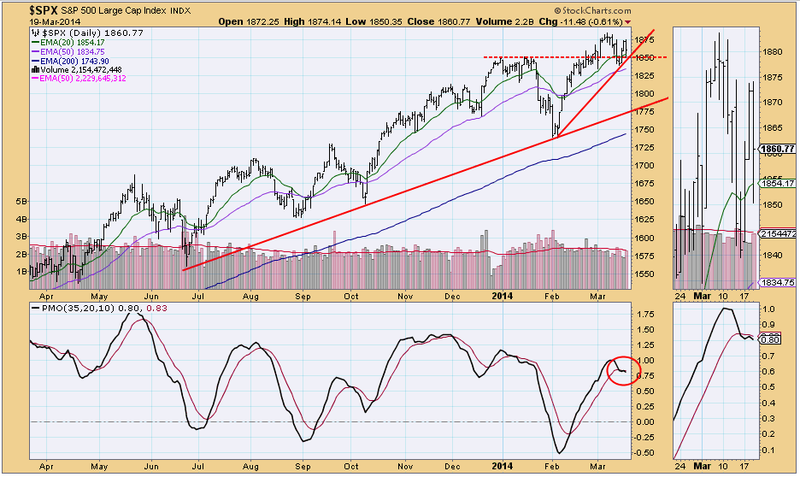
The DP Daily Trend chart for the SPX, the first chart in the DP Chart Gallery, shows that while the price drop was somewhat deep, horizontal support at 1850 and short-term rising trend line support held. Somewhat concerning would be the PMO turning down below its EMA on a high volume down day.
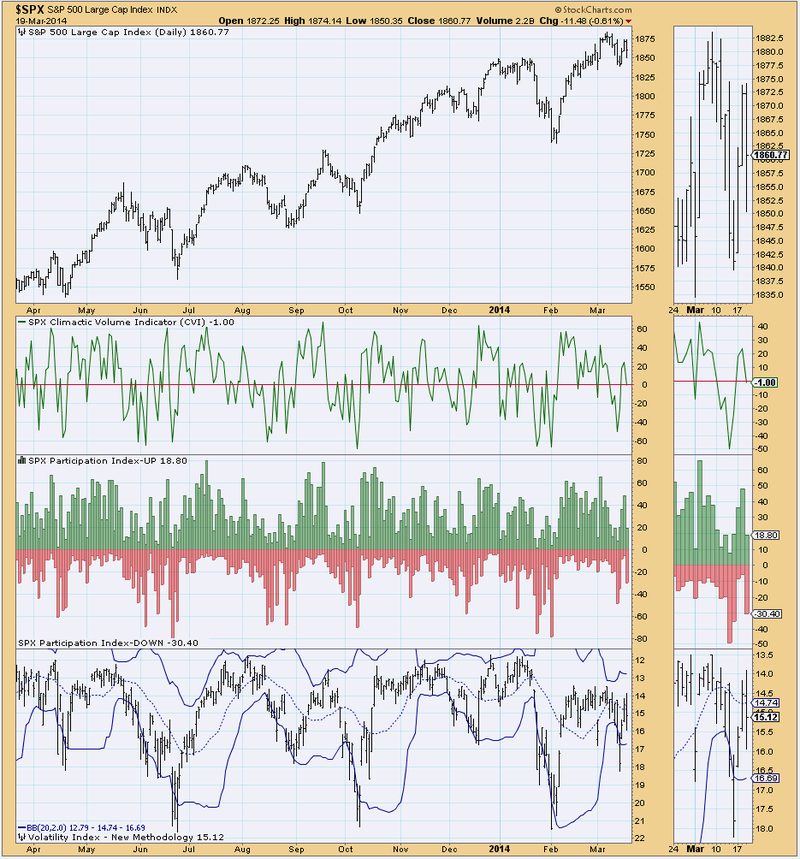
Looking at the Volatile Short-term Condition chart from the DP Chart Gallery, we see that despite a volatile day, none of the indicators showed evidence of a climax. Even the VIX remained inside the Bollinger Bands.
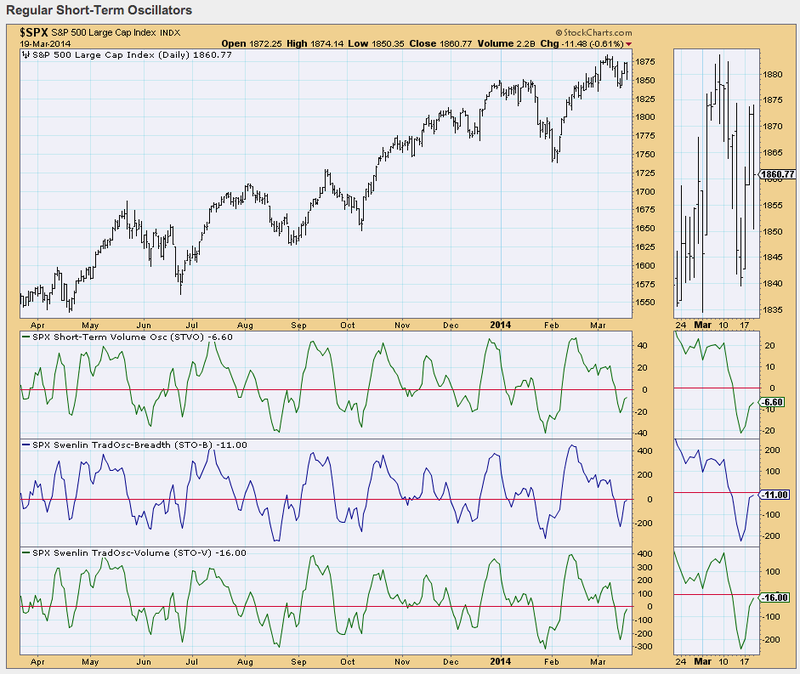
Regular Short-Term Oscillators are decelerating and could top below zero which would be very bearish, but for now they are still rising.
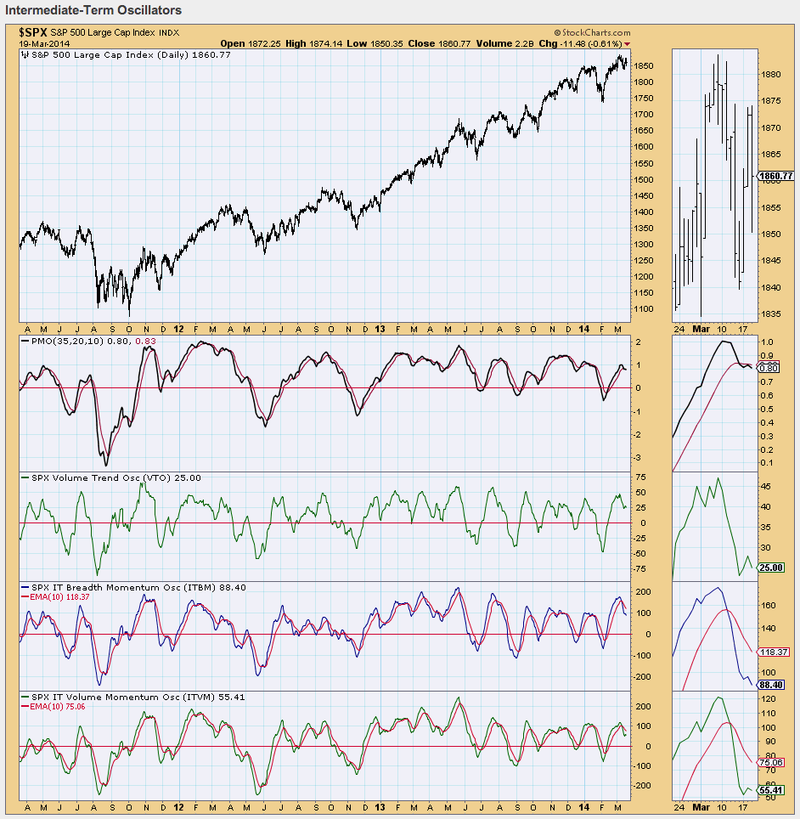
Finally, we see that intermediate term, indicators are configured negatively. As I already noted, the PMO has topped below its EMA. The ITBM and ITVM have topped well-below their EMAs and the VTO has topped.
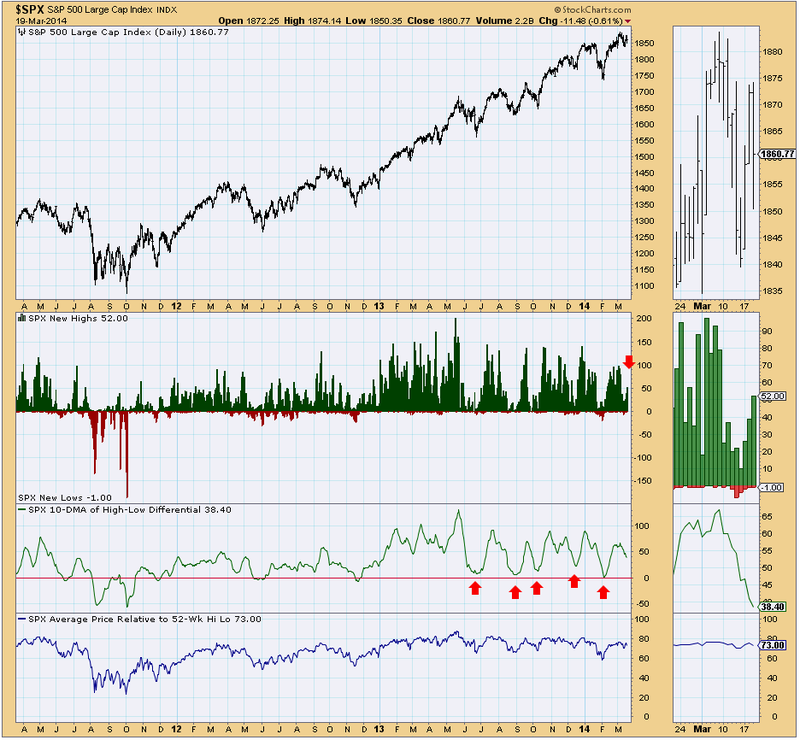
The last indicator chart I want to highlight from the DP Chart Gallery is the New Highs-New Lows. For a negative day, new highs rose and new lows remained static. I particularly like watching the 10-DMA of High-Low Differential. It is still falling right now, but we should keep watch for a bottom as they tend to occur often during price bottoms.
The DP Chart Gallery offers a variety of market views from looking at trends using annotations and EMAs to analyzing overbought/oversold and climactic activity on the condition charts. If you haven't taken time to examine the DP Chart Gallery, I recommend you check it out right now. Additionally, you can get these same views for the Dow, OEX and NDX.

