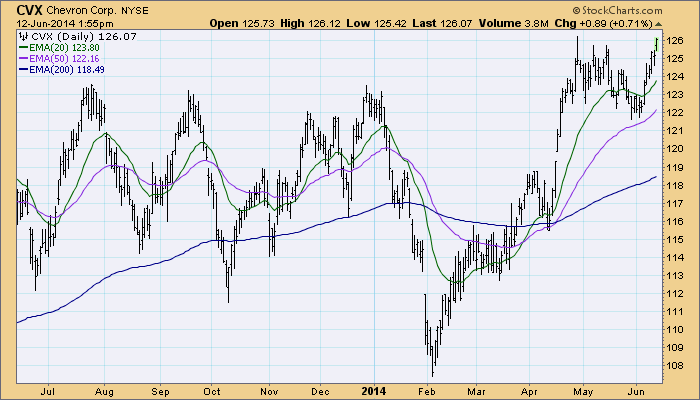
A useful and basic technique for deciding if a stock is bullish or bearish to observe the relationship of price to its moving averages. I use the 20EMA (short-term), 50EMA (medium-term), and 200EMA (long-term), and the stock is considered to be bullish or bearish in a given time frame depending on whether or not price is above or below the moving average. The chart below demonstrates how fleeting these relationships can be, but it is still a quick and dirty way to classify the status of a given stock.
While there are probably more effective ways to evaluate an individual stock, this method is most useful when used in the aggregate. DecisionPoint keeps track of the moving average relationships of all the component stocks in some of the major indexes, and presents the results as a percentage of stocks above their moving averages. The chart below represents the stocks in the S&P 500 Index. Note how the shorter the period of the EMA, the more active the indicator, and important signals are given when all three indicators reach extremes in their normal range at the same time.
Most recently all three indicators topped in very overbought territory and in a manner that in the last two years has usually resulted in a price correction -- previous simultaneous spiky tops have been annotated. I like this kind of indicator because it is derived directly from price, and there is no ambiguity in regard to where price is located in relation to a given moving average.
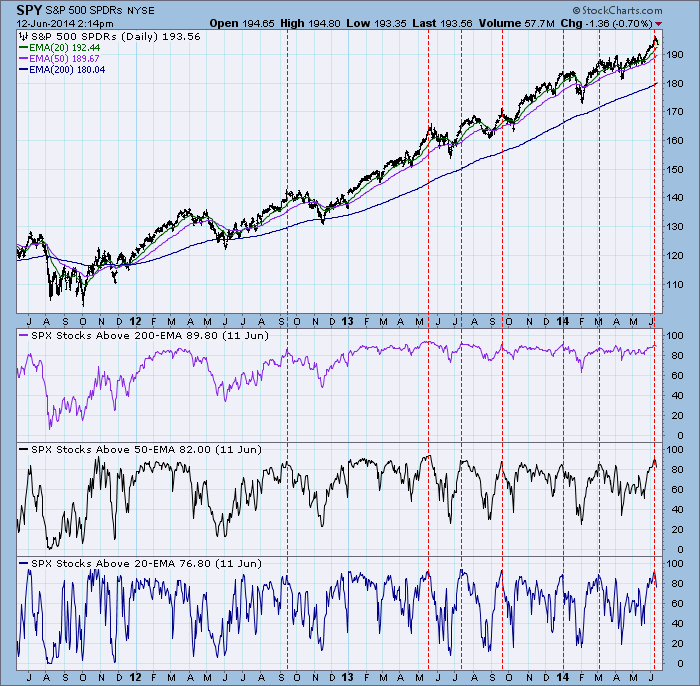
Also of note is the fact the indicator showing the percentage of stocks above their 200EMA has been unusually inactive in the last 18 months. By that I mean that the indicator has remained mostly overbought with very little oscillation, and has made virtually no moves into the oversold side of the range. This is yet another indication that this bull market is unusually strong.
Conclusion: The topping of these indicators in overbought territory is a signal that there is probably a correction in progress. We have no reason to believe that it will be very deep or long (although it could be), but we should be aware that the market will be vulnerable until the 20EMA and 50EMA indicators have moved to near the bottom of their respective normal ranges.


