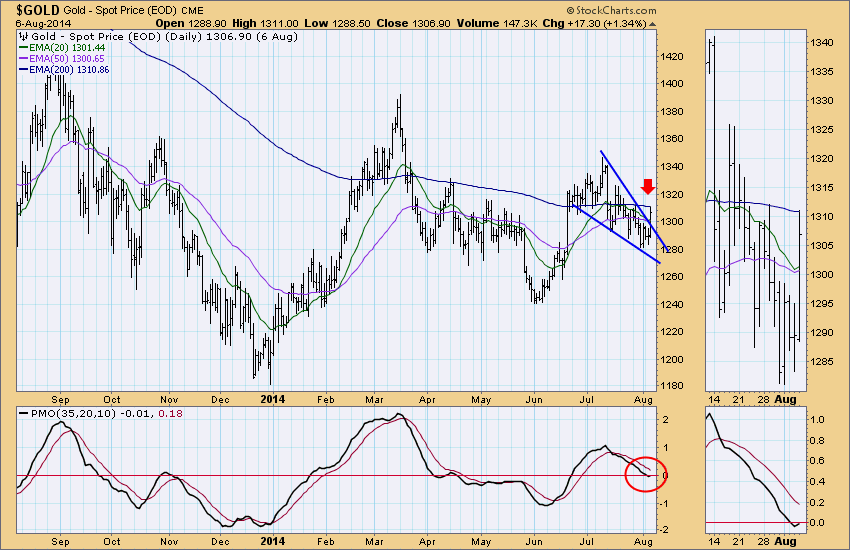
Yesterday, gold rallied and broke out from the bullish descending wedge that was formed over the past month or so. The technical expectation of a falling wedge pattern is a breakout and it happened. Remember, that the only expectation of wedge patterns is a breakout (falling wedge) or breakdown (rising wedge), it doesn't guarantee a continuation of the breakout or breakdown. Now that the breakout has occurred, the pattern has executed and concluded. Yesterday we noted in the DecisionPoint Daily Update that the Trend Model for $GOLD would be switching from BUY to SELL as the 20-EMA was preparing to cross below the 50-EMA. The only way that would have been avoided was if price could get above the 20EMA and 50EMA. We really didn't expect that to happen, but it did anyway. The BUY signal was preserved. Note also that the PMO has turned up, indicating that a positive momentum shift has occurred.
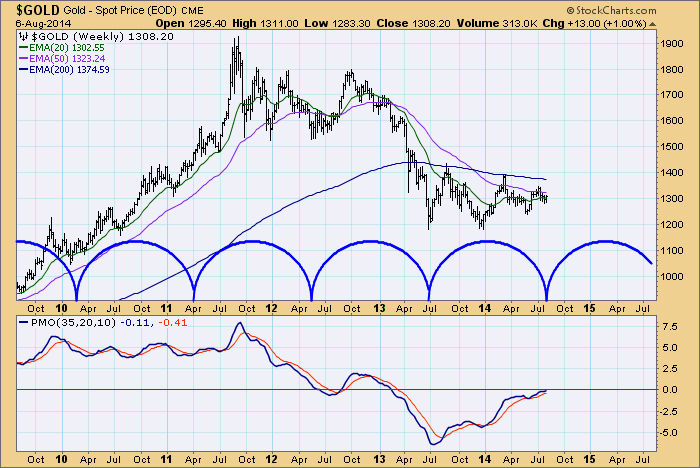
Gold has a 13-1/2 month cycle low due at any time, so today's breakout could be the start of the next up leg. The following chart will help find previous cycle lows. You will note that the cycle lows are not evenly spaced. The weekly PMO is also climbing meaning that in the intermediate to long term there is positive momentum.
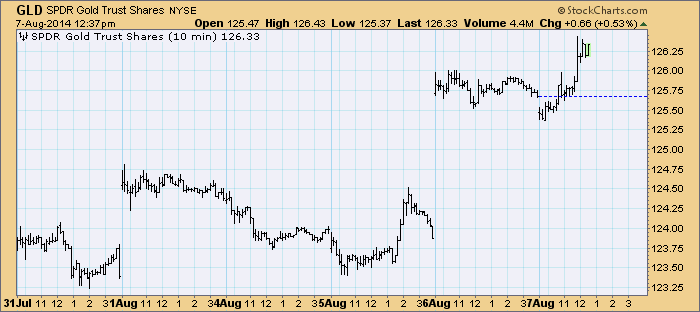
The $GOLD chart updates at the end of the day, but the gold ETF, GLD follows $GOLD price action closely and we see that the rally is continuing so far today.
In conclusion, there is a good chance that we are looking at a new rally in gold. When there is uncertainty in the market, we sometimes will see rallies in gold. Should the market begin to rally, this gold rally could start to wane.
Happy Charting!
Erin
(P.S. I'm writing from ChartCon 2014. If you are at the conference, find me! I would love to meet my DecisionPoint blog readers!)


