We have been watching intermediate- and long-term market conditions using our DecisionPoint indicator sets and DecisionPoint Chart Gallery. Longer-term indicators have been overbought for some time. But as you'll see, some of these indicators can hang out in overbought territory for awhile. The key is to see when these same indicators finally begin to roll over.
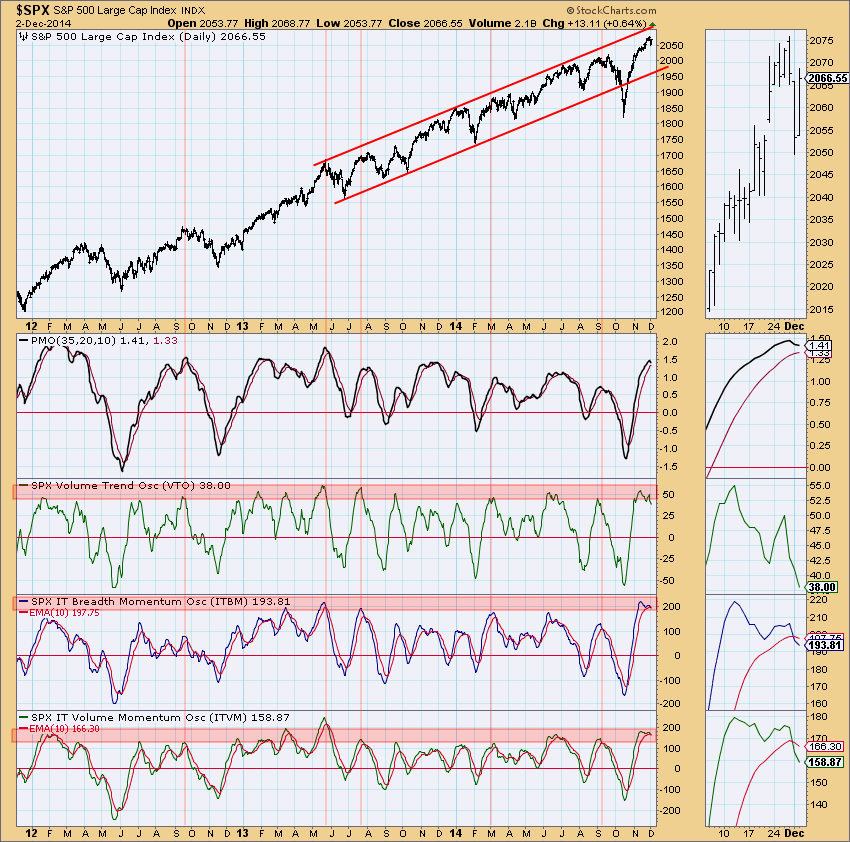
On the intermediate-term indicators, the ITBM and ITVM have had negative crossovers which is very bearish. The VTO has been trending lower since its recent top in November. Notice also that the Price Momentum Oscillator (PMO) finally topped, although it hasn't had a negative crossover its 10-EMA. That will be very bearish as it will generate a PMO SELL signal. These tops have many times coincided with price tops.
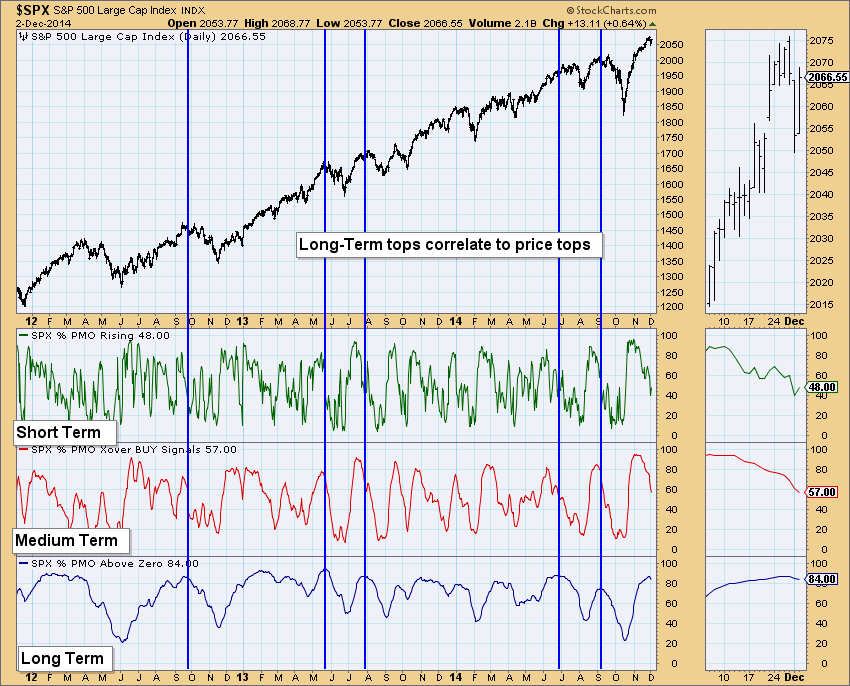
Notice that the longer-term indicator %PMO above zero also tends to coincide with price tops. The best indicator of a price top in this chart would be when all three indicators top; note that the medium- and short-term indicators top just before or at the same time as the long-term indicator. In the case of the chart below, the shorter-term indicators have already topped and are neutral. They are still falling in conjunction with the longer-term indicator. Similar in appearance to the last top.
This is the most interesting chart as the longer-term indicator, %Above 200-EMA. It is consistently near the top of its range during bull markets. So when we see readings begin to top out and move lower, it's time to take note. I also find it very bearish that readings for the longer-term indicator did not reach recent highs before topping out.
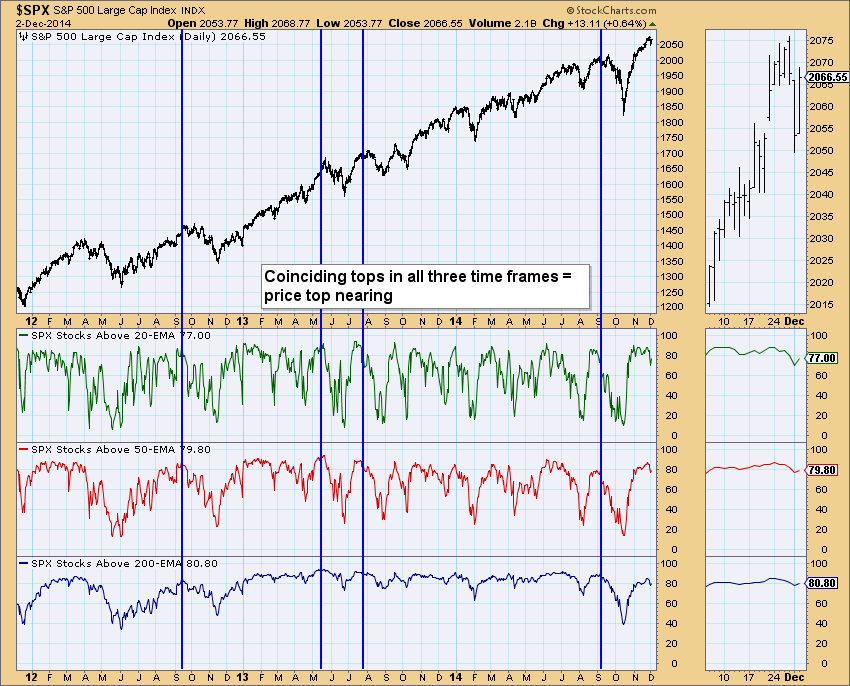
As intermediate- and long-term indicators begin topping, we've seen that price typically begins to consolidate or struggle against overhead resistance. We are in the midst of this struggle as price fights the downward pressure of this overbought market. Longer-term indicators are in line with medium-term indicators and in the case of the PMO Analysis and Stocks Above 20/50/200-EMAs charts, we see that short-term tops have occurred as well. It's just more support for a pullback or small correction.


