I've been skeptical but cautiously optimistic that the market was forming a triple-bottom within the trading range it has been bounded by since the beginning of January. Today, the market broke out of its doldrums and made a significant breakout, though not yet "decisive" which would be a 3% move above the resistance line. I was excited (yes this stuff excites the heck out of me!) to see what our DecisionPoint indicators had to say about this breakout and I wasn't disappointed.
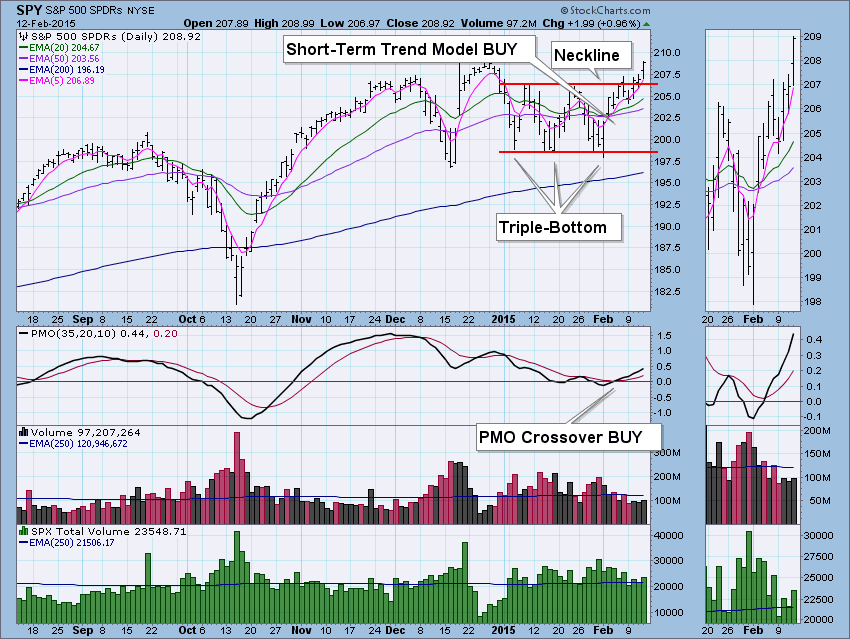
Let's first look at the SPY chart. The triple bottom is clearly visible and price broke above the neckline. If this pattern completes, we would look for a minimum upside target around 214 for the SPY. At the beginning of the month we got a Short-Term Trend Model BUY signal as the 5-EMA crossed above the 20-EMA. The Price Momentum Oscillator (PMO) had already given us a BUY signal when it crossed above its 10-EMA. Volume was somewhat underwhelming, but still above average.
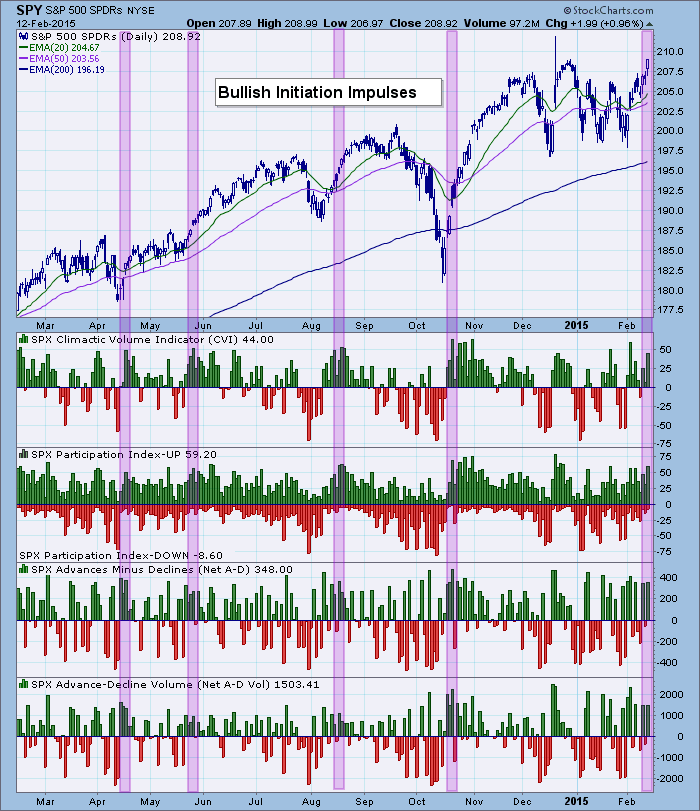
The Climactic Volume Indicator (CVI) and Participation Index-UP both spiked today to begin what I believe is an initiation impulse. These are not perfect by any means but we can see they do tend to coincide with a follow-through to higher prices. Some of the previous spikes turned out to be exhaustion climaxes. I'd be concerned about that here, but our other indicators are bullish.
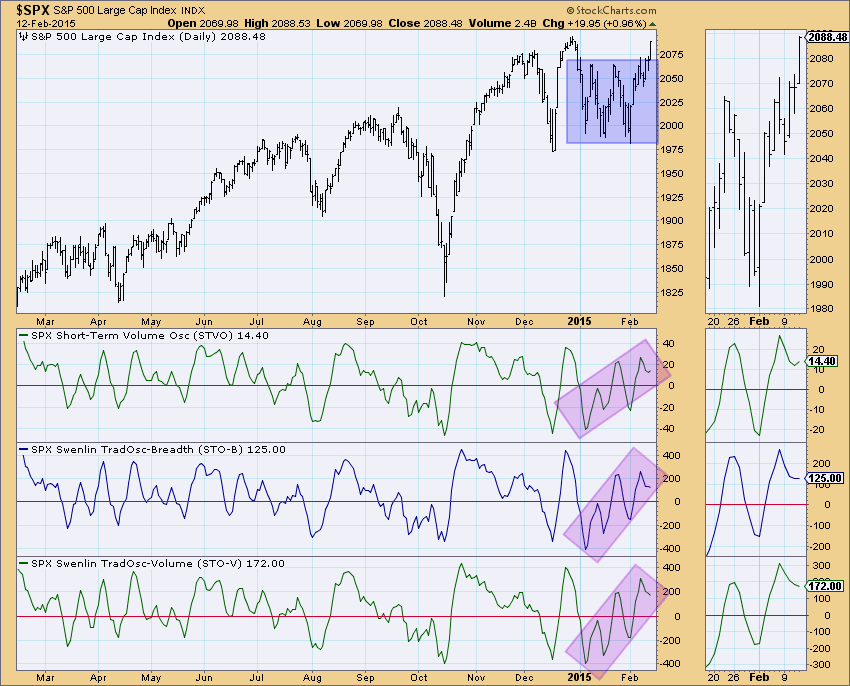
First are the short-term indicators which are still trending higher even while prices were flat. The Short-Term Volume Oscillator (STVO) turned up today and it appears the others are slowing down in anticipation of a bottom.
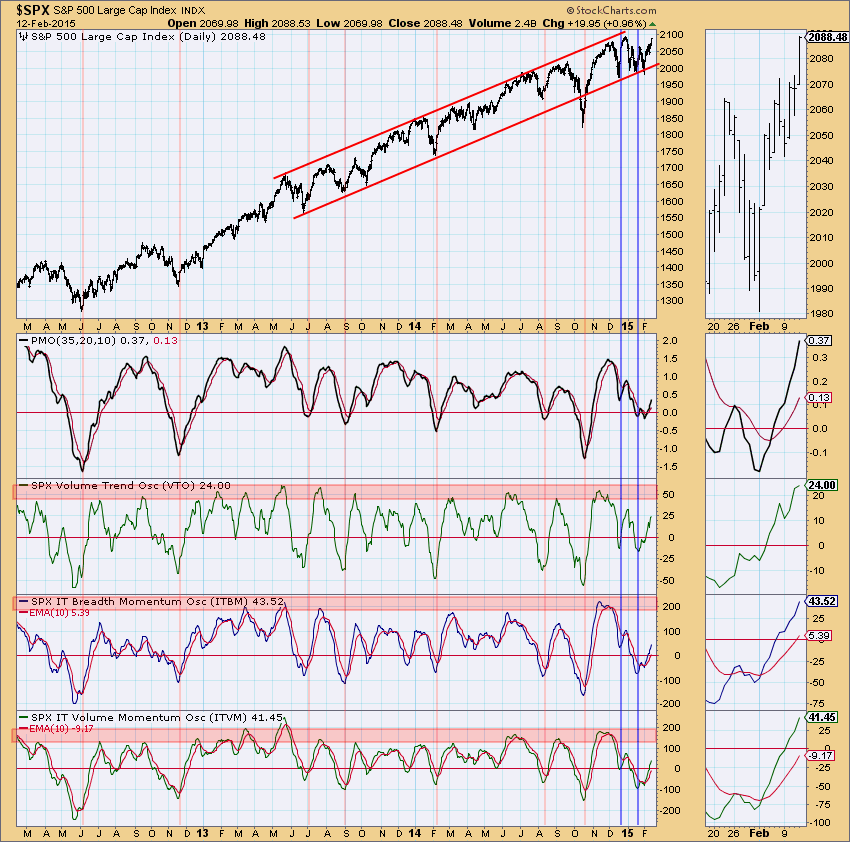
Finally, our intermediate-term indicators continue to be bullish as they rise out of neutral territory. When compared to previous bottoms, this one isn't as oversold but it is definitely in the ballpark. These bottoms tend to be very accurate.
Our indicators seem to confirm the breakout as a triple-bottom execution. It isn't a perfect set up, but price movement and placement is the most bullish we've seen since the beginning of the year.
Don't miss my next DecisionPoint LIVE! webinar! I've really enjoyed having the opportunity to analyze charts, go over indicators and take your questions live. I'll spend time going over a few of our primary indicators like the PMO this Wednesday. Additionally at the end of the show, I'll take your chart requests and give you a DP analysis on the spot! You won't want to miss it! Sign up HERE!
Happy Charting!
Erin


