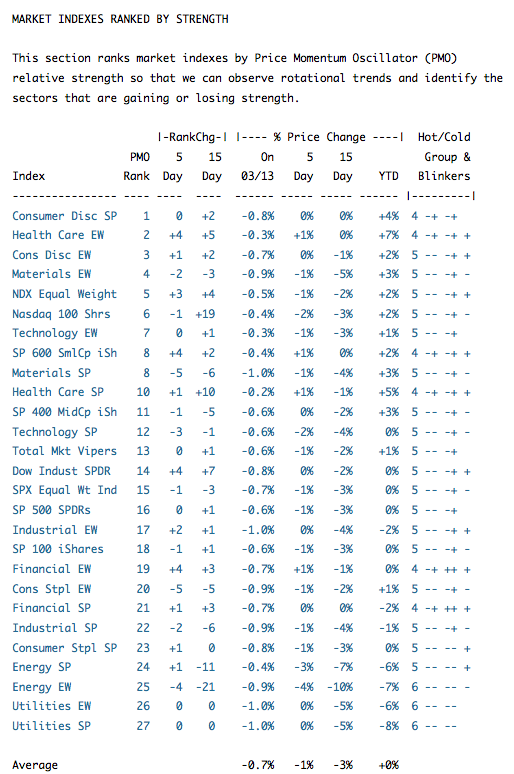
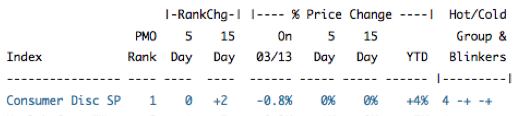
In the DecisionPoint Daily Report and Tracker reports we sort the lists by PMO (Price Momentum Oscillator) rank using the current PMO value and listing the stocks/indexes from the strongest to the weakest, but as usual, we can't take the rankings at face value. There is more to it than that. We can see on the list below that as of Friday (3/13/15) the Consumer Discretionary SPDR (XLY) is ranked number one in the list of market indexes and sectors we track in the DecisionPoint Daily Report.
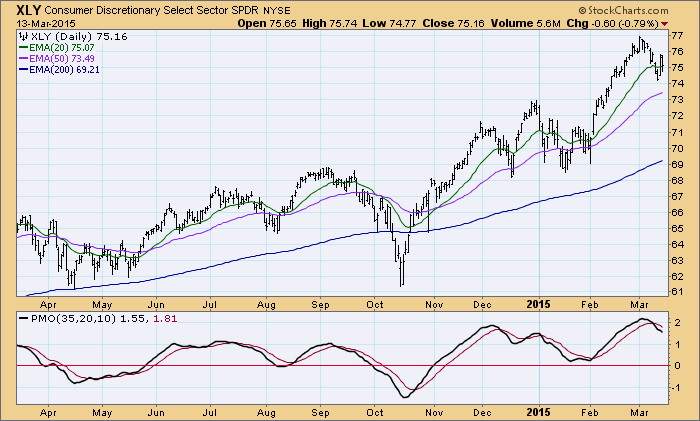
The first thing I will do is click on that line and bring up a chart. We see that price is in a rising trend, but it has topped in the short term. The PMO has also topped in overbought territory and has crossed down through its 10EMA. The conclusion is that, while this ETF has the highest PMO reading of those in this list, internal strength is fading and that XLY is not currently a good candidate for a long position.
Next let's look at the column to the far right, which displays the Hot and Cold Group & Blinkers. The Hot/Cold grouping ranks securities/indexes into six (6) groups ranging from 1 (Hot) to 6 (Cold) according to price strength, internal strength, and relative strength. We can quickly assess the condition of these elements by the group number and "blinker" fields.
Moving from left to right:
The first blinker tells us if the PMO is above (+) or below (-) its 10-day exponential moving average (EMA).
The second blinker indicates if the closing price is above (+) or below (-) its 20-DMA.
The third and fourth blinkers tell us if the PMO is rising (+) or falling (-), and if it is above (+) or below (-) zero.
The fifth blinker tells us if the 5-day PMO rank change is positive (+), negative (-), or no change ( ).
As for determining the Hot/Cold Group, if all the blinkers were a plus (+), the Group would be 1. Conversely, if all the blinkers were minus (-), the Group would be 6. The Groups between 1 and 6 are determined by the configuration of the blinkers, the details of which we will forgo in this article. Groups 1-3 should be considered as buy candidates, 4-6 as sell candidates.
In spite of XLY's number one rank, our chart analysis and the Group rank tell us that this stock is not interesting as a buy or hold candidate.
Finally, let's look at the list as a whole. Notice that the Hot/Cold Group rank for all the stocks in the list are 4 or lower, which on this basis, says there no current candidates to be considered for long positions.
Conclusion: The PMO ranking list is a good place to start looking for strong stocks (or weak stocks, if we are looking for shorts), however, we can see that a high strength rank alone doesn't tell us if strength is increasing or fading. For that information we can look at the chart and the Hot and Cold Group & Blinkers column for a more specific assessment of internals.


