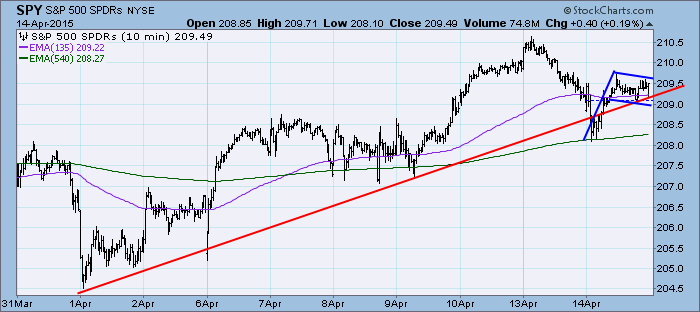
Prices continued to fall, carrying yesterday's decline slightly further. However, losses were recouped early as price bounced right off of the slow moving EMA. This price movement formed an ultra-short-term bull flag that if executed would bring price above yesterday's high.
The purpose of the DecisionPoint Daily Update is to quickly review the day's action, internal condition, and Trend Model status of the broad market (S&P 500), the nine SPDR Sectors, the U.S. Dollar, Gold, Crude Oil, and Bonds. To ensure that using this daily reference will be quick and painless, we are as brief as possible, and often we let a chart speak for itself.
SIGNALS: Here we include the current day's signal table, an excerpt from the DecisionPoint Alert Daily Report.
DECISIONPOINT ALERT DAILY REPORT
Tuesday, 4/14/2015

************************ DECISIONPOINT MARKET POSTURE ***********************

The following is the market posture suggested by our mechanical trend-
following tools. These are not trading recommendations, rather they are price
activity flags that should be qualified by chart analysis. The Trend Model is
used on all indexes.


                                     Days   Index     04/14   Points  Percent
Index               Posture     Date Elap  @Start     Close      P/L      P/L
------------------- ------- -------- ---- -------   -------  -------  -------
Stocks Medium-Term  Bullish 10/31/14  165   199.66   209.49    +9.83    +4.9%
Stocks Long-Term    Bullish 10/31/14  165   199.66   209.49    +9.83    +4.9%
Gold (NY Spot)      Bearish 02/23/15   50  1200.80  1192.60    +8.20    +0.7%
20+Yr T-Bond  (TLT) Bullish 03/19/15   26   130.55   130.72    +0.17    +0.1%
------------------- ------- -------- ---- -------   -------  -------  -------
Dollar Index  (UUP) Bullish 07/21/14  267    21.47    26.01    +4.54   +21.1%
Commodities   (GSG) Neutral 07/14/14  274    32.64    20.32     ....     ....
Crude Oil     (USO) Neutral 07/30/14  258    36.92    18.82     ....     ....
------------------- ------- -------- ---- -------   -------  -------  -------
S&P 500       (SPY)     BUY 10/31/14  165   199.66   209.49    +9.83    +4.9%
S&P Equal Wt  (RSP)     BUY 11/03/14  162    77.46    82.15    +4.69    +6.1%
Dow           (DIA)     BUY 02/03/15   70   175.55   180.18    +4.63    +2.6%
Nasdaq 100    (QQQ)     BUY 10/29/14  167    99.21   107.17    +7.96    +8.0%
NDX Equal Wt (QQEW)     BUY 10/30/14  166    40.47    44.46    +3.99    +9.9%
S&P 100       (OEF)     BUY 02/04/15   69    89.49    91.78    +2.29    +2.6%
S&P 400 MidCp (IJH)     BUY 11/05/14  160   140.67   152.72   +12.05    +8.6%
S&P 600 SmlCp (IJR)     BUY 11/03/14  162   110.56   118.55    +7.99    +7.2%
Total Market  (VTI)     BUY 11/03/14  162   103.05   108.85    +5.80    +5.6%
Consumer Disc (XLY)     BUY 11/05/14  160    67.05    76.21    +9.16   +13.7%
Cons Disc EWt (RCD)     BUY 11/03/14  162    82.41    92.06    +9.65   +11.7%
Consumer Stpl (XLP)     BUY 08/20/14  237    44.00    49.48    +5.48   +12.5%
Cons Stpl EWt (RHS)     BUY 10/21/14  175    97.26   109.53   +12.27   +12.6%
Energy        (XLE)     BUY 04/09/15    5    79.79    80.77    +0.98    +1.2%
Energy EWt    (RYE)     BUY 04/09/15    5    69.34    70.25    +0.91    +1.3%
Financial     (XLF)     BUY 02/13/15   60    24.34    24.33    -0.01    -0.0%
Financial EWt (RYF)     BUY 02/05/15   68    44.13    44.62    +0.49    +1.1%
Health Care   (XLV)     BUY 10/23/14  173    63.89    73.78    +9.89   +15.5%
Health Cr EWt (RYH)     BUY 05/09/14  340   115.73   158.02   +42.29   +36.5%
Industrial    (XLI)     BUY 04/14/15    0    56.50    56.50 * Changed Today *
Industrl EWt  (RGI)     BUY 02/09/15   64    88.54    90.05    +1.51    +1.7%
Materials     (XLB) Neutral 03/27/15   18    48.61    49.71     ....     ....
Materials EWt (RTM)     BUY 04/10/15    4    86.75    86.70    -0.05    -0.1%
Technology    (XLK)     BUY 02/09/15   64    40.87    41.83    +0.96    +2.3%
Technolgy EWt (RYT)     BUY 02/05/15   68    89.42    92.43    +3.01    +3.4%
Utilities     (XLU) Neutral 02/20/15   53    45.33    44.44     ....     ....
Utilities EWt (RYU) Neutral 02/25/15   48    75.94    74.63     ....     ....

Average                               111                               +7.3%
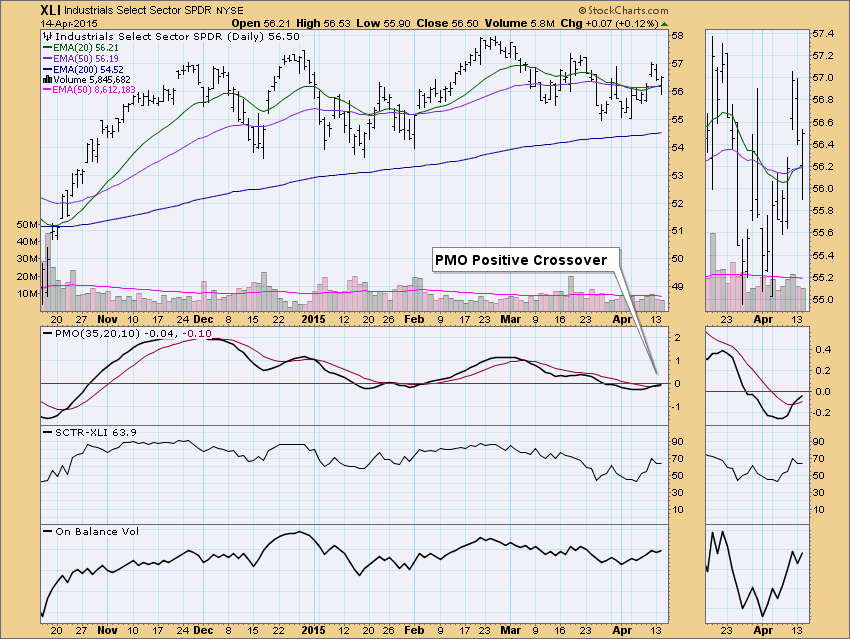
XLI moved from a Neutral signal to a BUY signal today. The Intermediate-Term Trend Model generated the BUY signal when the 20-EMA crossed above the 50-EMA. Good news is that it is confirming the recent PMO crossover BUY signal.
NOTE: Mechanical trading model signals define the implied bias of the price index based upon moving average relationships, but they do not necessarily call for a specific action. They are information flags that should prompt chart review. Further, they do not call for continuous buying or selling during the life of the signal. For example, a BUY signal will probably return the best results if action is taken soon after the signal is generated. Additional opportunities for buying may be found as price zigzags higher, but the trader must look for optimum entry points. Conversely, exit points to preserve gains (or minimize losses) may be evident before the model mechanically closes the signal.
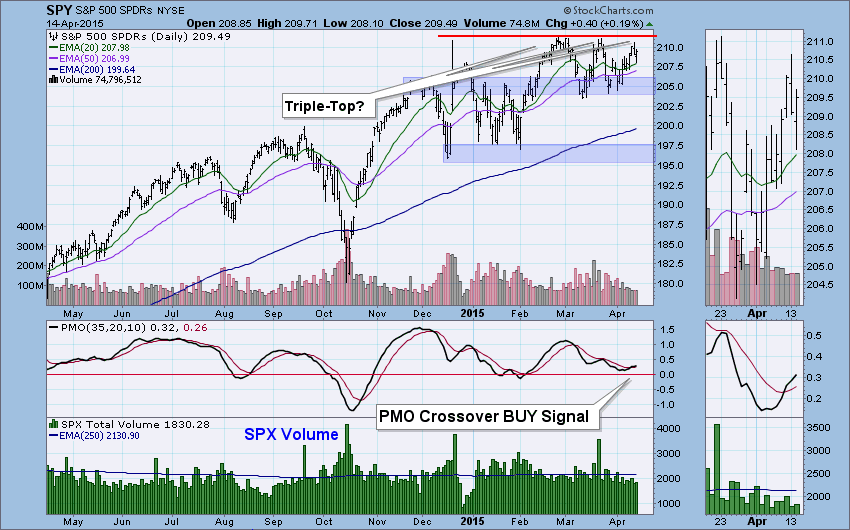
STOCKS: Based upon a 10/31/2014 Trend Model BUY signal, our current intermediate-term market posture for the S&P 500 (SPY) is bullish. The Trend Model, which informs our long-term outlook, is on a BUY signal as of 10/31/2014 so our long-term posture is bullish.
At first glance, I saw a triple-top, but I'm not yet convinced. The 10-minute bar chart movement is bullish and while I can't annotate the thumbnail, you can visually see that the rising trend was not compromised by today's intraday low. Additionally, the PMO looks healthy enough since the positive crossover. Looking at the price movement during January and part of February, I see many similarities. This could be another area of somewhat complex consolidation and congestion as price hits up against strong resistance at the all-time highs. Psychologically this appears to be a difficult hurdle to leap.
Ultra-Short-Term Indicators: There isn't any climactic activity, but I did notice a few negative divergences that do give me pause as to the internal strength behind the current rally.
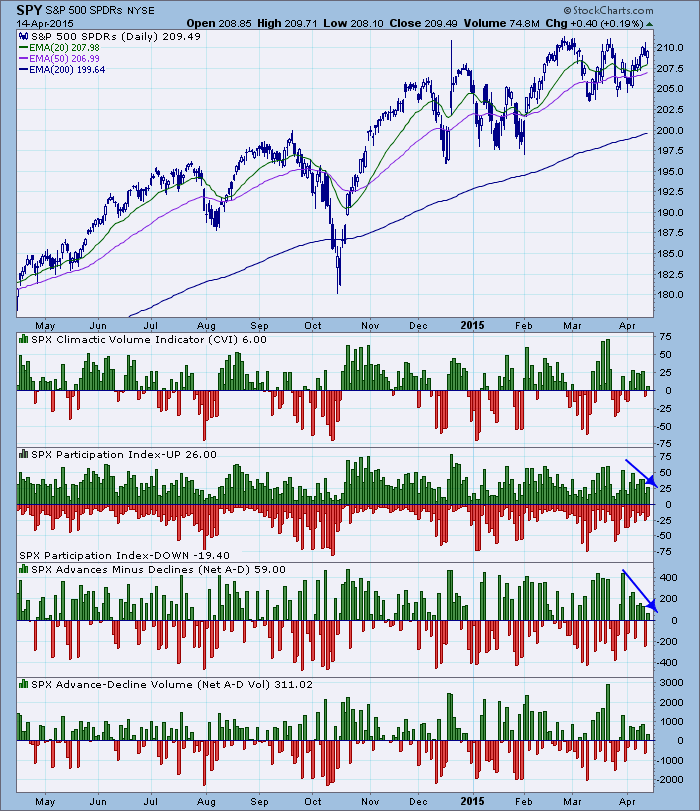
Short-Term Indicators: These indicators are twitching but are staying in a rising trend. It seemed they were on their way down, but they turned back up before completing breaking from that trend. They are getting overbought, but there is room for them to continue higher.
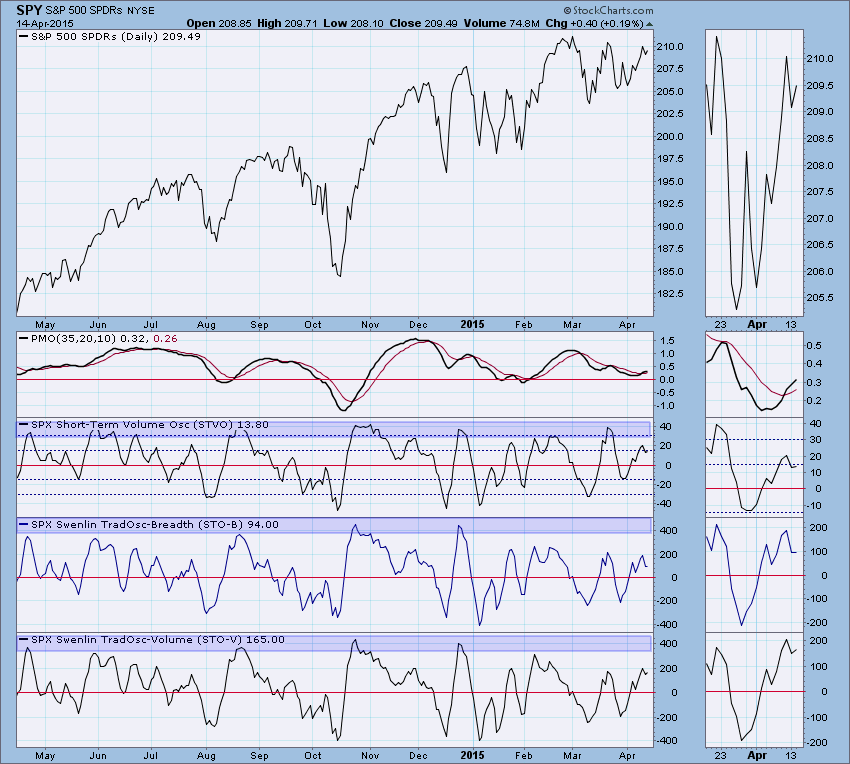
Intermediate-Term Indicators: There is still indecision apparent on these indicators as they wiggle around in neutral. They aren't revealing much.
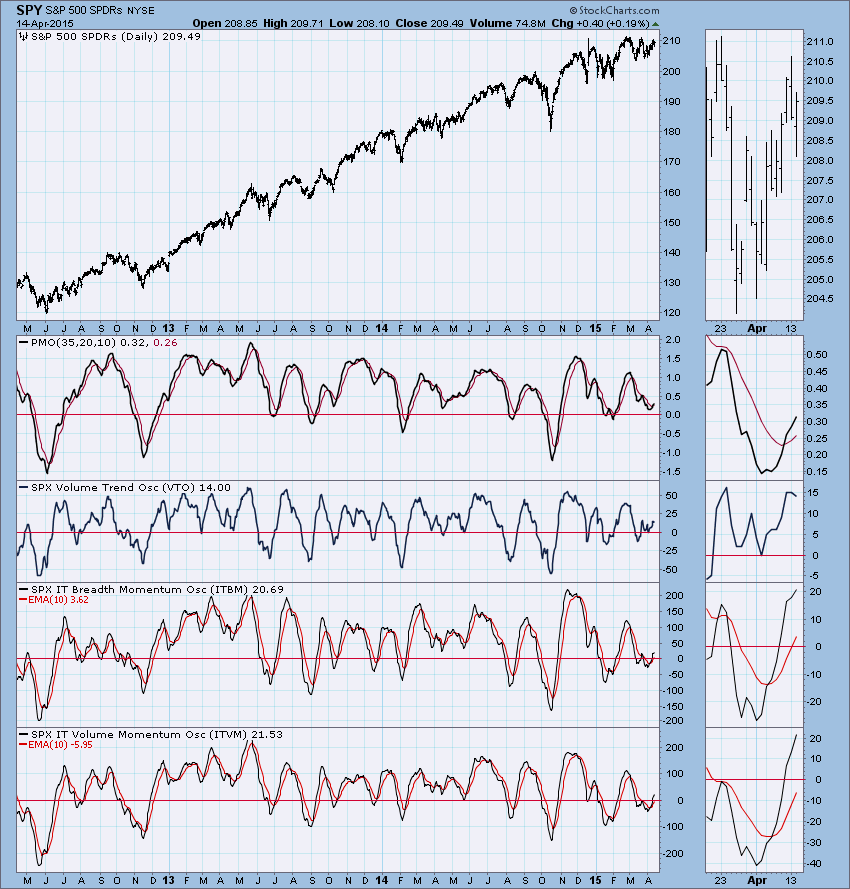
Conclusion: We could be looking at a triple-top formation which is bearish and would suggest that price will drop below current support 205.0. The overall price pattern is very similar to the last rectangular pattern from earlier this year. While that pattern resolved upward, there just isn't enough information to tell us which way this will resolve. I'm not totally convinced there will a breakdown below that area of support because momentum is still positive and in the ultra-short-term it appears another go at overhead resistance is likely. Indicators are mostly neutral, although short-term indicators are fairly positive.
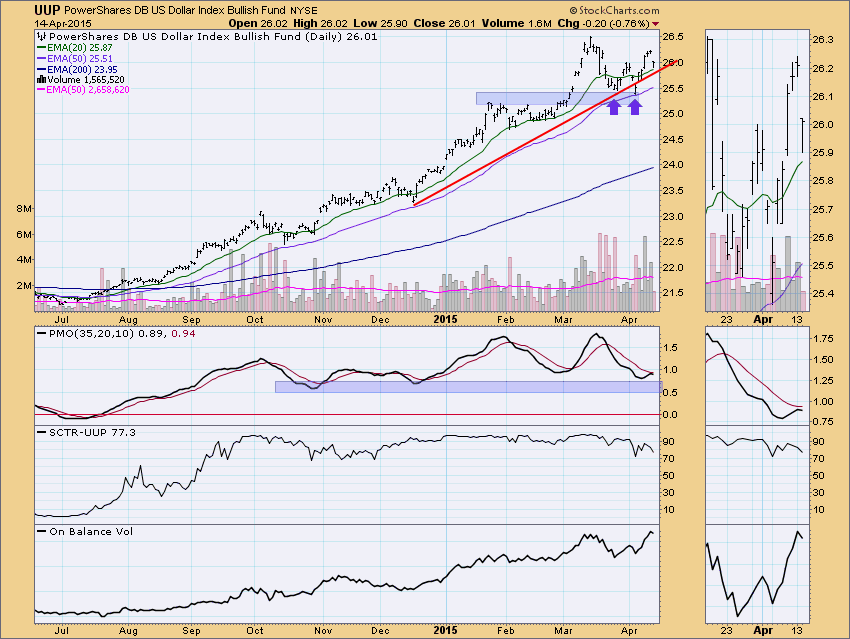
DOLLAR: As of 7/21/2014 the US Dollar Index ETF (UUP) is on a Trend Model BUY signal. The LT Trend Model, which informs our long-term outlook, is on a BUY signal as of 8/21/2014, so our long-term posture is bullish.
After breaking above the neckline of the short-term double-bottom, price gapped down below the neckline. It didn't break below the current rising bottoms trend line and volume was weak on today's breakdown, but the PMO turned down below its EMA which is particularly bearish.
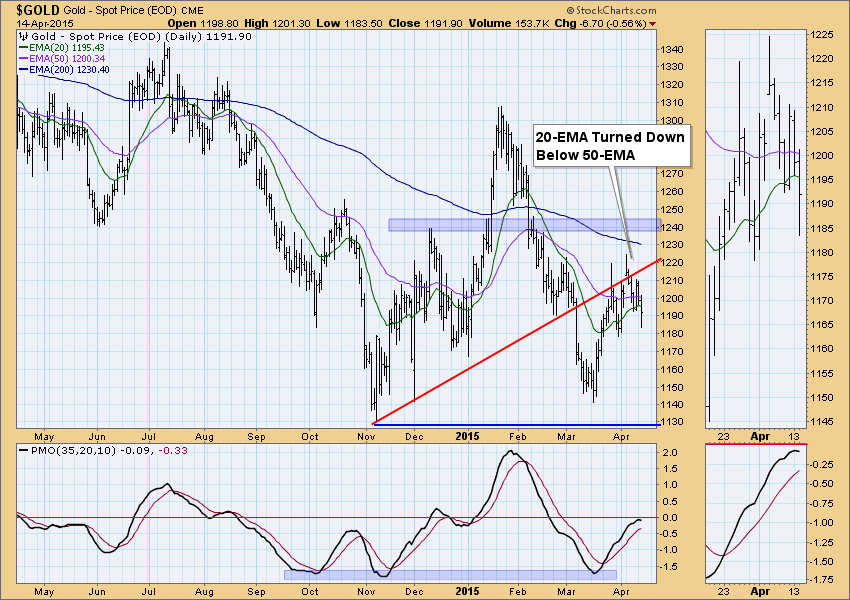
GOLD: As of 2/23/2015 Gold is on a Trend Model SELL signal. The LT Trend Model, which informs our long-term outlook, is on a SELL signal as of 2/15/2013, so our long-term posture is bearish.
Even though the dollar had a bad day, gold didn't really benefit. The PMO has topped and the 20-EMA turned down below the 50-EMA before a positive crossover could occur.
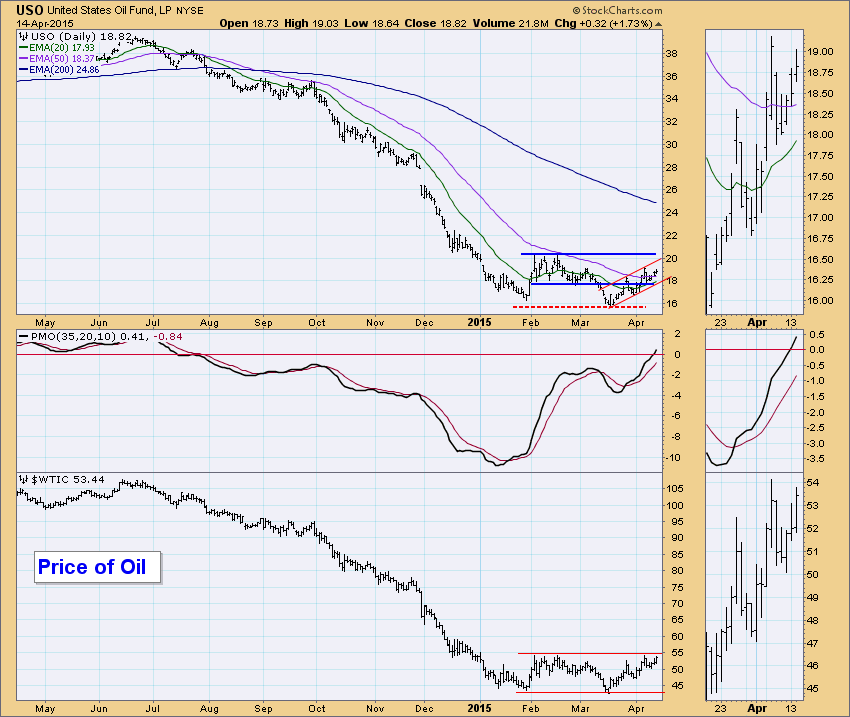
CRUDE OIL (USO): As of 7/30/2014 United States Oil Fund (USO) is on a Trend Model NEUTRAL signal. The LT Trend Model, which informs our long-term outlook, is on a SELL signal as of 8/28/2014, so our long-term posture is bearish.
USO is making a slow and steady rise within a short-term rising trend channel. It hasn't met overhead resistance yet, but the price of oil has. The PMO is rising strongly and is only in neutral territory. It will be telling if oil breaks above overhead resistance.
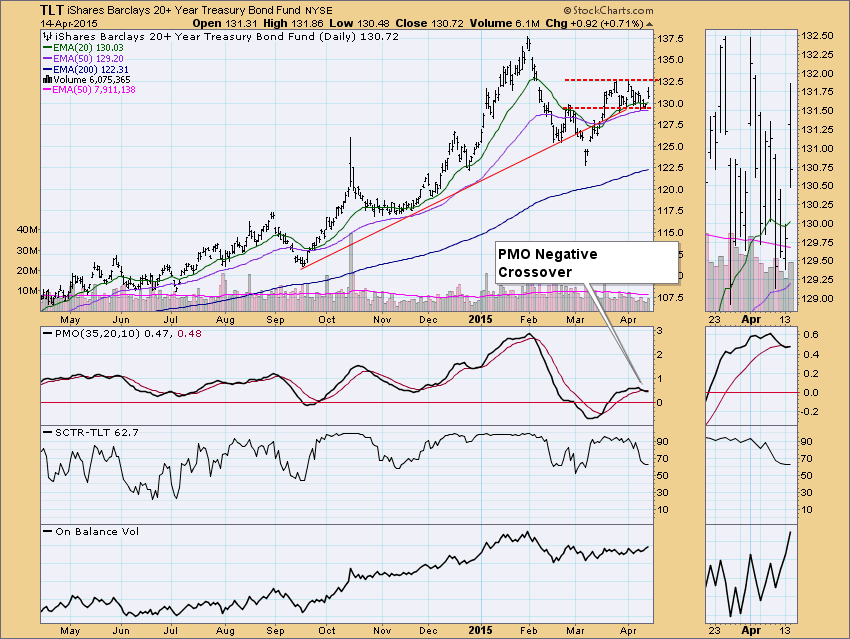
BONDS (TLT): As of 3/19/2015 The 20+ Year T-Bonds ETF (TLT) is on a Trend Model BUY signal. The LT Trend Model, which informs our long-term outlook, is on a BUY signal as of 3/24/2014, so our long-term posture is bullish.
Price has been oscillating within a trading range for the past month. It looked like a double-top or a flag, but at this point it just seems to be consolidating. The PMO had a negative crossover yesterday with the same reading as today. I'm not particularly concerned with this negative crossover because it could easily be turned into a positive crossover if we see any type of positive follow-through on today's move.
Technical Analysis is a windsock, not a crystal ball.
Happy Charting!
- Erin


