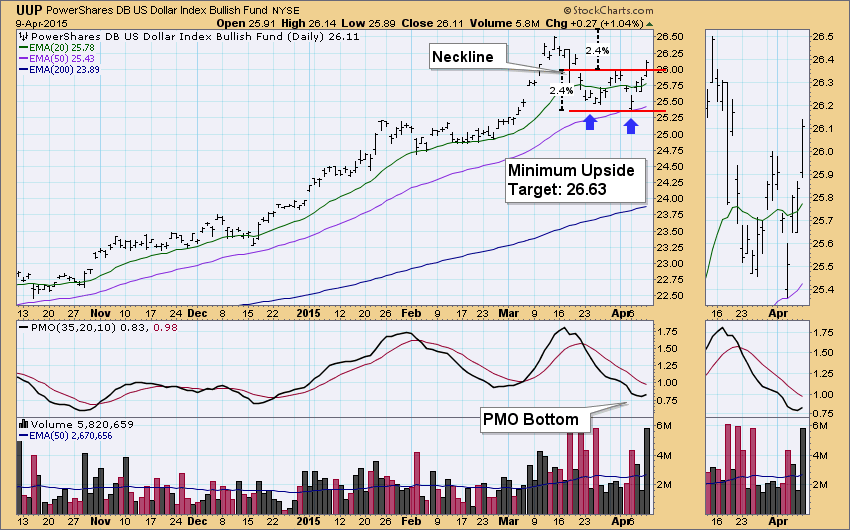
I've been watching the dollar, UUP (PowerShares US Dollar Index ETF) in particular. A short-term double-bottom has been forming and today price penetrated the neckline, executing this bullish chart pattern.
Looking at a six-month daily chart the pattern is easy to see. When a double-bottom pattern executes, the minimum upside target is the length of the pattern added to the neckline. Using the percentage tool in the charting workbench, I annotated the length of the pattern and then added it to the neckline. This puts the minimum upside target at about 26.63. Notice also that the Price Momentum Oscillator (PMO) has turned up indicating that momentum has shifted to positive.
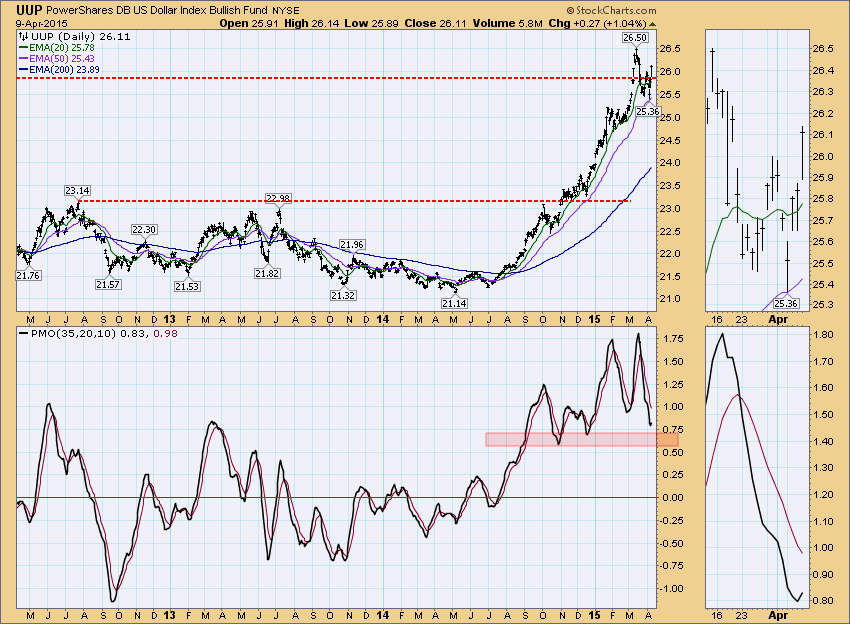
The PMO bottom above appears to be occurring in oversold territory, however, when we examine a longer-term daily chart, we see that isn't the case. I don't think this is a problem. The PMO is in positive territory which implies that UUP has internal strength. We would like to see a positive PMO crossover which would generate a PMO Crossover BUY signal. Even with the PMO turning up in neutral territory, there is definitely room for it to rise. That is clearly seen in the chart below.
The weekly chart will not go final until tomorrow, but currently the weekly PMO has turned up. In this case, the weekly PMO is overbought and the price bar for this week broke below the rising bottoms trend line (visible in the thumbnail as well). There is distance left to travel before overhead resistance is met.
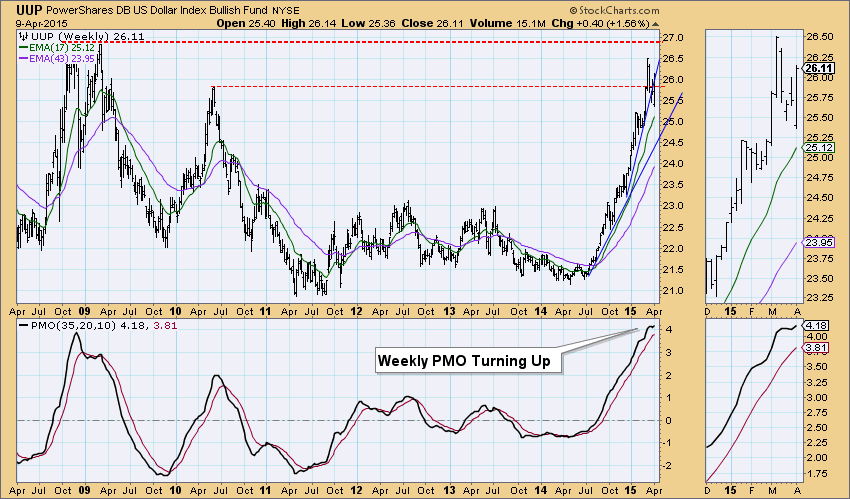
The short-term picture for UUP is bullish, however, long-term overhead resistance is nearing and the weekly PMO, though it turned up, is overbought so the longer-term picture is a bit muddy.
Happy Charting!
Erin


