There were two important signal changes in the DP Scoreboards in the DecisionPoint Chart Gallery. The NDX finally submitted to a long-term Price Momentum Oscillator (PMO) SELL signal. The other three in the gallery were already on long-term PMO SELL signals. Additionally, the Intermediate-Term Trend Model (ITTM) generated a Neutral signal on the SPX. Take a look at the scoreboards below. The dates underneath each arrow (or minus) tell you when the signal change occurred.
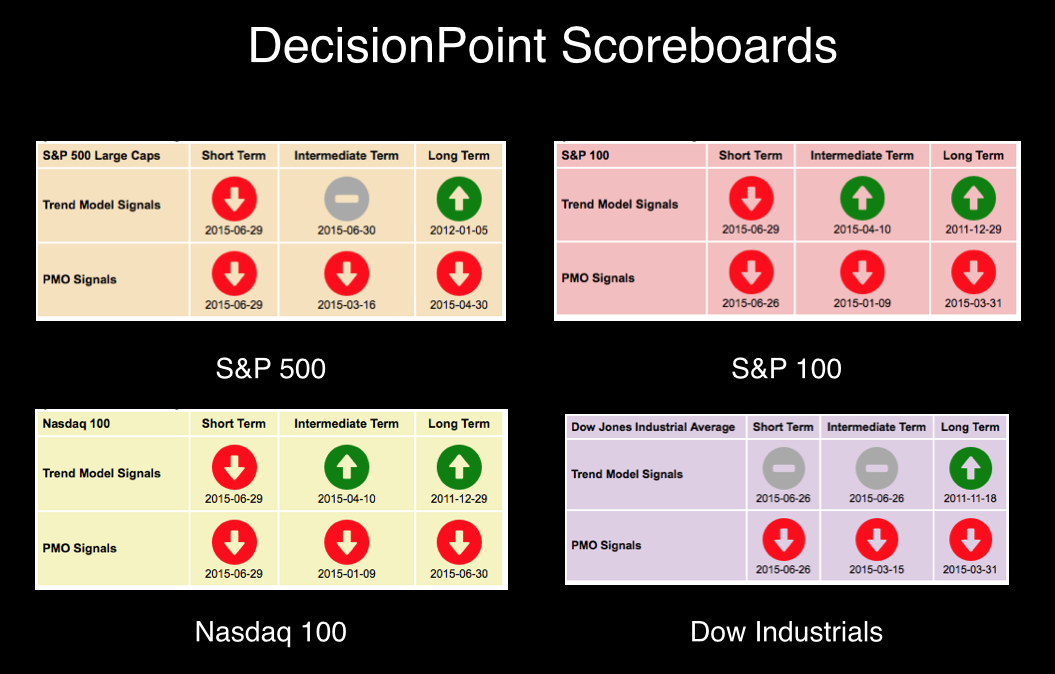
Notice that in all four indexes, the PMO is on a SELL signal in all time frames. This tells us that momentum for the market is bearish, price will need to overcome some significant negative momentum. The Short-Term Trend Model is on a SELL or Neutral. Intermediate-Term is mixed between Neutral and bearish. If you read my DecisionPoint Alert blog article today, you might note that the indicators in the ultra-short and short term are somewhat bullish right now and suggest a short-term bounce. The Scoreboards imply it may take serious investor optimism to keep any short-term rally afloat for too long. Remember, the PMO signals are generated by PMO crossovers on a daily chart (ST), weekly chart (IT) and monthly chart (LT). The Trend Model positions are generated solely on a daily chart and refers the location of the 5/20/50/200-EMAs.
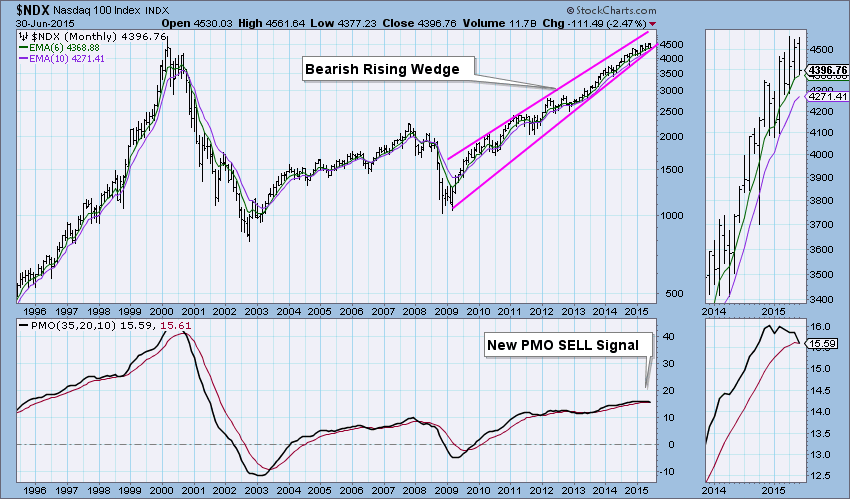
The NDX long-term PMO SELL signal is visible below on the monthly chart. The rising wedge pattern is bearish and implies that price will break down from it. Unfortunately with wedges, we are given a direction that price should move to, but not the distance it will travel once it executes.
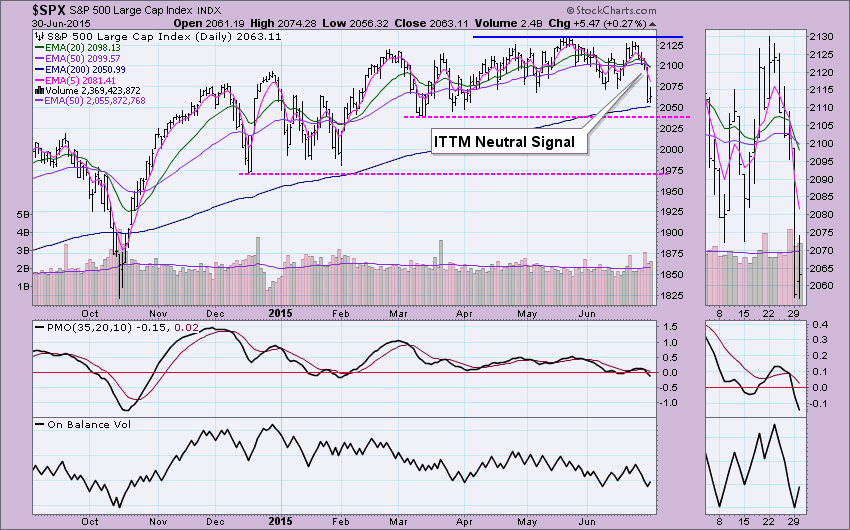
The ITTM Neutral signal generated when the 20-EMA crossed below the 50-EMA. It is a Neutral signal because the 50-EMA is above the 200-EMA and that implies the SPX is in a long-term bull market. We wouldn't want to move to a SELL in a bullish environment. If the 50-EMA is below the 200-EMA when the 20/50-EMA crossover occurs, then it is a SELL signal because it is considered to be in a bear market.
Clearly market conditions in all three time frames are negative based on the PMO SELL signals on all four indexes. The DecisionPoint Scoreboards imply the bear will not be hibernating this Summer.
Technical Analysis is a windsock, not a crystal ball.
Happy Charting!
- Erin


