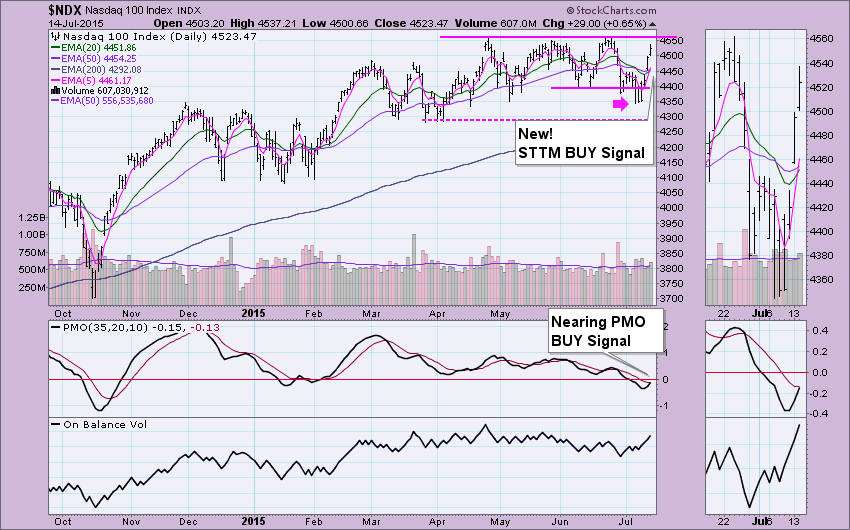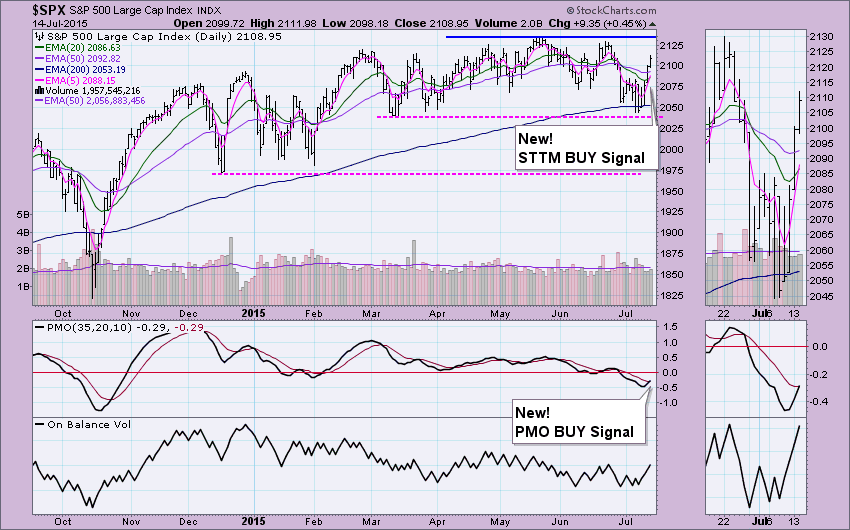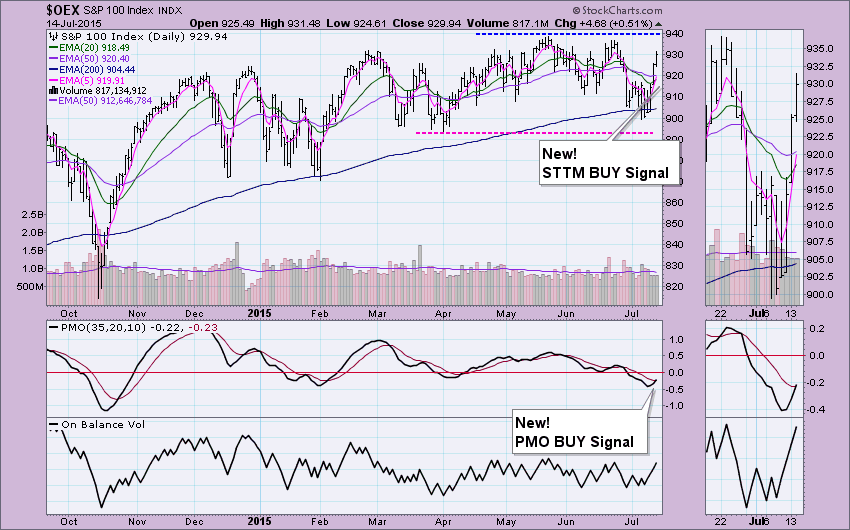
I will admit to you that when I get the Technical Alert emails from the StockCharts.com ScanEngine regarding changes for all of the DP Sector ETFs and Indexes we follow in the DP Market/Sector Summary, I cringe a little. I'm excited to know the changes but I know I now need to update all of the charts that have had changes so I can put the links into the DecisionPoint Alert daily blog article. This take some time, but my Alert readers are worth it! Today you'll note a plethora of short-term signal changes in the DecisionPoint Alert. The BIG NEWS: New Short-Term Trend Model (STTM) BUY Signals and Short-Term Price Momentum Oscillator (PMO) BUY Signals on all four of our DecisionPoint Chart Gallery Scoreboards.
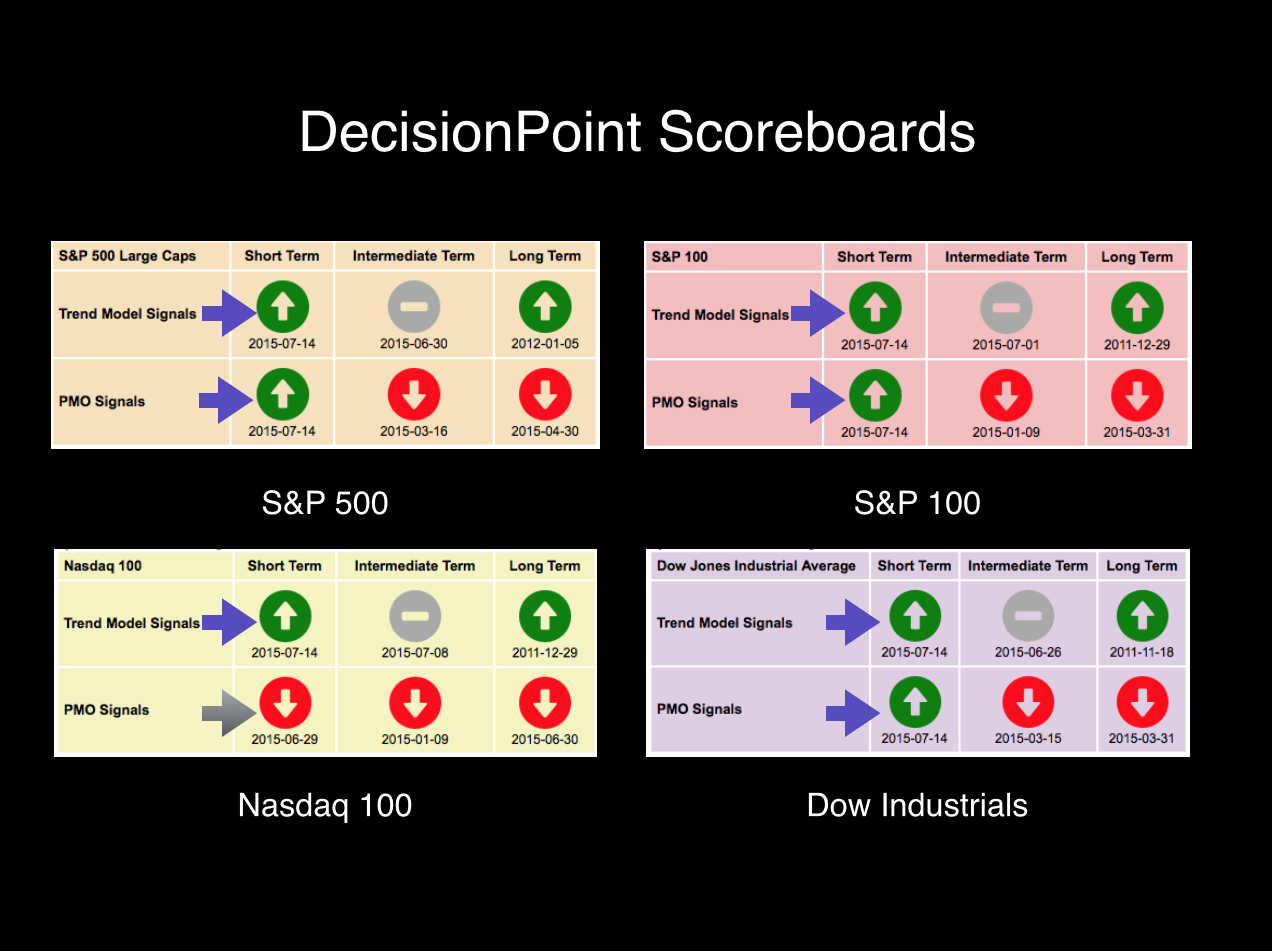
You'll note that the $NDX hasn't yielded a Short-Term PMO BUY signal yet. Here's a peek at the chart. The $NDX Scoreboard change will occur tomorrow unless it has a deep decline. The concern is whether price will be able to burst through resistance at all-time highs.
Here's a look at the other three charts. All three have more potential upside before running into overhead resistance. The Dow Industrials did hit a declining tops line, but overhead resistance at all-time highs is quite a few clicks away.
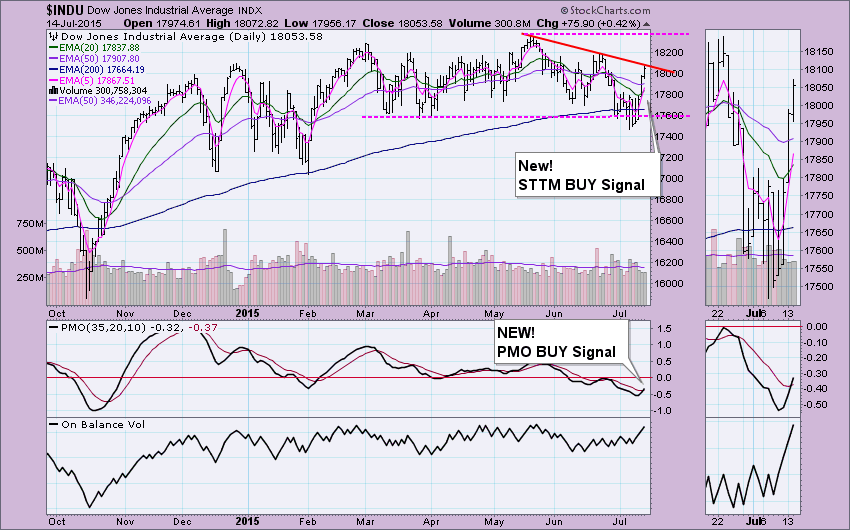
Summary: If you read today's DecisionPoint Alert, you'll know that our market indicators suggest more upside in the short term, but it isn't as bullish in the intermediate term, so new highs are certainly possible, but we really need to get confirming Intermediate-Term Trend Model (ITTM) BUY signals on these indexes. That will occur when the 20-EMA crosses back above the 50-EMA.
Technical Analysis is a windsock, not a crystal ball.
Happy Charting!
- Erin

