While scanning my charts for my DecisionPoint Alert daily market review, I happened on the S&P 500 Price Momentum Oscillator (PMO) Analysis chart. It didn't look as I would've expected. This prompted me to review the same PMO Analysis charts for other indexes to see what they were saying. Across the board I found them unusual considering the strong rally we have experienced since the last bear market low.
Of course we have been watching and seeing many divergences in our indicators throughout this recalcitrant rally. As I wrote in the DecisionPoint Alert yesterday, at this point given the length and size of this rally, it is time for an exhaustion whether this is a bear market or a bull market start-up. Until the 50-EMA crosses back above the 200-EMA, the DecisionPoint Long-Term Trend Models are on SELL signals, which means DecisionPoint considers these indexes in "bear markets". The margin is getting very thin between the 50/200-EMAs which would switch our long-term posture to bullish.
The four charts of the major indexes covered in the DecisionPoint Chart Gallery show that of all stocks within an index, what percentage have a rising PMO (short-term bullish), what percentage are on PMO crossover BUY signals (intermediate-term bullish), and what percentage have positive PMO readings (long-term bullish). Notice in all but the Nasdaq 100 chart, this is trending lower. The divergence is stark. Even on the NDX, the percentage has basically stayed the same. How is it that so many stocks are losing momentum during this rally? Probably answer is only a handful of very large caps are directing the rally. Everyone else is plodding along.
Next, the amount of stocks with crossover BUY signals has been drifting lower as well.
Finally, in the longer term, we see that the rally has at least moved and now kept stocks in positive territory. That result was not unexpected given the rally.
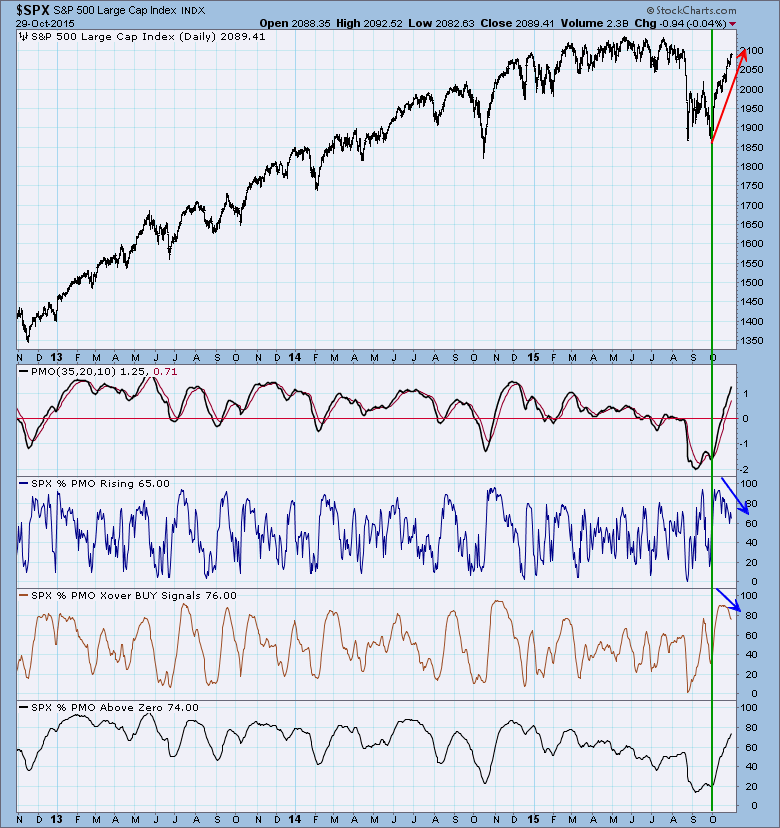
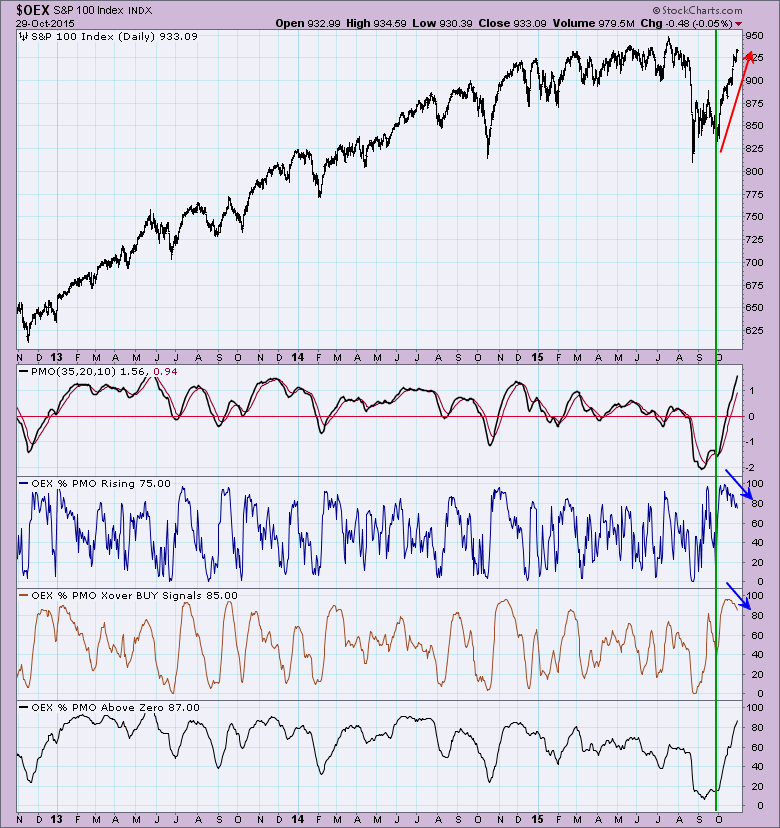
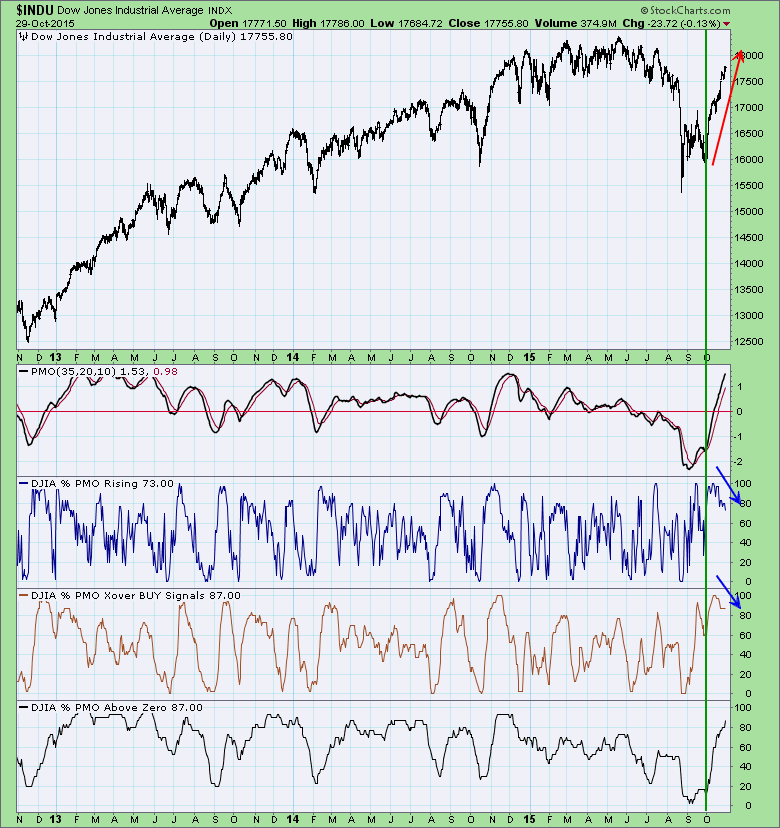
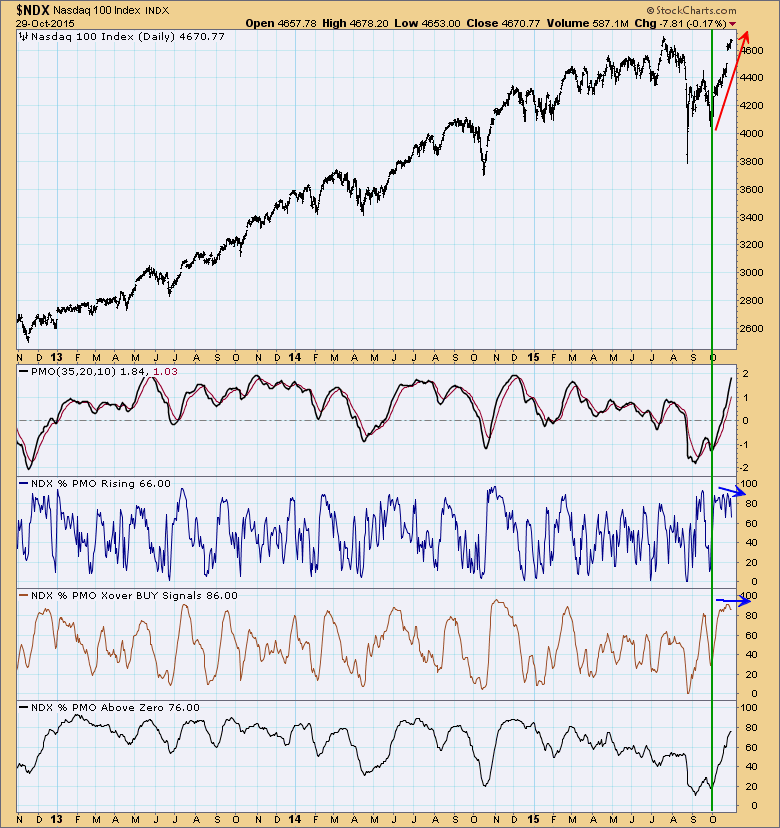
Conclusion: In the short and intermediate terms, PMO analysis suggests weakness that could be a set-up for a pullback or correction in the medium term. The positive reading in the longer term suggests a waning of the bear market. Given the location of the 50/200-EMAs on the three indexes that have Long-Term Trend Model SELL signals, there might be some green to add to the DP Scoreboards.
** Come and watch our free webinar, "The DecisionPoint Report with Erin Heim" on Wednesday’s and Friday’s at 7:00p EST. The archives and registration links are on the Homepage under “What’s New”. **
Technical Analysis is a windsock, not a crystal ball.
Happy Charting!
- Erin
