I received a question from a reader that I thought would make a great article:
"Can you explain if there is any significance to spike on the Total Assets Rydex Bear Index Funds chart?"
First, a quick refresher on the Rydex Asset Ratio. The Rydex Asset Ratio makes it possible for us to analyze sentiment based upon what investors are actually doing with real money. We do this by calculating a daily bear/bull asset ratio and monitoring the relationship between assets in the two types of funds. The idea behind using the Rydex Asset Ratio and other sentiment indicators is that we are trying to determine when investors have reached a saturation point of bullishness or bearishness. So, seeing a bearish spike or overbought conditions, sentiment would suggest that selling is reaching saturation.
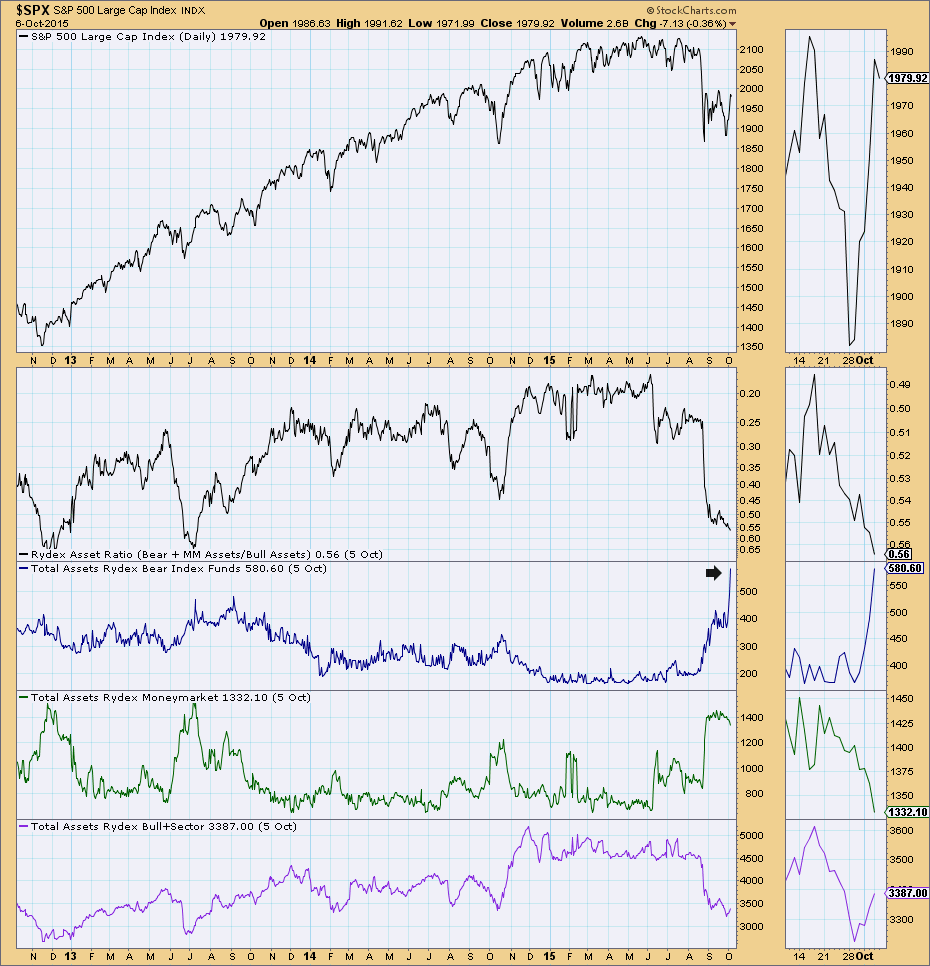
Let's look at the spike that he is referring to. It is from the DecisionPoint Chart Gallery under "Sentiment Charts". Clearly this is an overbought reading on this chart as far as the amount of dollars committed to the bear funds. However...
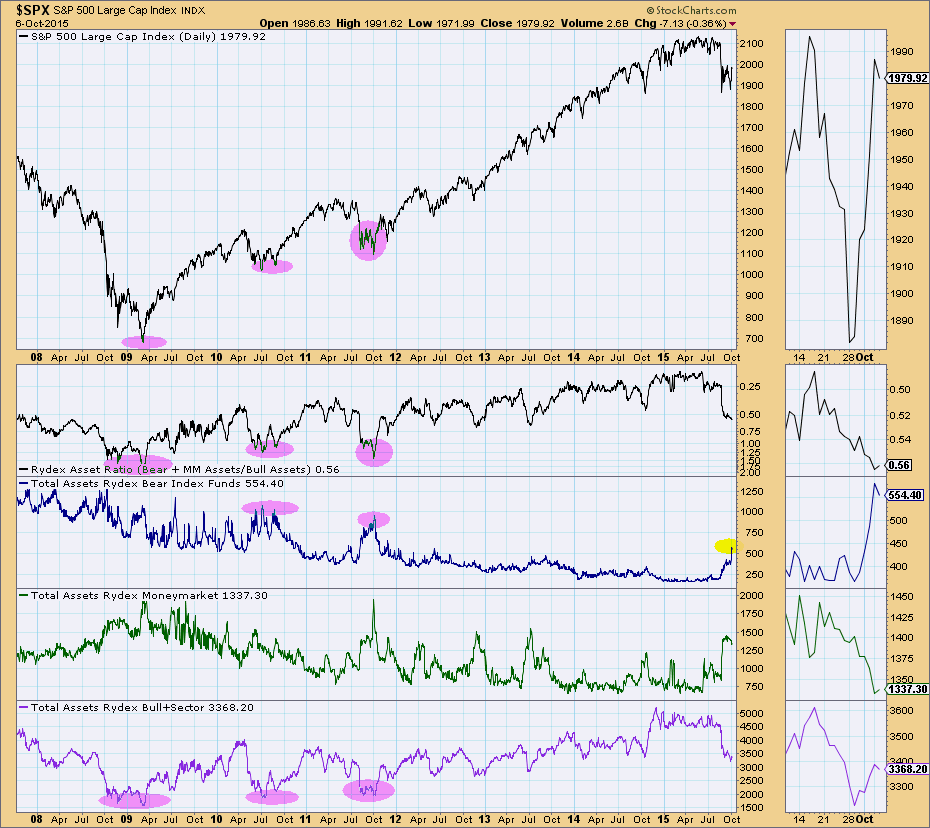
Put this on a 8-year chart and you can see that these numbers have been much higher. More telling is the Rydex Asset Ratio, it has a long way to go to reach oversold conditions similar to other major bottoms. Additionally assets could move higher in the bear funds. Finally, bulls are not completely gone as they were at previous bottoms. Both the bulls and the bears need to overcommit for us to be prime for a major reversal.
Sorry! I can't let go of this bear market yet. I highly recommend whenever you see a chart that uses oscillators or ratios that appear extremely overbought or oversold, you expand the time frame to see how overbought/oversold it really is. In conclusion, I think that the spike is indicative of hedging as the short-term rally took off. We haven't seen much drop off on the bull funds assets on this spike. The Rydex Ratio will be worth watching closely.
Technical Analysis is a windsock, not a crystal ball.
Happy Charting!
- Erin


