 The title "suggest more upside" refers to the short term, not the intermediate or long terms. We are still in a bear market, a genuine bear market, so we shouldn't expect bullish results. However, even within a bear market, there are rallies. The important thing to remember is that these rallies are there to relieve some pressure and only the last one will mean the end of the bear market. There will be plenty of signs in the indicators to reflect that the bear market is finishing, unfortunately the signs aren't there yet.
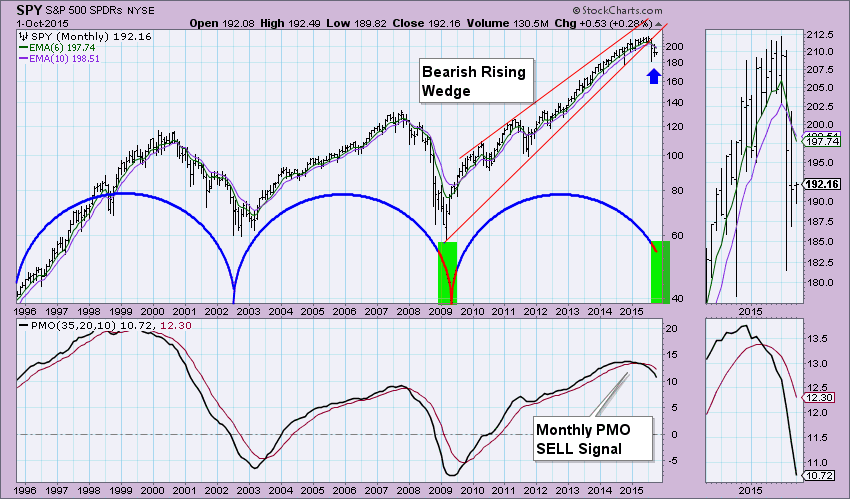
The monthly chart on the SPY is telling. It implies the bear market is on and is likely here to stay longer than the bulls would like. I've highlighted in light green approximately how long it would take for the current cycle to finish. That amount of time is months. Cycles rarely start and end right on time, but this chart illustrates that it could take weeks to months before the next trough appears. Not even taking the cycles out of the picture can make this a bullish chart. The 6-month EMA crossed below the 10-month EMA at the end of September. The monthly PMO crossover occurred right on time in overbought territory as with previous crossovers. The monthly PMO is far from oversold, more downside likely. It is very important to have this chart and the long term bearish bias in mind when we consider getting bullish results.
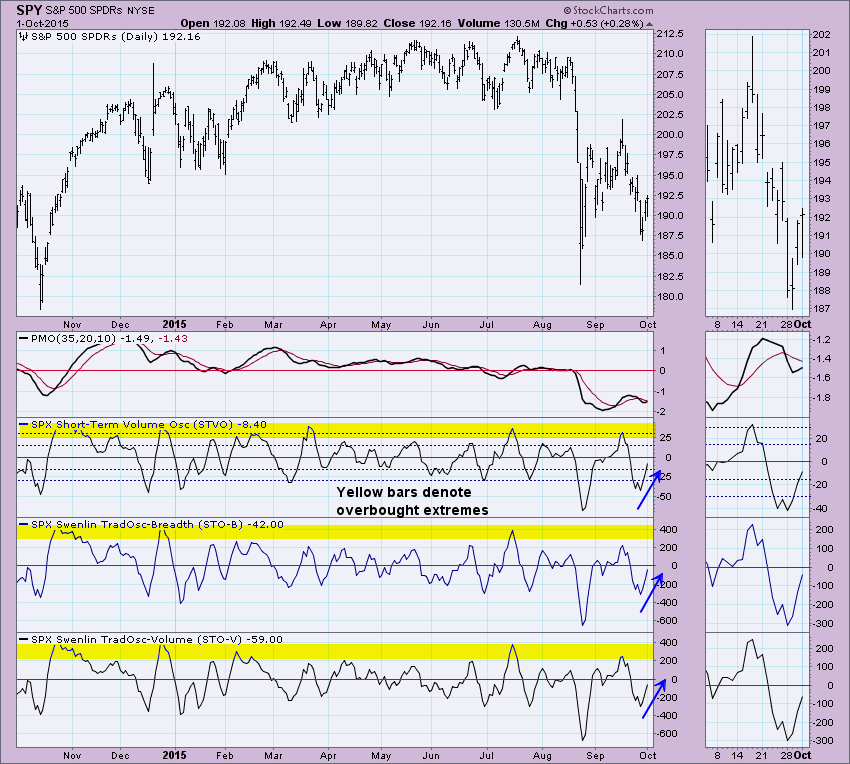
I've talked about the downside, but my title suggests there is some upside. The Swenlin Trading Oscillators (STOs) and the Short-Term Volume Oscillator (STVO) are rising bullishly. They have reached neutral territory, but have more room to move higher before reaching overbought extremes (yellow bars). The PMO which is a short- to medium-term indicator is rising and nearing a crossover BUY signal. All of this a short-term bullish.
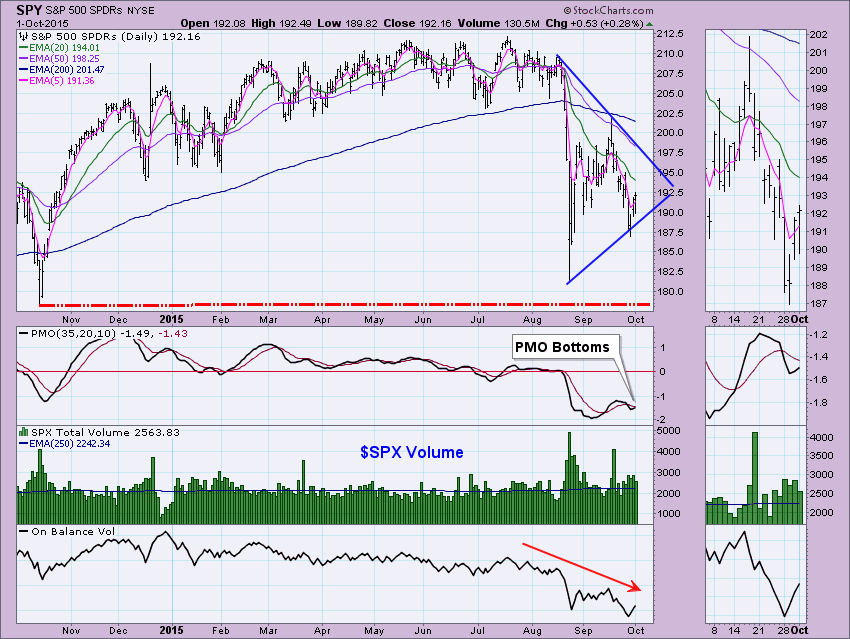
These indicators above do suggest more upside, but being short-term, I'd beware of joining in or at least be prepared for a bull trap. A move to the top of the symmetrical triangle around 196.00 on the SPY chart below is the most optimistic I can be regarding a short-term bear market rally.
You can find the STOs and STVO charts in the FREE DecisionPoint Chart Gallery for the $SPX. As a member, you can access the same indicator charts for the NDX, INDU and OEX using the drop down menu. If you haven't taken a walk through the DecisionPoint Chart Gallery and are a fan of DecisionPoint indicators, you must go check it out!
Technical Analysis is a windsock, not a crystal ball.
Happy Charting!
- Erin


