 If you don't think you have time to read blogs, I issue you a challenge: Read the members-only DecisionPoint Alert blog each day for one week. You can do this for free even if you aren't currently a paid member using the free 10-day trial or take advantage of the current Holiday Specials. I'll help you get started on your one-week challenge with my early Christmas present to you... a free preview of today's DecisionPoint Alert blog article.
Our veteran DecisionPoint.com subscribers are very familiar with this members-only blog as it was hatched over five years ago on that site and was the most popular reason given for subscribing. I know that many of you follow Carl and I in this free blog as well as in the free webinars (and we thank you!); however, you may not know what the paid DecisionPoint Alert blog is about and why you should read it daily. The DecisionPoint Alert is unique from all of the other blogs because it uses the same format and charts everyday for analysis. If that sounds monotonous, it is far from it. This is one of the best technical analysis learning tools available to you as a paying member of StockCharts.com because by seeing and reading analysis on the same charts daily for the SPY, the Dollar, Gold, Oil and Bonds, you learn how to interpret price movement, timing signals, patterns, indicators, what changes mean, what the readings mean, etc. After you finish your challenge, let me know how it went.
DecisionPoint Alert Daily Blog for 12/10/2015 - "It's Not Time, Santa"
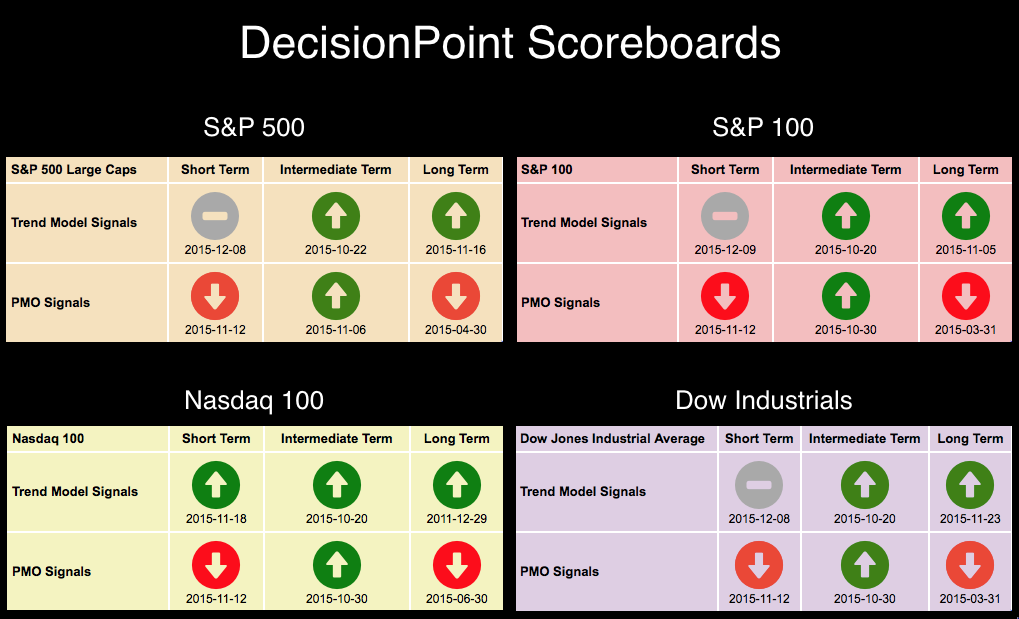
Well, the short-term indicators are with Santa right now (pending Santa Claus Rally), but the price charts really need some more pullback to at least test the November lows. The DP Scoreboards are showing a deterioration in the short-term trend and momentum is negative in the short term as well.
The purpose of the DecisionPoint Alert Daily Update is to quickly review the day's action, internal condition, and Trend Model status of the broad market (S&P 500), the nine SPDR Sectors, the U.S. Dollar, Gold, Crude Oil, and Bonds. To ensure that using this daily reference will be quick and painless, we are as brief as possible, and sometimes we let a chart speak for itself.
SIGNALS: Here we include the current day's signal table that summarizes our Intermediate-Term Trend Model signals, an excerpt from the DecisionPoint Market/Sector Summary Daily Report.
DECISIONPOINT MARKET/SECTOR SUMMARY DAILY REPORT
Thursday, 12/10/2015

************************ DECISIONPOINT MARKET POSTURE ***********************

The following is the market posture suggested by our mechanical trend-
following tools. These are not trading recommendations, rather they are price
activity flags that should be qualified by chart analysis. The Trend Model is
used on all indexes.


                                     Days   Index     12/10   Points  Percent
Index               Posture     Date Elap  @Start     Close      P/L      P/L
------------------- ------- -------- ---- -------   -------  -------  -------
Stocks Medium-Term  Bullish 10/21/15   50   201.87   205.87    +4.00    +2.0%
Gold (NY Spot)      Bearish 11/06/15   34  1087.70  1072.00   +15.70    +1.4%
20+Yr T-Bond  (TLT) Neutral 11/09/15   31   118.08   121.84     ....     ....
------------------- ------- -------- ---- -------   -------  -------  -------
Dollar Index  (UUP) Bullish 10/29/15   42    25.34    25.45    +0.11    +0.4%
Commodities   (GSG) Bearish 06/22/15  171    20.79    14.53    +6.26   +30.1%
Crude Oil     (USO) Bearish 07/06/15  157    17.73    11.37    +6.36   +35.9%
------------------- ------- -------- ---- -------   -------  -------  -------
S&P 500       (SPY)     BUY 10/21/15   50   201.87   205.87    +4.00    +2.0%
S&P Equal Wt  (RSP)     BUY 10/23/15   48    78.59    77.12    -1.47    -1.9%
Dow           (DIA)     BUY 10/19/15   52   171.56   175.88    +4.32    +2.5%
Nasdaq 100    (QQQ)     BUY 10/20/15   51   108.18   113.40    +5.22    +4.8%
NDX Equal Wt (QQEW)     BUY 10/23/15   48    43.80    43.83    +0.03    +0.1%
S&P 100       (OEF)     BUY 10/19/15   52    90.34    92.14    +1.80    +2.0%
S&P 400 MidCp (IJH)     BUY 10/30/15   41   144.21   141.19    -3.02    -2.1%
S&P 600 SmlCp (IJR)     BUY 10/26/15   45   112.87   111.72    -1.15    -1.0%
Total Market  (VTI)     BUY 10/22/15   49   105.21   105.31    +0.10    +0.1%
Consumer Disc (XLY)     BUY 10/12/15   59    78.09    79.88    +1.79    +2.3%
Cons Disc EWt (RCD) Neutral 12/07/15    3    87.55    86.54     ....     ....
Consumer Stpl (XLP)     BUY 10/09/15   62    49.46    50.03    +0.57    +1.2%
Cons Stpl EWt (RHS)     BUY 10/08/15   63   111.07   114.77    +3.70    +3.3%
Energy        (XLE)    SELL 12/04/15    6    64.70    62.81    +1.89    +2.9%
Energy EWt    (RYE)    SELL 11/12/15   28    52.93    48.85    +4.08    +7.7%
Financial     (XLF)     BUY 10/28/15   43    24.50    23.98    -0.52    -2.1%
Financial EWt (RYF)     BUY 10/23/15   48    43.91    43.36    -0.55    -1.3%
Health Care   (XLV)     BUY 11/04/15   36    72.28    71.35    -0.93    -1.3%
Health Cr EWt (RYH)     BUY 11/23/15   17   151.01   151.02    +0.01    +0.0%
Industrial    (XLI)     BUY 10/20/15   51    52.97    53.51    +0.54    +1.0%
Industrl EWt  (RGI)     BUY 10/26/15   45    85.06    83.38    -1.68    -2.0%
Materials     (XLB)     BUY 10/26/15   45    44.58    45.14    +0.56    +1.3%
Materials EWt (RTM)     BUY 10/29/15   42    79.95    78.31    -1.64    -2.1%
Technology    (XLK)     BUY 10/15/15   56    41.88    43.71    +1.83    +4.4%
Technolgy EWt (RYT)     BUY 10/15/15   56    91.06    93.60    +2.54    +2.8%
Utilities     (XLU) Neutral 11/17/15   23    42.48    41.91     ....     ....
Utilities EWt (RYU) Neutral 11/27/15   13    71.64    70.50     ....     ....

Average                                42                               +1.0%
NOTE: Mechanical trading model signals define the implied bias of the price index based upon moving average relationships, but they do not necessarily call for a specific action. They are information flags that should prompt chart review. Further, they do not call for continuous buying or selling during the life of the signal. For example, a BUY signal will probably return the best results if action is taken soon after the signal is generated. Additional opportunities for buying may be found as price zigzags higher, but the trader must look for optimum entry points. Conversely, exit points to preserve gains (or minimize losses) may be evident before t he model mechanically closes the signal.
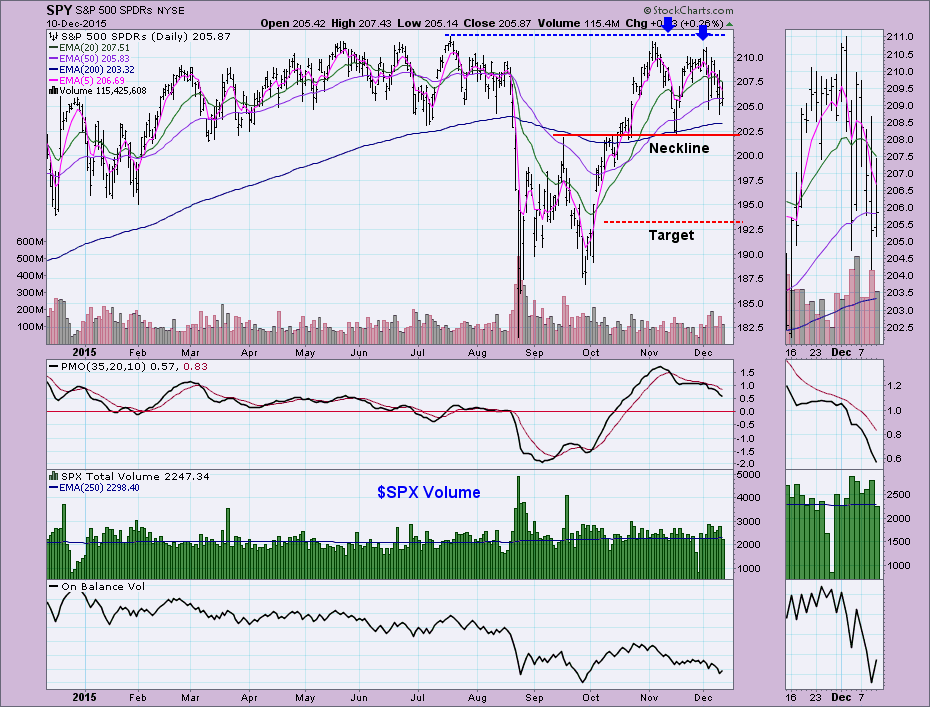
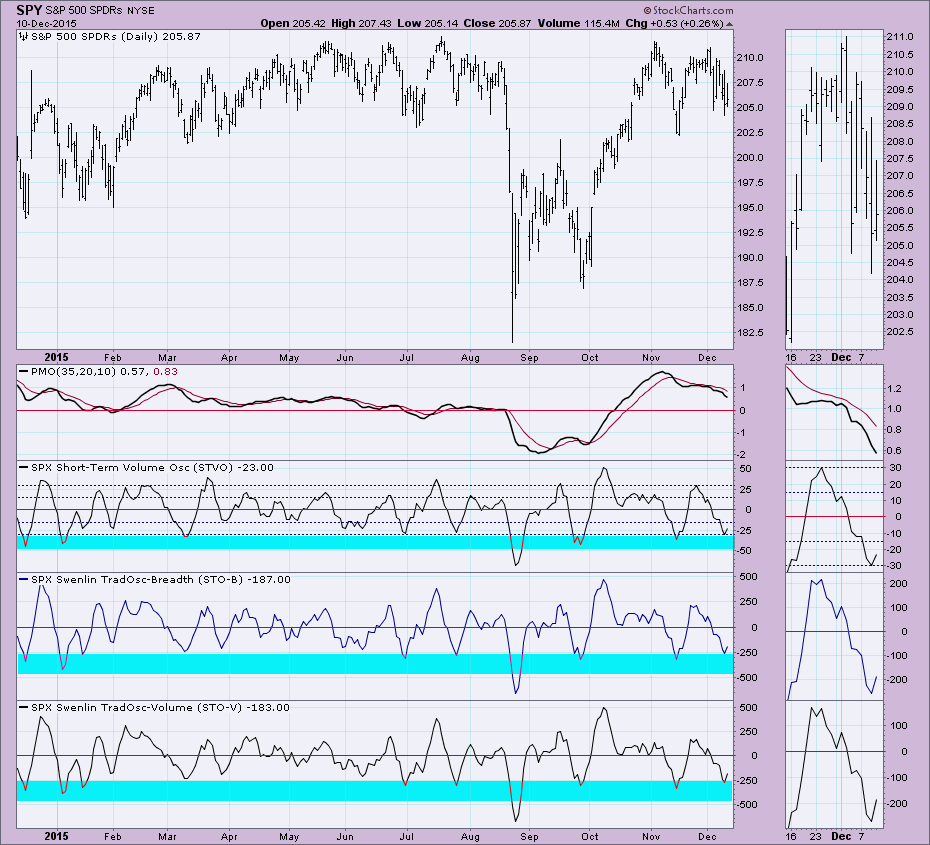
STOCKS: Based upon a 10/21/2015 Intermediate-Term Trend Model BUY signal, our current intermediate-term market posture for the S&P 500 (SPY) is bullish. The Long-Term Trend Model, which informs our long-term outlook, is on a BUY signal as of 11/3/2015 so our long-term posture is bullish.
As it happens often on the 10-minute bar chart, the reverse flag formation never executed. Instead price traded in the black nearly all day. Bulls did lose two battles to get price to close on the intraday highs and now you could make a case for a very short-term double-top. The minimum downside target would put price on yesterday's lows which is quite reasonable.
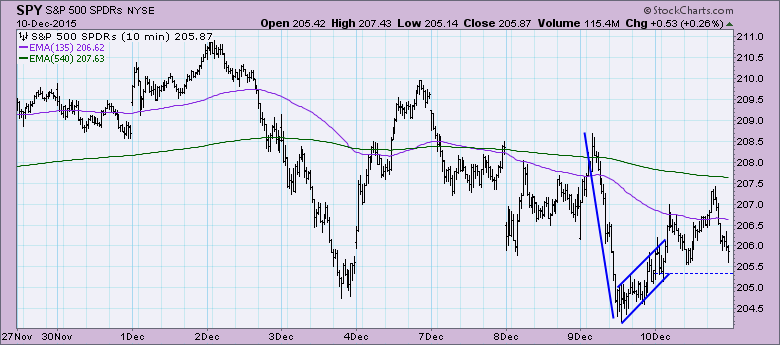
Intraday highs are continuing to form a steep declining tops line despite today's positive close. The PMO showed no signs of deceleration and volume was significantly lower on an 'up' day. Both suggest more decline.
Ultra-Short-Term Indicators: Yesterday's negative spikes concerned me as they arrived during a pullback which would suggest a selling exhaustion. Today's positive close could suggest higher prices, however, notice that while the Net A-Ds had positive readings, the CVI had a negative reading and Participation Index - DOWN was much greater than the Participation Index - UP. This seems a weak bounce.
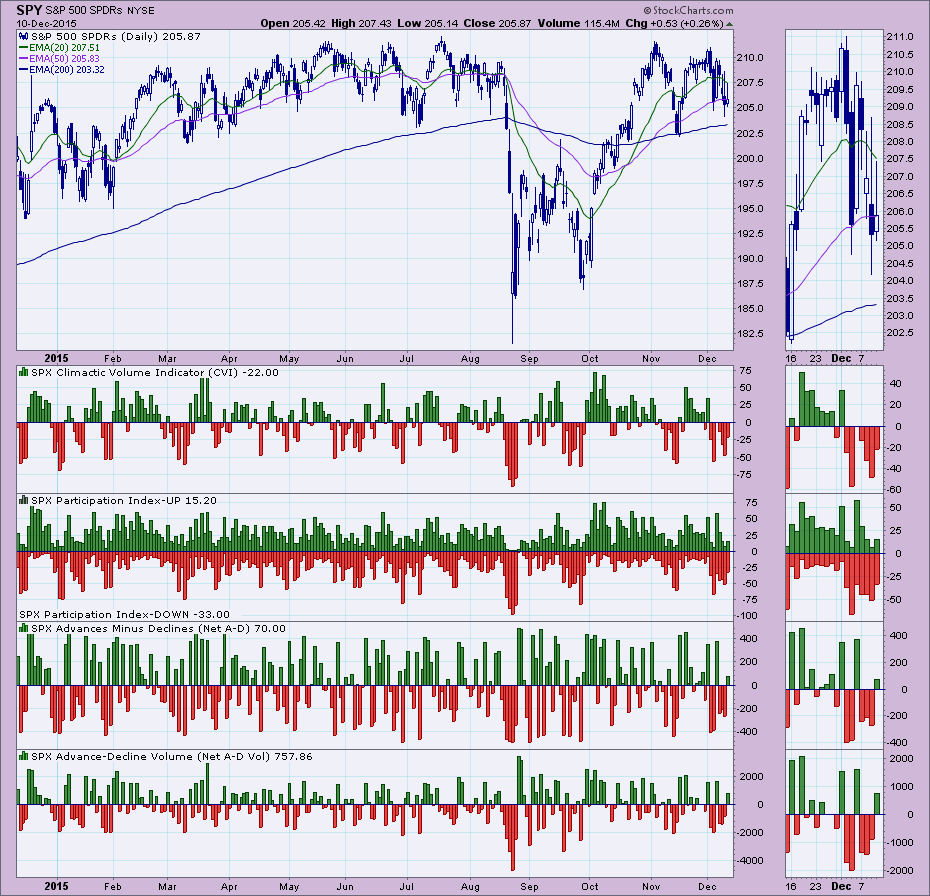
Short-Term Indicators: They all turned up in oversold territory which is very bullish for the short term. However, hold on to your reindeer, Santa. The readings were "ticks" up which can be quickly defeated by a solid price decline. I do believe it is still bullish, but I still expect more decline before a comeback rally.
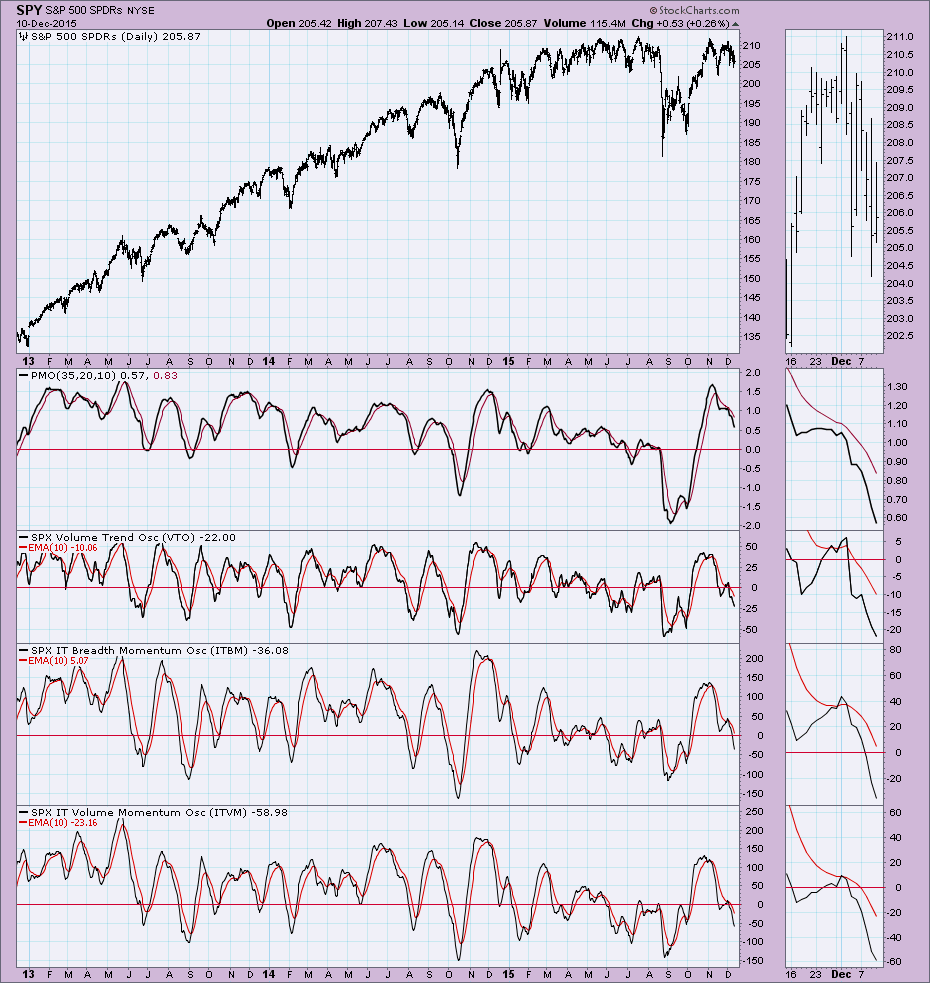
Intermediate-Term Indicators: How substantial would a short-term rally be? I suspect it would be more of a bounce with a return to lower prices. The intermediate-term indicators are very bearish, so Santa may bring a rally, but I would expect once he's back at the North Pole, prices will begin a longer-term price decline.
Conclusion: Santa, I know we are all looking forward to your return this year, but I think your rally would be much more effective if you let price decline at least to the November lows. The short-term indicators are definitely on your side, but ultimately once you leave the bulls their present, the bears can look forward to getting their present...a Bearish New Year.
**Don't miss the DecisionPoint Alert Daily Commentary! Click on "Email Updates" at the end of this blog page to be notified as soon as it's published at the end of the market day.**
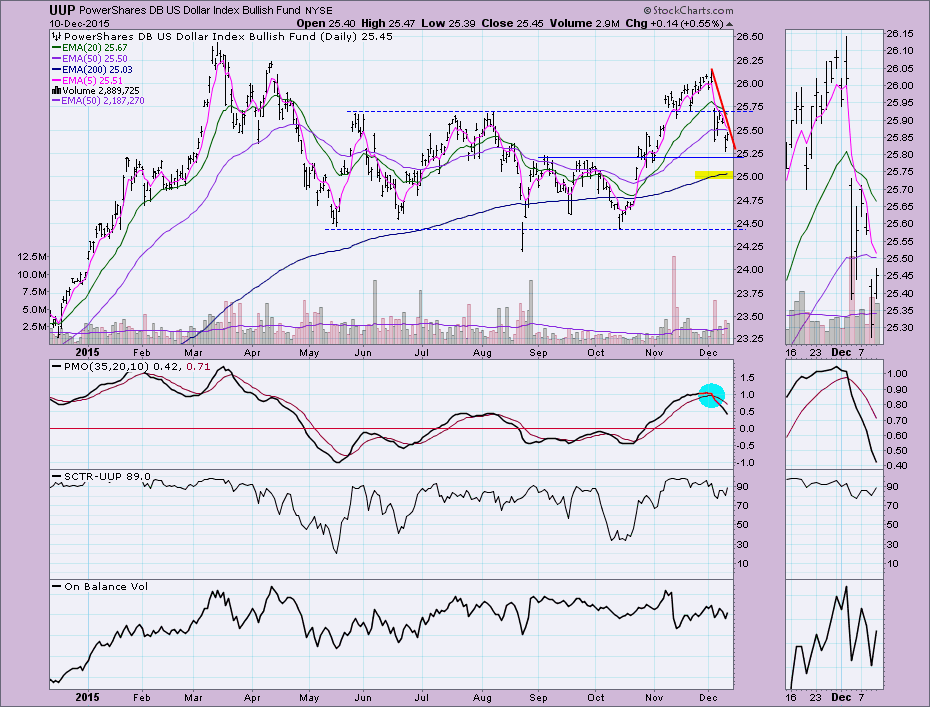
DOLLAR: As of 10/29/2015 the US Dollar Index ETF (UUP) is on an Intermediate-Term Trend Model BUY signal. The Long-Term Trend Model, which informs our long-term outlook, is on a BUY signal as of 8/21/2014, so our long-term posture is bullish.
The Dollar was up today, but it didn't improve the price pattern. The declining tops line is nearly vertical but price did successfully hold support at the September high. The very negative momentum as shown by the quickly declining PMO suggests to me that area of support will not hold. The next possible stop might be at the 200-EMA.
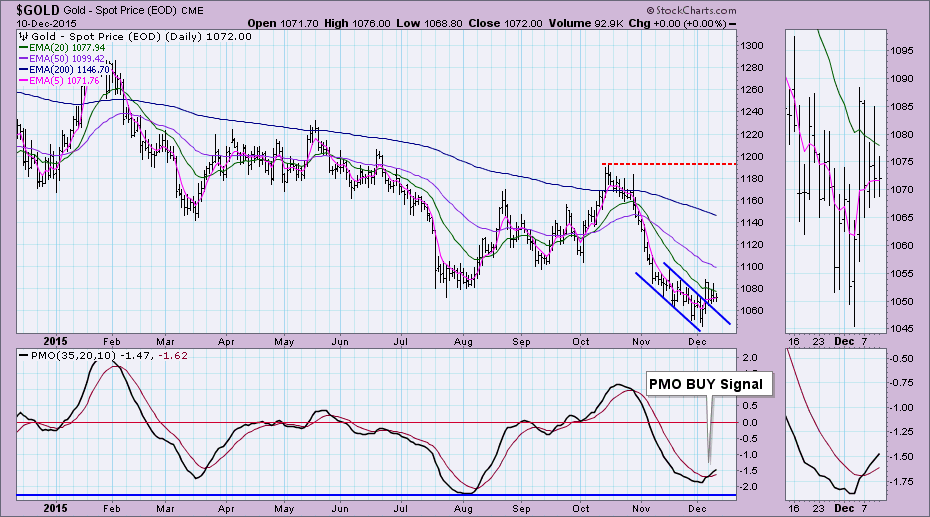
GOLD: As of 11/6/2015 Gold is on an Intermediate-Term Trend Model SELL signal. The Long-Term Trend Model, which informs our long-term outlook, is on a SELL signal as of 2/15/2013, so our long-term posture is bearish.
Gold is holding its own. While there was no change in price on Gold today, the Dollar was up over a half percent which would normally put pressure on Gold prices so the fact it didn't close lower is actually a positive. The PMO is configured very bullishly. Of concern would be the flattening 5-EMA. It was headed for a positive crossover the 20-EMA and now it has halted.
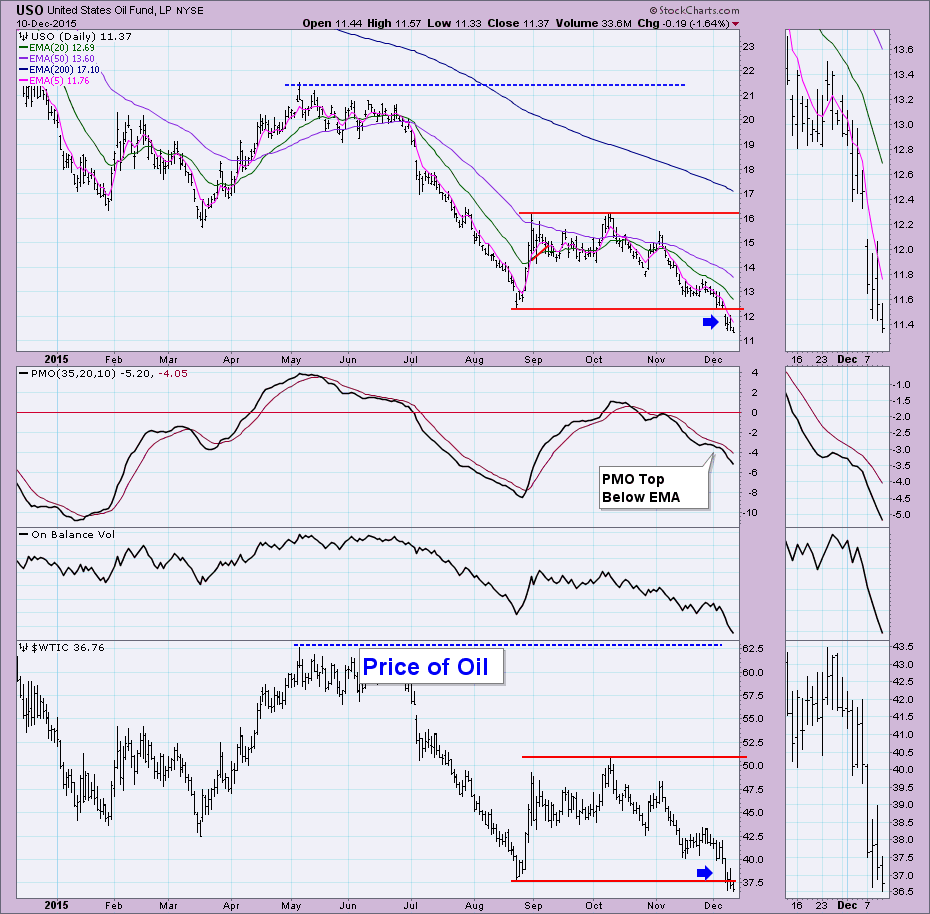
CRUDE OIL (USO): As of 7/6/2015 United States Oil Fund (USO) is on an Intermediate-Term Trend Model SELL signal. The Long-Term Trend Model, which informs our long-term outlook, is on a SELL signal as of 8/28/2014, so our long-term posture is bearish.
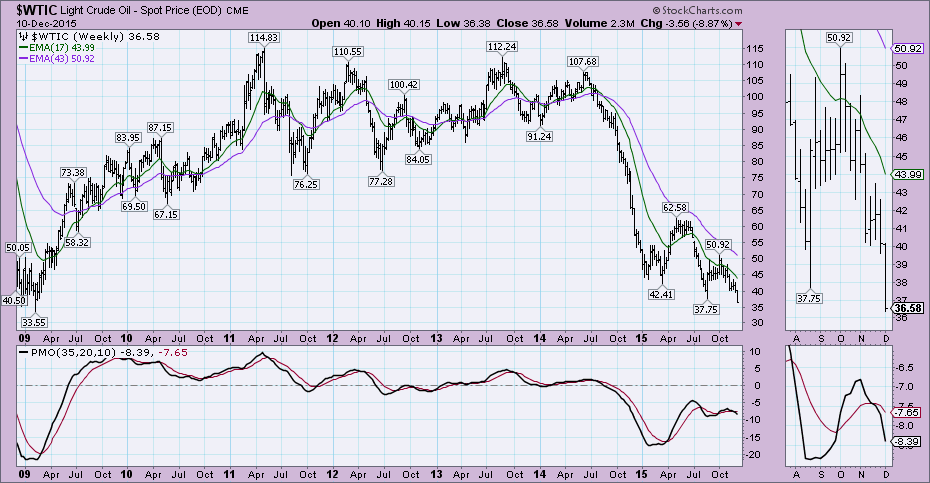
Could it get any worse for USO? Probably. Today the price of Oil closed and traded below the August low. If this breakdown continues, you have to look at the weekly chart to find the next area of support. which is $33.55/barrel. USO is along for the ride, logging new all-time lows as it travels alongside.
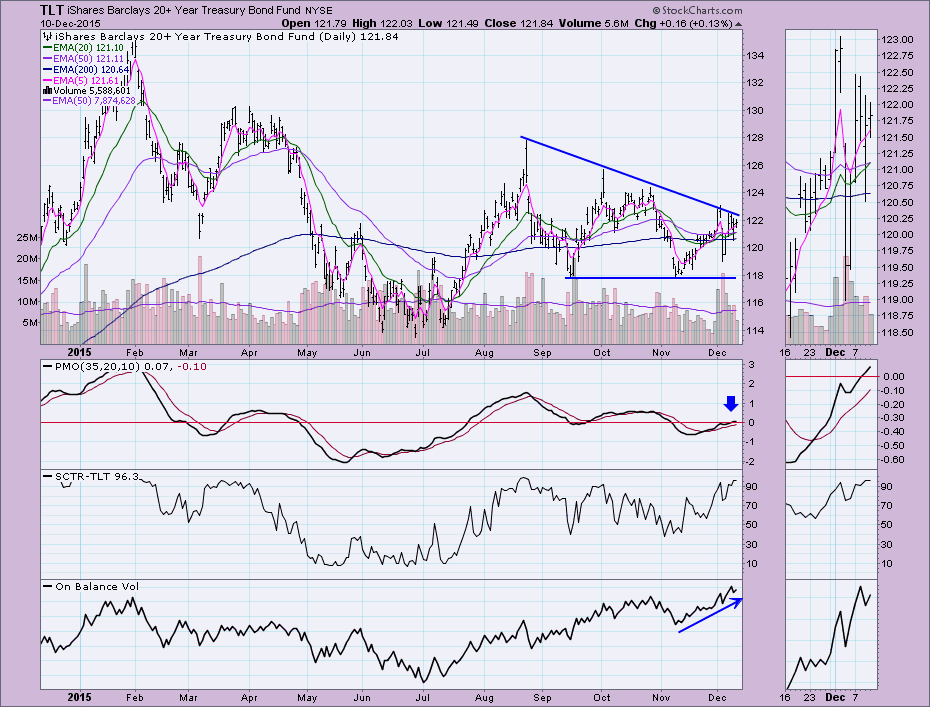
BONDS (TLT): As of 11/9/2015 The 20+ Year T-Bonds ETF (TLT) is on an Intermediate-Term Trend Model Neutral signal. The Long-Term Trend Model, which informs our long-term outlook, is on a BUY signal as of 8/14/2015, so our long-term posture is bullish.
Indicators for Bonds are very bullish, but the price pattern is not. I believe in my indicators over the bearish descending triangle pattern. We need to see a breakout above the declining tops line to confirm what the indicators are hinting at.
Come check out the DecisionPoint Report with Erin Heim on Wednesday’s and Friday’s at 7:00p EST. The archives and registration links are on the Homepage under “What’s New”.
Technical Analysis is a windsock, not a crystal ball.
Happy Charting!
- Erin


