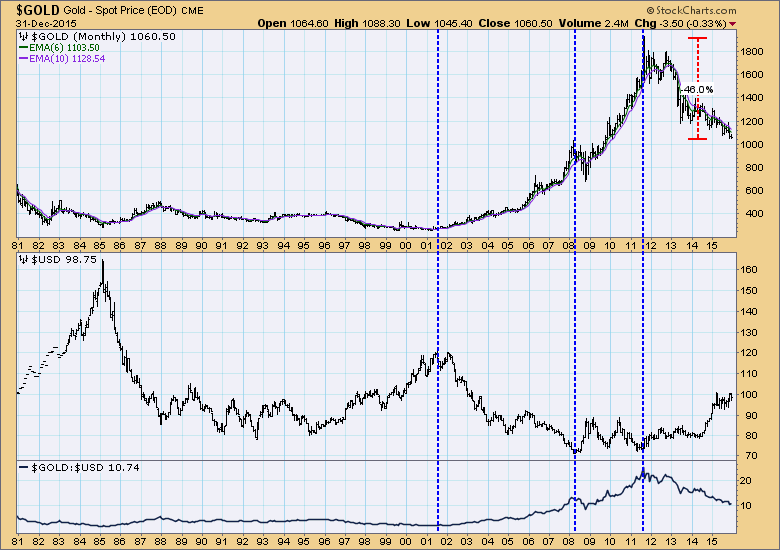
There is an inverse relationship between gold and the dollar, but it is far from exact. A weak or strong dollar will influence the price of gold in the opposite direction, but gold can also have internal strength or weakness that is a reflection of the fluctuating demand for gold.

On the chart above we can see that the relative strength line in the bottom panel was relatively flat between 1981 and 2001. Then between 2001 and 2008, in spite of the declining dollar, the relative strength line made a steady rise that reflected the increasing demand for gold. From 2008 and 2011 relative strength made an even steeper rise, the result of extremely bullish investor sentiment, that resulted in the final thrust of gold to its all-time high. Since the 2011 top, gold has declined almost -50%, and relative strength shows that sentiment for gold has become extremely bearish, meaning that the dollar's strength is only part of the reason for gold's decline.
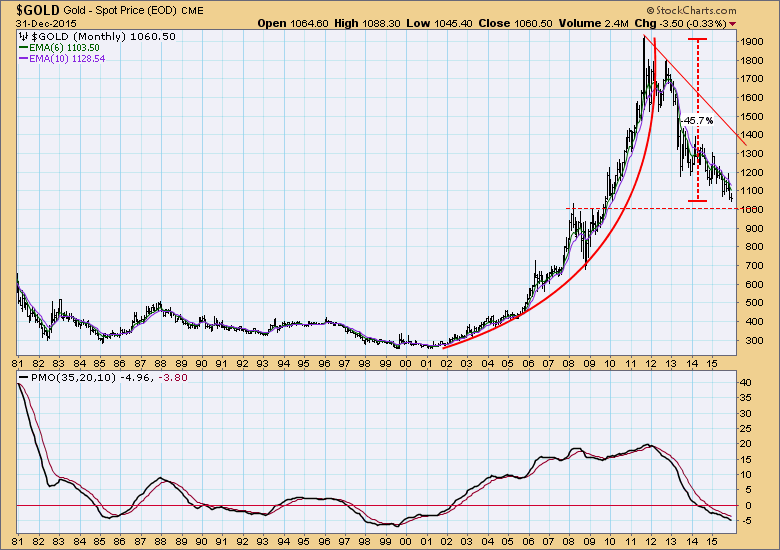
The monthly chart of gold below shows the parabolic rise and subsequent breakdown. It is well to remember that parabolic rises are the result of a substantial amount of irrationality having entered the market, and it usually comes to a bad end. With a nearly -50% decline, we can look for clues that maybe the gold bear market is close to ending. There is technical price support at 1,000, and the PMO is decelerating and has reached a level typical of bottoms over the last 35 years. Nevertheless, price and the PMO are still falling, and parabolic collapses often result in a price retreat back to the area of the basing pattern that preceded it. In this case, that would be somewhere between 250 and 500.

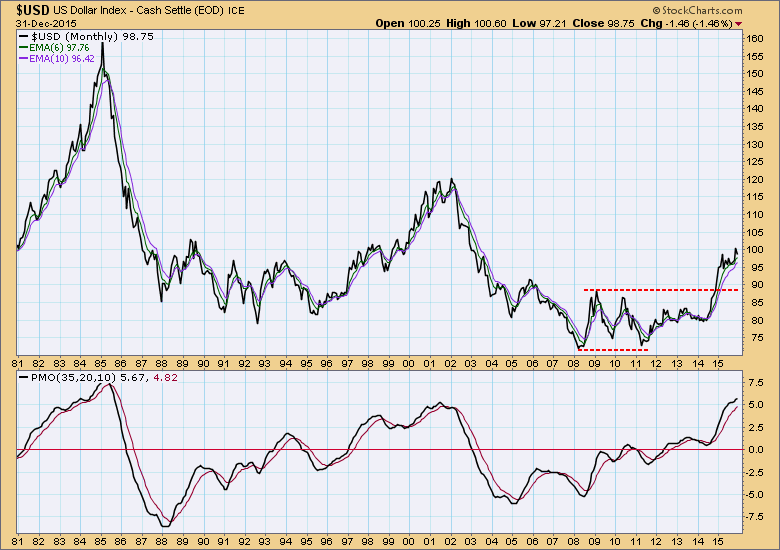
The monthly dollar chart shows the dollar in a rising trend, which of course works against the price of gold. The historical upside limits are well above current levels, but the monthly PMO is currently overbought and acting a little toppy. At this point I have to say that the chart is bullish.

CONCLUSION: The current long-term picture for gold is bearish, and it is demonstrating intrinsic weakness that goes beyond that caused by the persistently strong dollar. There is some evidence that gold could bottom around 1,000, but I wouldn't turn long-term bullish until actual evidence of a bottom materializes.
Technical analysis is a windsock, not a crystal ball.
