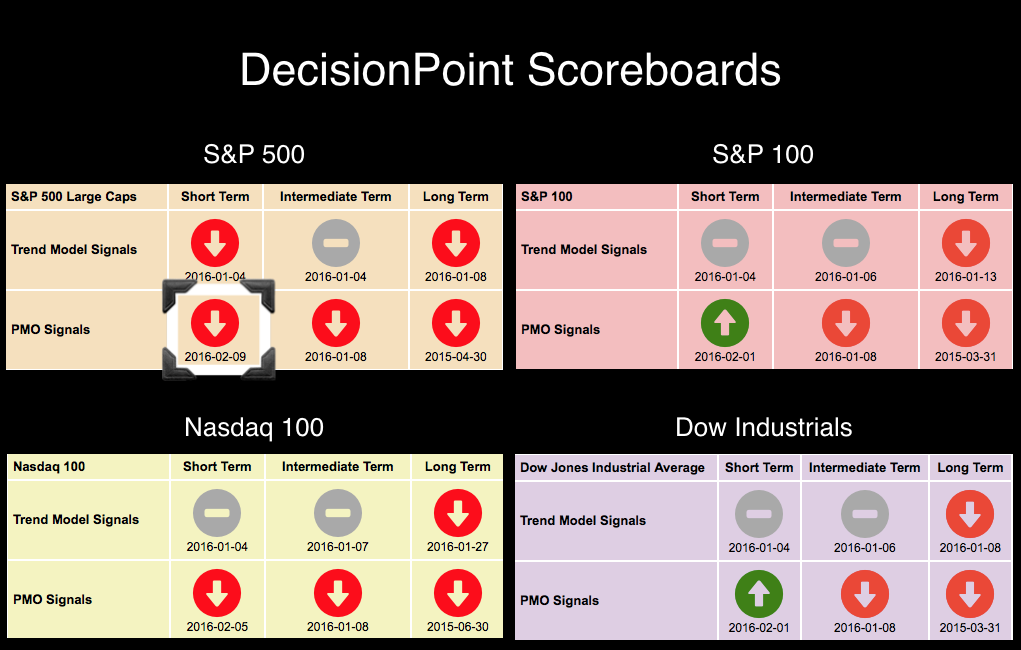
The first hint that the bear market rally was exhausted was when the Nasdaq 100, which had been strongest during the bear market, switched before the other indexes to a PMO SELL signal. Today, the SPX lost its BUY signal and joined the NDX with a new Price Momentum Oscillator (PMO) SELL signal. We will look at all of the indexes in the DecisionPoint Chart Gallery. (For a more detailed look and live analysis, catch The DecisionPoint Report FREE webinars on Wednesday/Friday at 7:00pm EST or you'll find them in the webinar archive.)
Below are the current DecisionPoint Chart Gallery Scoreboards. The NDX PMO BUY signal failed early and today, the S&P 500 moved to a SELL signal. The other indexes won't be far behind.
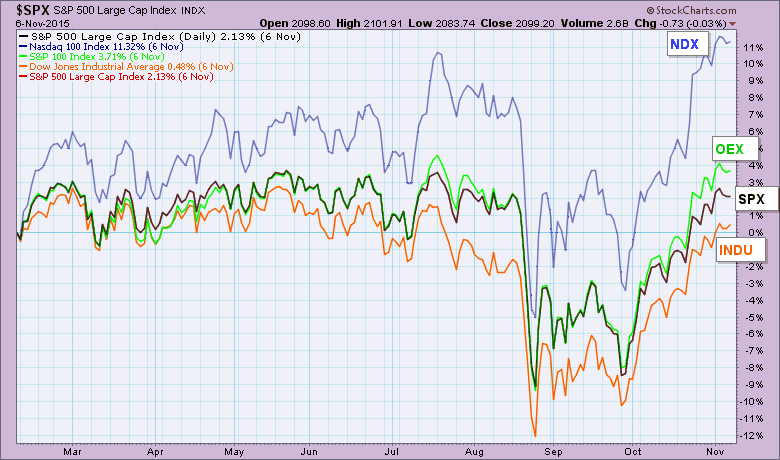
Let's use Price Performance charts to compare the NDX price action to the other indexes over the past year. The chart below is the first nine months of the last year. The NDX was a clear leader of the pack with the Dow Industrials lagging.
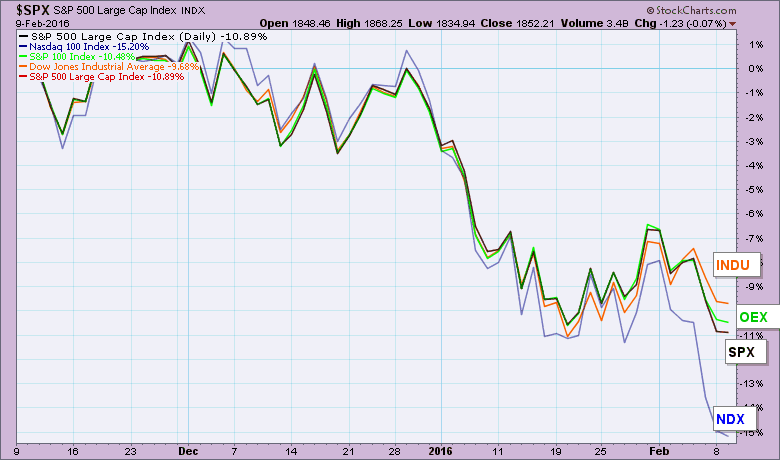
 The tables have changed this last three months with the NDX suffering far more than the other indexes have. (To learn how to create your own price performance chart, click on the chart below to review the settings.)
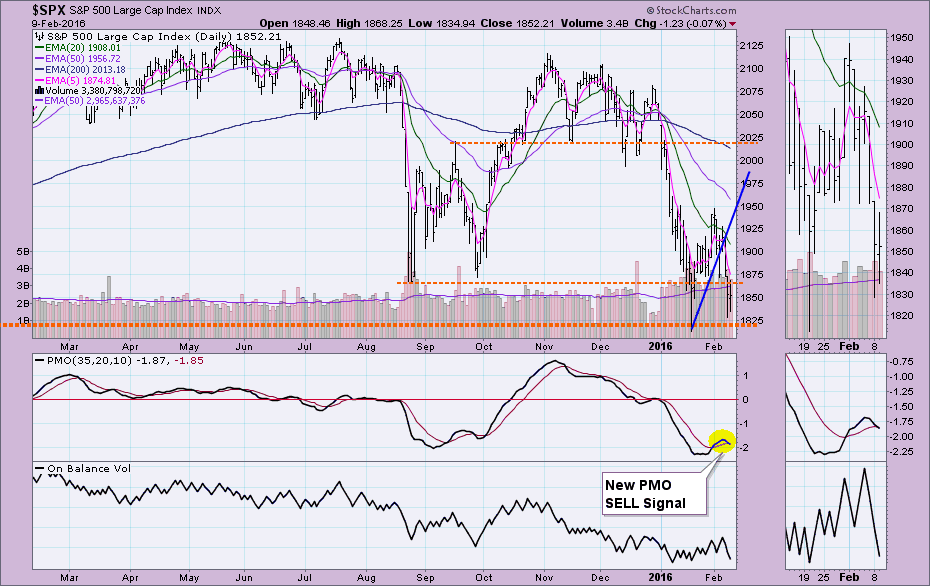
I have included the daily charts for the four DecisionPoint Chart Gallery indexes. I want you to compare the PMOs and support levels.
The daily chart for the SPX shows that some margin was gained before the PMO topped which is why it came in later than the NDX. Note that the October 2014 low is being approached again.
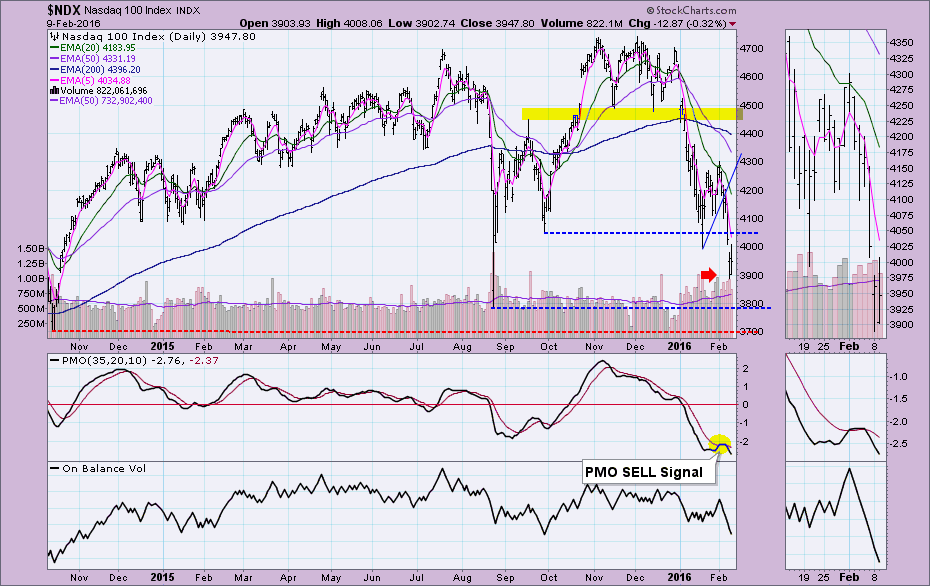
The NDX shows that the original PMO BUY signal was short-lived as positive momentum couldn't push the PMO further above its signal line. Momentum was in trouble almost as soon as the PMO BUY signal came in. The NDX is nearing its August low, but the October 2014 is further down around 3700. That support level is where I would look for a possible reversal to a bear market rally. Right now, more downside is likely.
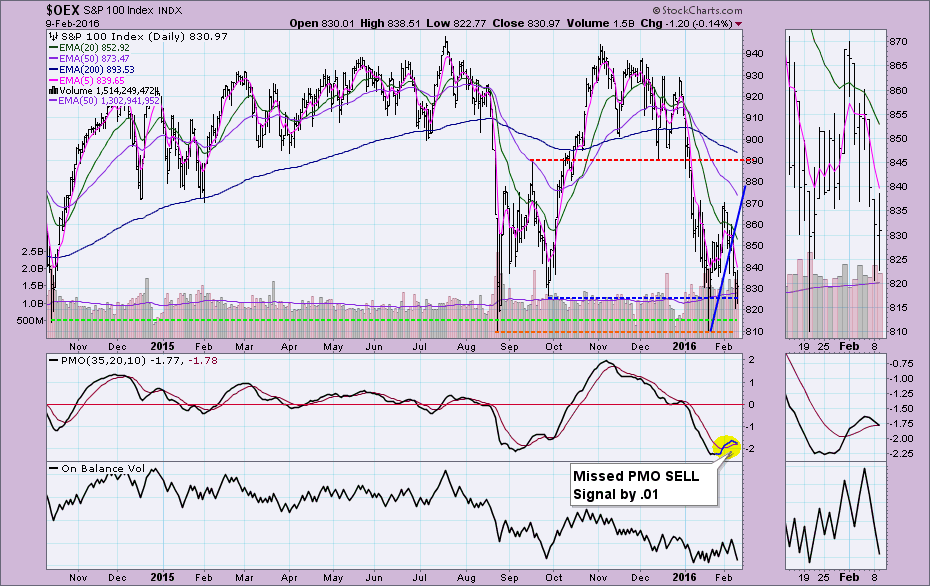
The OEX just missed a PMO SELL signal by only .01. This PMO BUY signal should disappear on tomorrow's Scoreboard. Like the SPX it has already tested its October 2014 low and is now approaching a retest.
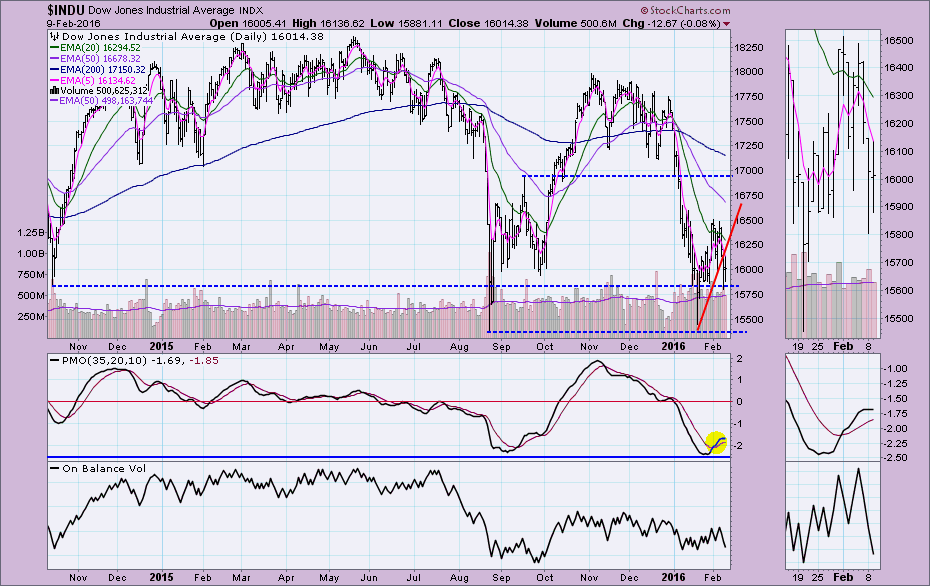
Interestingly, the Dow Industrials technically have a rising PMO. It rose three days ago and the last two days the value has stayed the same. This isn't surprising when you look at the price performance chart for the last three months. Support at the October 2014 low was broken in January, but it is so far holding. Given the internal weakness of the market in general, I would expect a test of support at the August 2015 low.
Conclusion: The NDX was the high performer the majority of the prior year; however, the last three months, the Dow Industrials moved from weakest to strongest and the NDX moved from strongest to weakest. Overall momentum is negative except for the INDU, but I expect that will change shortly and all four of the DecisionPoint Chart Gallery indexes will have PMO SELL signals.
Come check out the DecisionPoint Report with Erin Heim on Wednesdays and Fridays at 7:00p EST. The archives and registration links are on the Homepage under “What’s New”.
Technical Analysis is a windsock, not a crystal ball.
Happy Charting!
- Erin


