 The reason for the cryptic title is that I bet Erin that I could write an article without using the word "Brexit." Doh! Whatever. The big event next week (Thursday) is the British vote to leave or remain in the European Union. As to what the U.S. market might do ahead of the vote, I'm guessing that it could be somewhat boring/indecisive, rather like it often behaves ahead of Fed announcements. As for what might happen after the vote, I have to believe that current market condition will have a lot to do with that.
To determine market condition, let's look at another set of DecisionPoint indicators that will give us insight into three time frames, our PMO Analysis charts. The PMO (Price Momentum Oscillator) is our most commonly used indicator, and we normally display it immediately below the price chart. (See below) We also do an aggregate analysis of the PMOs for each stock in the S&P 500 Index, the results of which are displayed in the bottom three panels on the chart below.
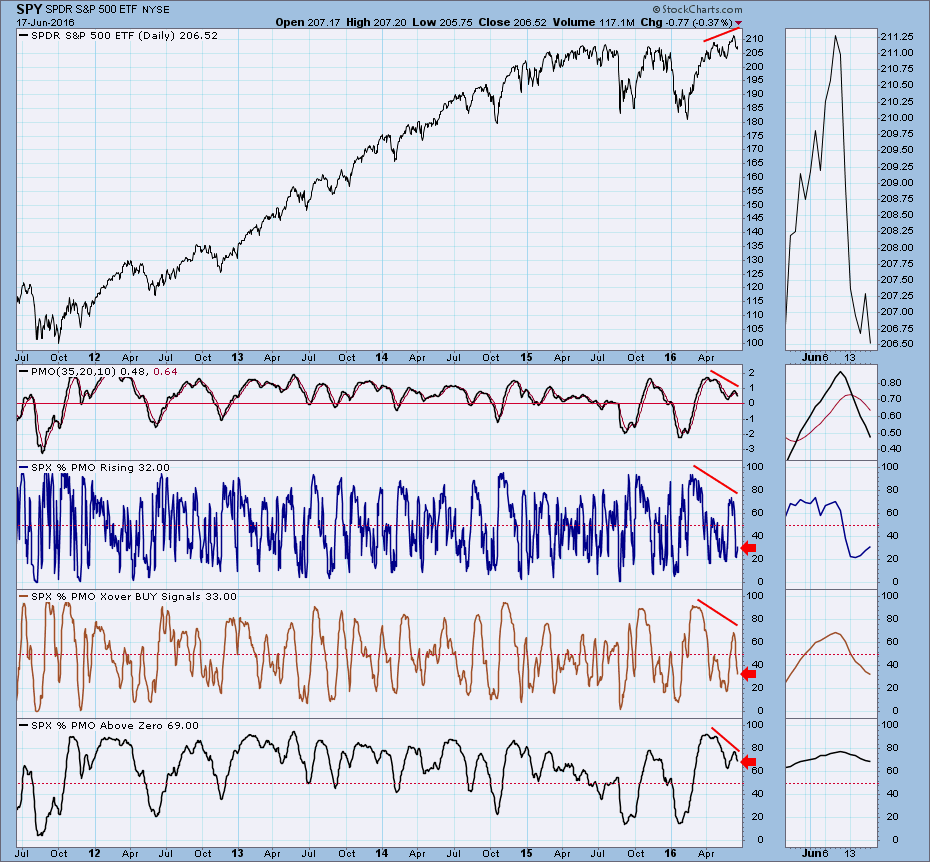
First, note that all the indicators have formed negative divergences, with lower tops compared to the higher price top. This condition often appears ahead of significant corrections.
The Percentage of PMOs Rising chart addresses the shortest time frame. It has turned up from moderately oversold levels, and it favors a short price bounce.
The Percentage of PMO BUY Signals chart addresses the middle time frame for stocks whose PMOs have crossed up through their signal lines. With a reading of 33% it is somewhat oversold, but it is still falling and will accommodate still lower prices before it is fully oversold.
The Percentage of PMOs Above Zero chart gives us the longest view in this indicator set. With a reading of 69% it is still in the overbought side of the range. It is falling and has plenty of room to correct downward, a condition that favors lower prices in this time frame.
CONCLUSION: For the most part, the indicators point toward lower prices. Negative divergences are unanimous, and longer-term the market is still overbought. This will be a drag on the market, if the reaction of the Brexit vote is positive, and it will exacerbate a decline if the reaction is negative.
Technical analysis is a windsock, not a crystal ball.


