I tend to give monthly PMO direction changes heavier weight in my analysis because they often foreshadow long-term changes in the price trend. About two weeks ago the monthly PMO turned up, but monthly readings are not final until the end of the month, so I have been breathlessly watching the monthly PMO to see if the upturn would survive until today's close. (Okay, not 'breathlessly,' but with interest.) As you can see on the thumbnail, the upturn is official.
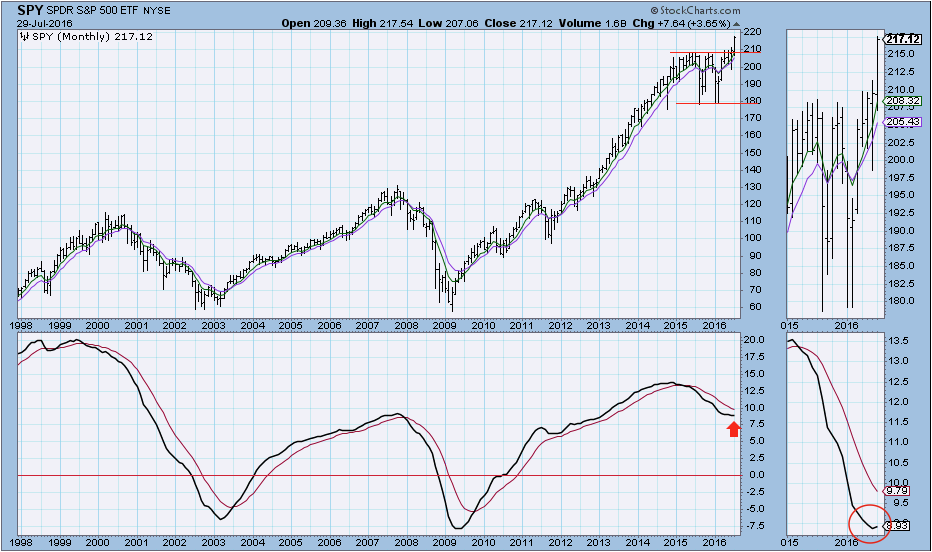
I normally assume that the price trend will follow the PMO trend, but the PMO top at the end of 2014 preceded an extended sideways move instead. This consolidation ended with an upside breakout in July. If there is any doubt about the viability of the breakout, the confirming monthly PMO bottom should serve to relieve some of that doubt.
One thing that concerns me is that this PMO bottom has formed in overbought territory, which does not generate the kind of high confidence we get from oversold PMO bottoms like the ones in 2003 and 2009. Is it possible that a PMO bottom this high in the range can precede a sizable price rally? For the answer to that we need to look at a lot longer time frame than the nearly 20 years shown on the chart above. Unfortunately, that chart displays nearly the available data for SPY, so the next best thing would be a chart of $SPX, which goes back to the 1920s.
Looking back nearly 90 years we can see a large variety of market conditions and PMO curves, but we don't have to go back that far, 1995, to see a PMO bottom at a level similar to the current bottom. That event coincided with the beginning of the huge rally up to the major top in 2000. I do not mean to imply that we'll see a similar advance this time, but it is not out of the question.
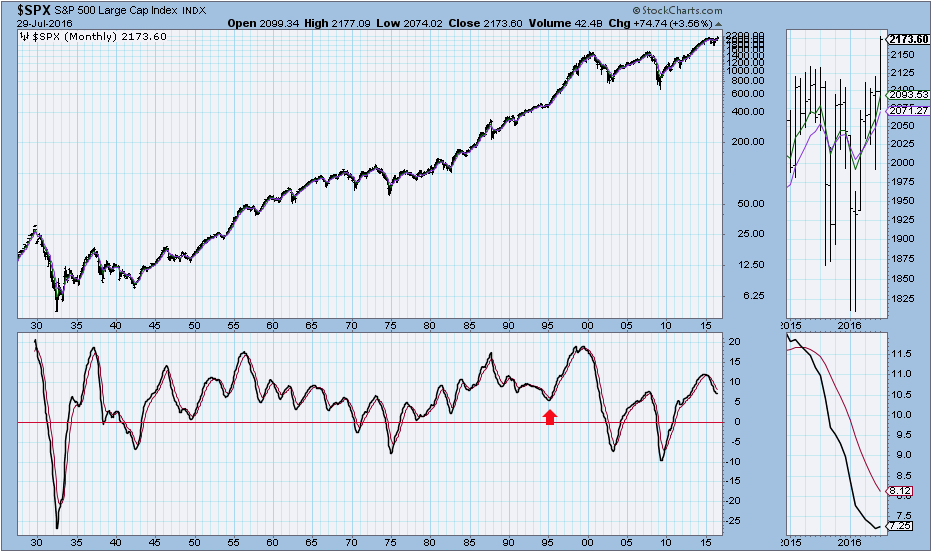
When we have the opportunity to view this much market history, it is worth taking some time to study it. For example, most of the PMO activity has taken place above the zero line. And there were only five deeply oversold PMO bottoms below minus five (-5).
CONCLUSION: Monthly PMO changes in direction give us forewarning of probable changes in the long-term price trend. The current monthly PMO bottom confirms the price breakout from a year-long consolidation, and provides additional evidence that a significant up leg is in progress.
Technical analysis is a windsock, not a crystal ball.


