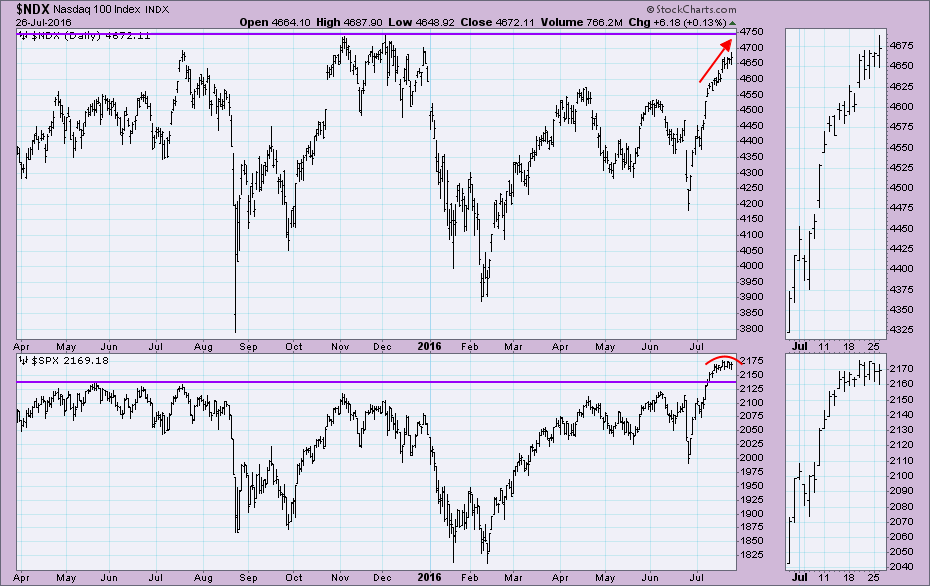
 The Nasdaq 100 has been running toward its all-time highs while the S&P 500 already surpassed its all-time high a few weeks ago. The SPX has been consolidating sideways and rounding ever since the breakout; whereas, the NDX continued to stretch upward. It's visible more clearly when comparing the thumbnails of the NDX and SPX.
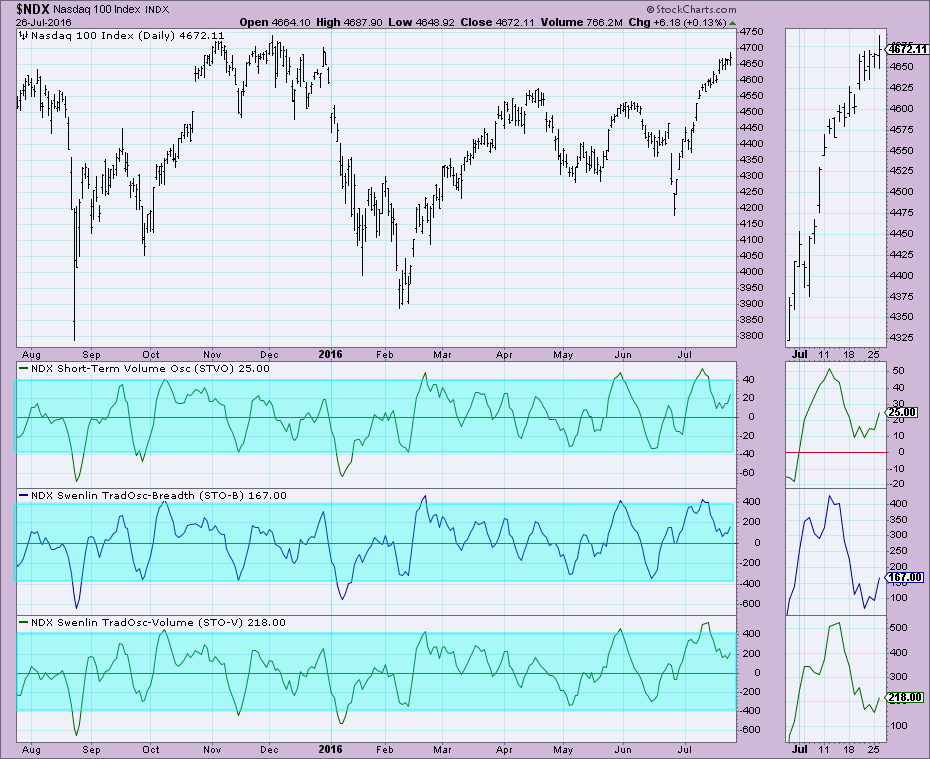
 I suspect that the NDX will reach its all-time highs. Our primary short-term indicators, the Short-Term Volume Oscillator (STVO) and the Swenlin Trading Oscillators (STOs) have turned up above the zero line which indicates internal strength and they have room to move higher before reaching extreme readings again.
 However, DecisionPoint's primary intermediate-term indicators, the Volume Trend Oscillator (VTO), Intermediate-Term Breadth Momentum (ITBM) oscillator and Intermediate-Term Volume Momentum (ITVM) oscillator, suggest a pullback/correction at overhead resistance or at a minimum, consolidation. There are few items to point out on this chart. First, look at the Price Momentum Oscillator (PMO) tops from earlier this year and compare them to the price tops. It's a negative divergence which is bearish. Next, I have highlighted times when we saw readings move outside the 'normal' oscillator ranges. They preceded declines with one exception in the Summer of 2015. Are we looking at an exception to the rule again?
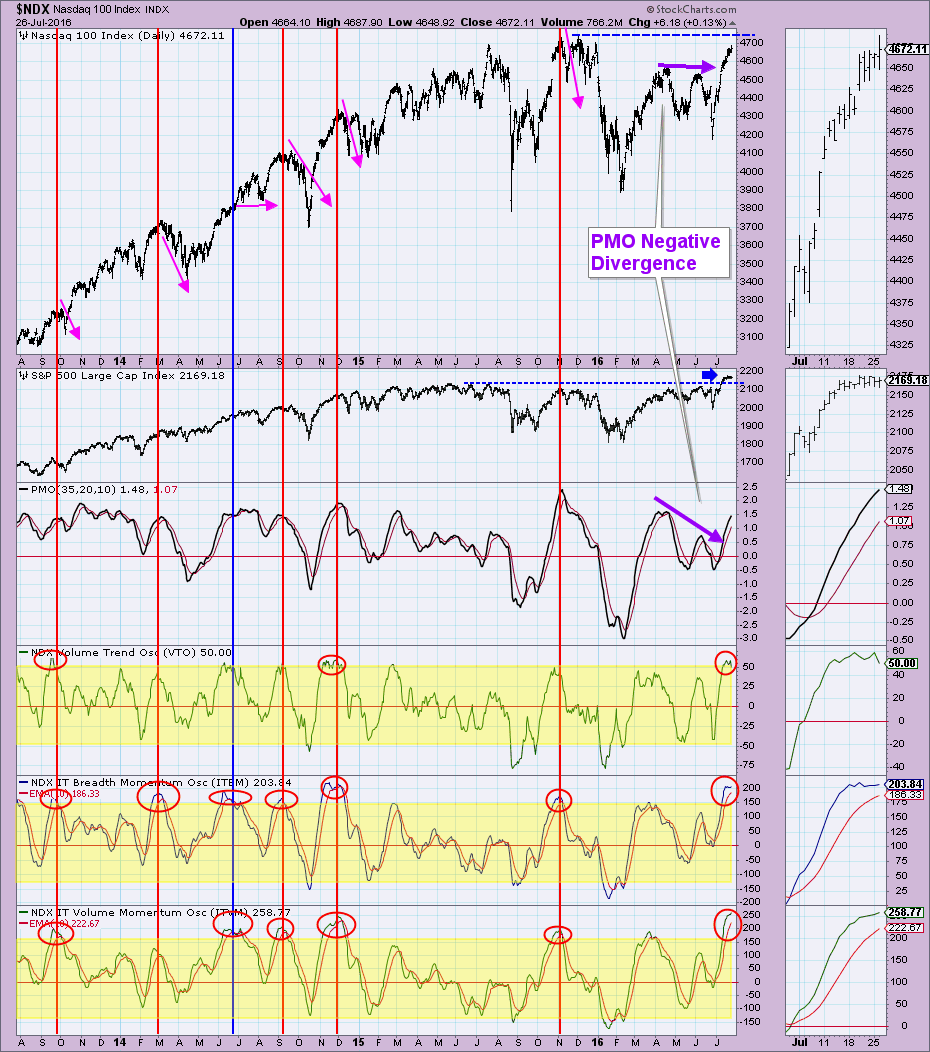 Conclusion: There is a very good chance that we are looking at another exception to the rule that overbought extremes on indicators precede lower prices. I base this on bull market bias (50-EMA > 200-EMA) and the strength of the short-term indicators and their oscillation beginning again above zero. I do suspect we will still see a short-term decline when the NDX reaches its all-time highs and those short-term indicators reach the top of their range.
Come check out the DecisionPoint Report with Erin Heim on Wednesdays and Fridays at 7:00p EST, a fast-paced 30-minute review of the current markets mid-week and week-end. The archives and registration links are on the Homepage under “What’s New”.
Technical Analysis is a windsock, not a crystal ball.
Happy Charting!
- Erin
