As we watch day-to-day market action, there is a tendency to focus on shorter-term indicators and to lose touch with the longer-term picture. With this in mind, I thought it would be a good idea to look at a trio of long-term indicators that tend to escape our immediate attention. The first is the 1% EMA of the Advance-Decline Ratio.
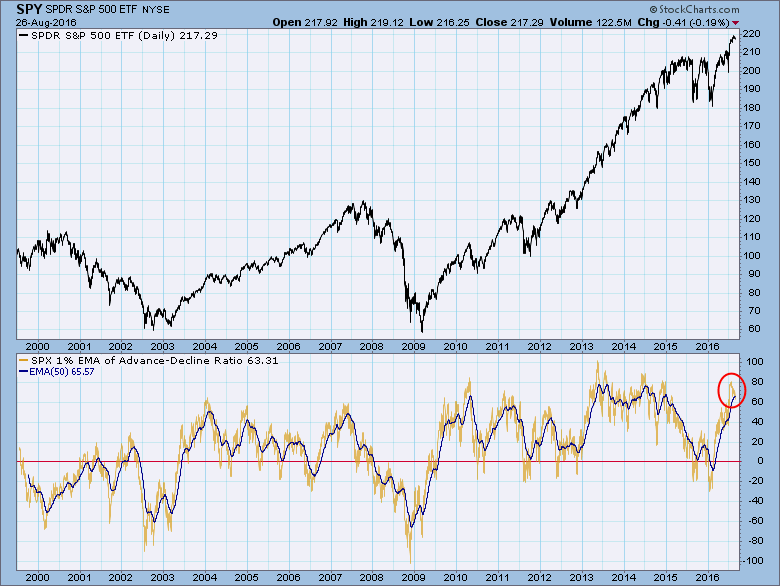
Without going into how it got that name, let me just say that it is actually a 200EMA of the Advance-Decline Ratio. That is the light brown index on the chart. Even with such a long-term EMA, it tends to be somewhat erratic, I long ago decided that a 50EMA (the overlaying black line) of it would be more useful. Zero line crossovers of the 50EMA generate long-term buy and sell signals, but I think that the more useful information is to identify overbought and oversold conditions when the 50EMA reaches extremes in the normal range. Currently, the indicator is very overbought.
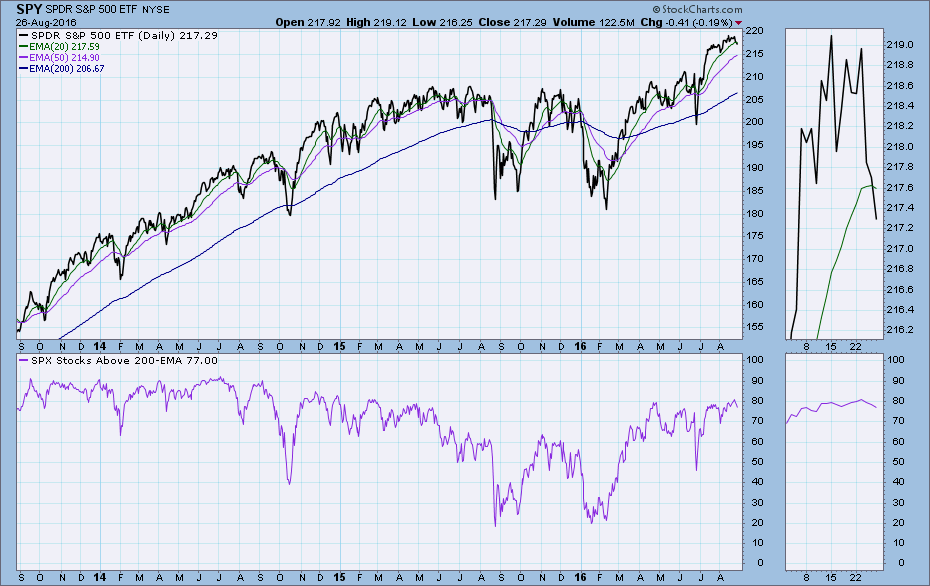
The next indicator is the Percent of S&P 500 Stocks Above Their 200EMA. At 77% it is also overbought, though not to the extreme it was in 2014.
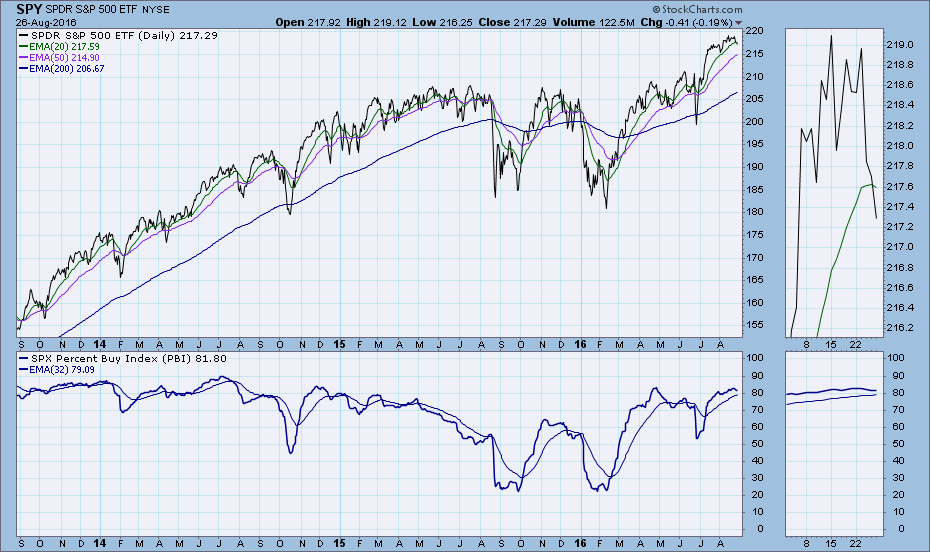
Finally, we have the PBI (Percent Buy Index) for the S&P 500, which expresses the percentage of stocks on Price Momentum Model (PMM) BUY signals. At 82.8% it is also in the overbought part of its normal range.
While all three indicators are overbought, there is another critical piece of information that needs to be considered before reaching any conclusions: the SPY 50EMA is above the SPY 200EMA. By my definition that means that SPY is in a bull market, and that requires that we apply a bullish bias to our analysis.
In a bull market, overbought conditions are less likely to result in serious corrections. Price is not immune to corrections, but it is less likely that the market will fall apart. From 2012 we can observe numerous corrections/pullbacks within the larger up trend, demonstrating the constant upward bias exerted by the bull market. The only time that was in doubt was during the sideways consolidation from August 2015 to February 2016.
CONCLUSION: Long-term indicators are quite overbought and they warn that a pullback or correction is likely, but that warning is mitigated by the fact that we are in a strong bull market. Under these conditions it is probably not a good time to be opening new long positions, but it is also not a good time to go short. Caveat: This is my view in an intermediate-term context, not a recommendation.
Erin will be presenting at ChartCon 2016 next month. Her focus will be on how to develop a personal timing model based upon DecisionPoint indicators.
Technical analysis is a windsock, not a crystal ball.


