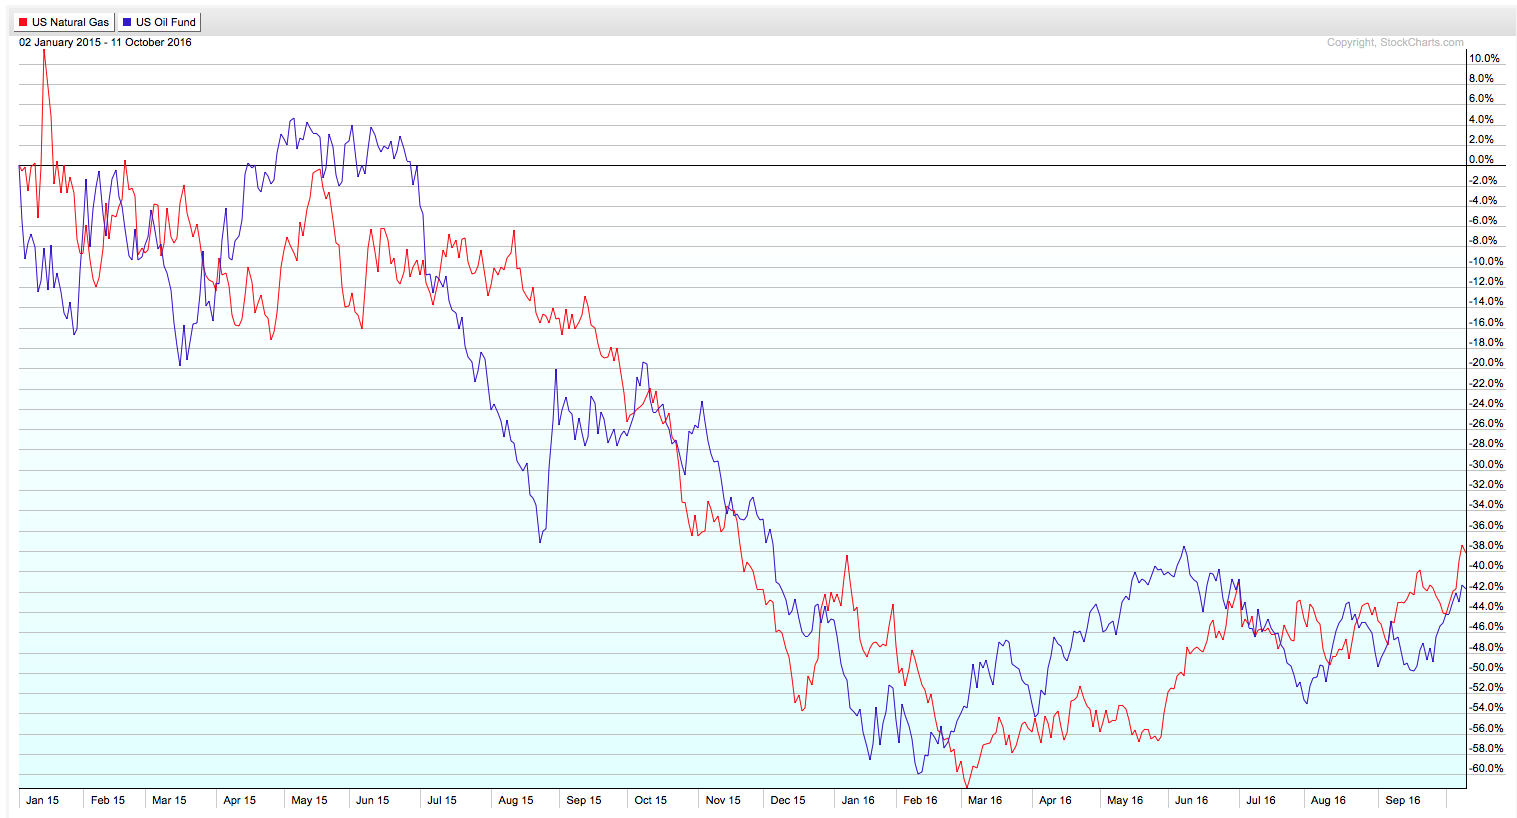
I recently received a request from a webinar viewer to make a comparison between Natural Gas (UNG) and US Oil Fund (USO). As I pulled up the daily chart for UNG, I noted a very important signal. The 50-EMA just crossed above the 200-EMA! This triggers a Long-Term Trend Model (LTTM) BUY signal. This signal implies that UNG is now in a "bull market". USO has not yet had that important signal.
I decided to look at a perf chart (Performance Chart) that compared UNG to USO since January 2015. Looking at the chart, it does appear that in general, both do trend similarly in the intermediate to long term.
Quickly reviewing the daily chart for UNG, we see that price has been in a rising trend. Price reached overhead resistance yesterday and managed to cross above, but today it fell back. The very bullish SCTR suggests that UNG is in a period of internal strength (SCTR > 75). Given the current Price Momentum Oscillator (PMO) BUY signal and location only somewhat overbought. To continue a positive divergence between PMO tops and price tops, current readings need to get above the previous PMO top.
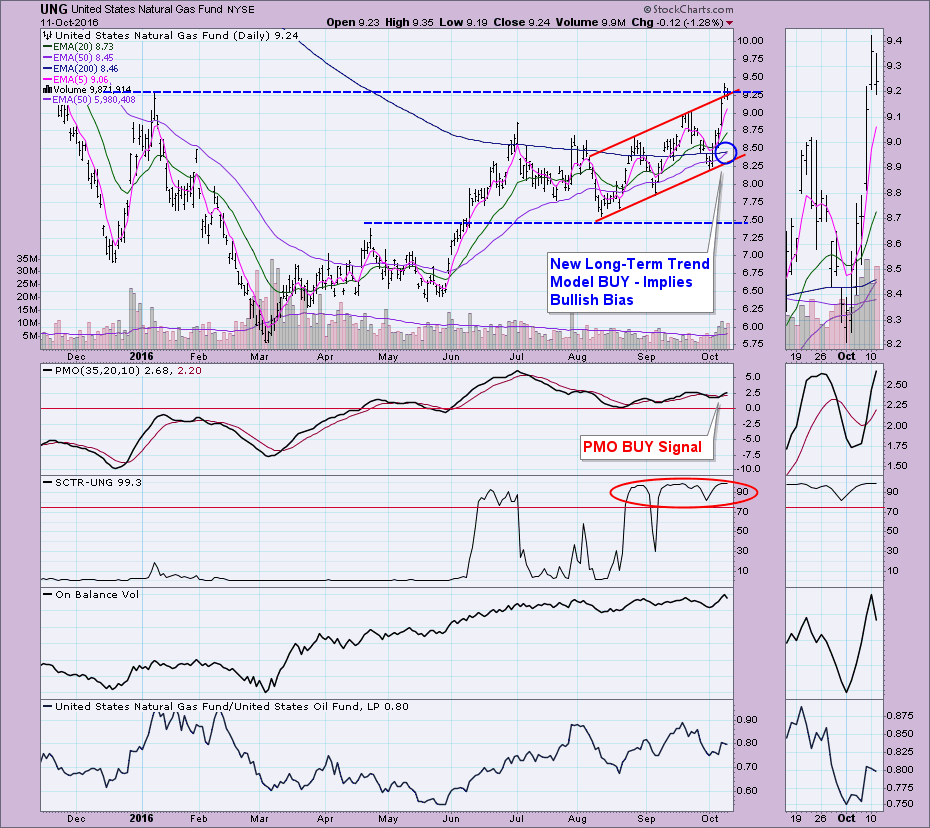
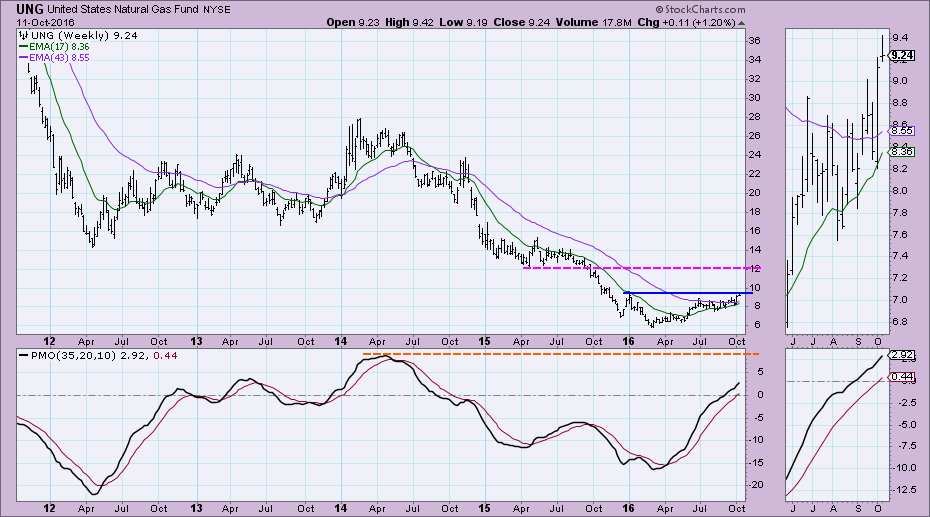
The big problem for UNG (and USO as you'll see) is that price is sitting against strong overhead resistance. The PMO is rising, but it is reaching overbought territory. If price does breakout above $9.50, there is resistance looming at $12. That would still be a tidy gain, but the breakout needs to occur before we can start licking our chops at the $12 mark.
Notice that USO is up against similar longer-term overhead resistance. USO hasn't quite reached it, but the rising intermediate-term PMO suggests that it should.
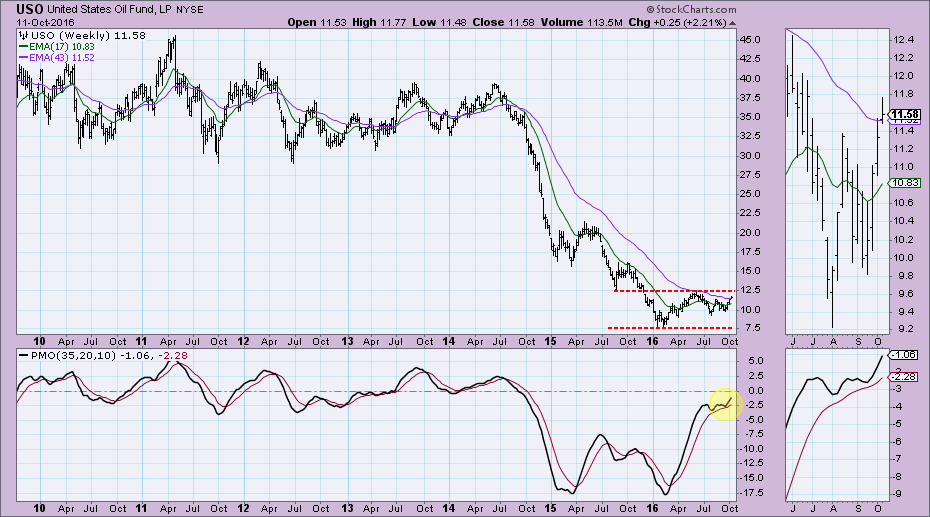
Conclusion: The new LTTM BUY signal on UNG is promising, but price is butting up against strong overhead resistance. Both UNG and USO have this similar problem on the weekly charts. PMOs suggest the breakouts will occur, but I wouldn't get overly optimistic about a strong rally until they actually DO breakout.
fThe NEW DecisionPoint LIVE public ChartList has launched! Click on the link and you'll find webinar charts annotated just before the program. Additional "chart spotlights" will be included at the top of the list. Be sure and bookmark it!
Come check out the DecisionPoint Report with Erin Heim on Wednesdays and Fridays at 7:00p EST, a fast-paced 30-minute review of the current markets mid-week and week-end. The archives and registration links are on the Homepage under “Webinars”.
Technical Analysis is a windsock, not a crystal ball.
Happy Charting!
- Erin


