 With major support being broken on the SPY (see today's DP Alert blog article for more on the SPY), I decided to run my "dogs" scan. It picks up S&P 500 stocks that have a negative Trend Model configuration (20-EMA < 50-EMA < 200-EMA) and have a Price Momentum Oscillator (PMO) that has topped and been falling three days. I'll include the text of the scan at the end of the article. There were only two stocks that fit these criterion in the S&P 500, Starbucks (SBUX) and Costco (COST).
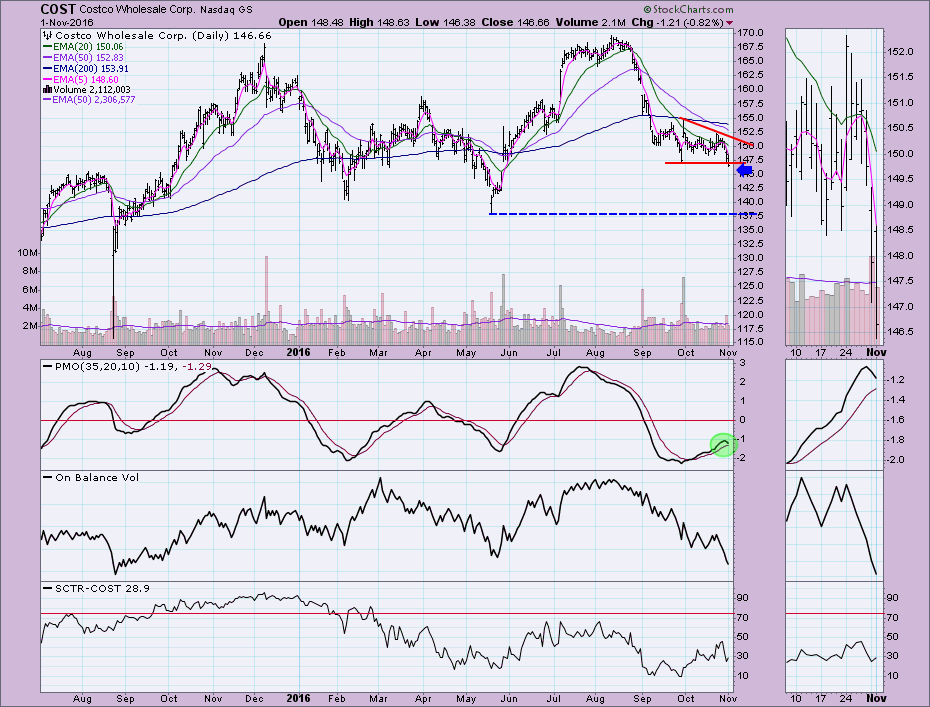
Costco executed a descending triangle pattern, similar to the SPY. Remember that when the 50-EMA is below the 200-EMA, it implies a bear market. Costco has been in a bear market since mid-October. The PMO topped well below the zero line and is about to incur a PMO SELL signal. The OBV is supporting further breakdown, one that likely will test support at the May low.
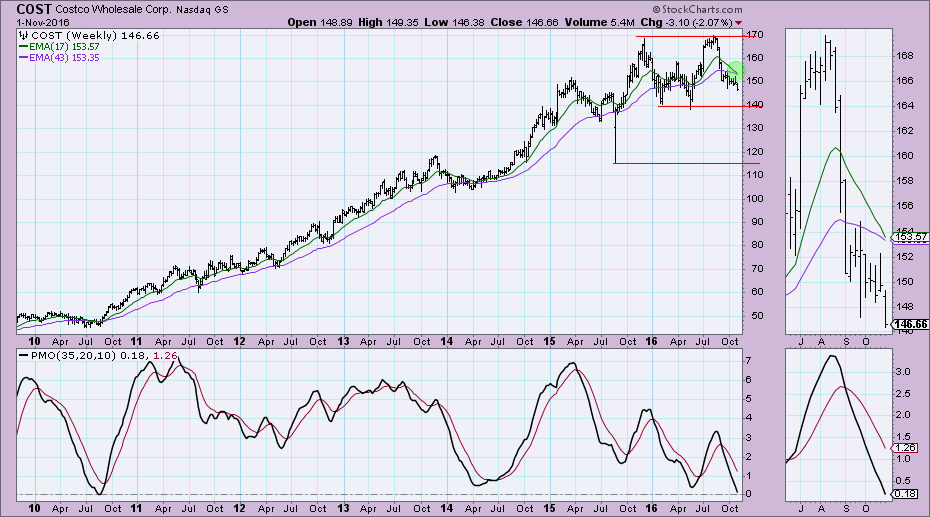
The weekly PMO has been on a SELL signal since September and the reading is about to traverse below the zero line, something we haven't seen in over 7 years. Note also that the 17-week EMA is in the process of crossing below the 43-week EMA.
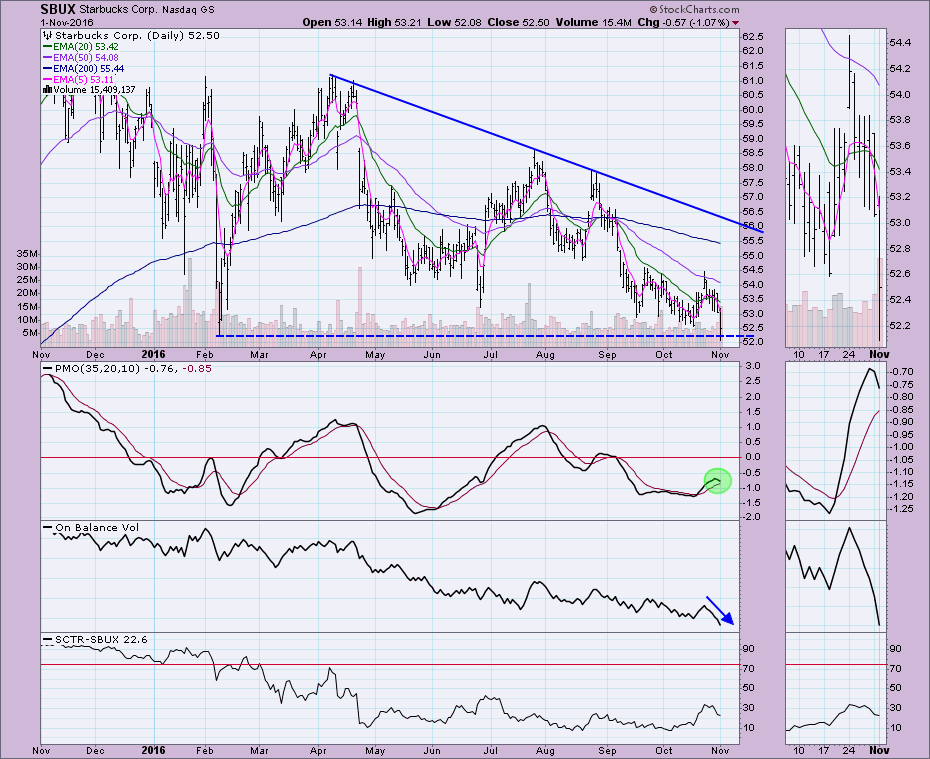
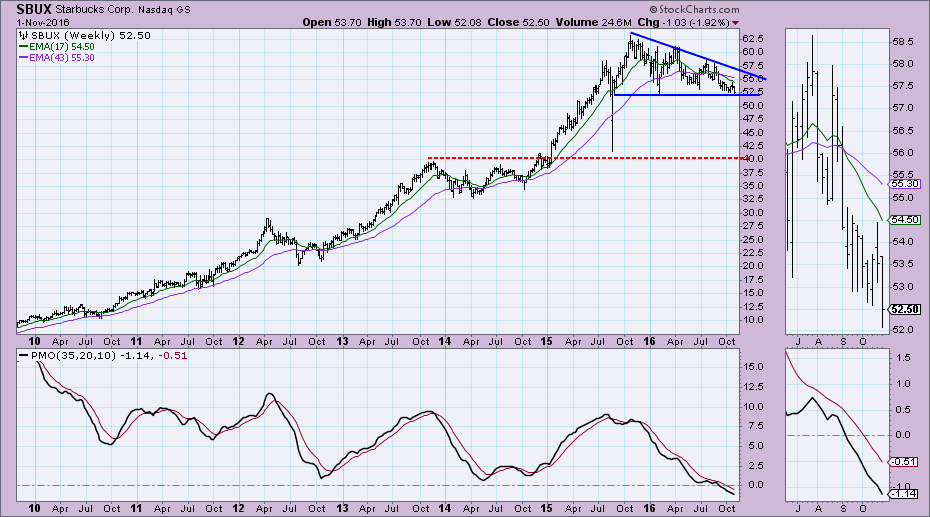
On both the daily and weekly charts below, a large descending triangle has formed. These are bearish formations and are plaguing many of the major indexes and their constituents. As with Costco, the PMO has topped below the zero line and is headed for a SELL signal. The OBV is free-falling lower with price. The only positive here would be that the descending triangle hasn't executed, but given the very bearish indicators and negative Trend Model configuration, that support will likely be breached very soon.
To find the next area of support, we need to look at the weekly chart. Support lies all the way down to the $40 range. The 17-week EMA has already crossed below the 43-week EMA and the weekly PMO is now in negative territory, and like Costco, it is something we haven't seen in well over 7 years.
Erin's "Dogs" Scan:
[group is SP500]
AND[today's PMO Line(35,20,10) > today's PMO Signal(35,20,10)]
AND [today's PMO Line(35,20,10) < yesterday's PMO Line(35,20,10)]
AND [yesterday's PMO Line(35,20,10) < 2 days ago PMO Line(35,20,10)]
AND [today's ema(20,close) < today's ema(50,close)]
AND [today's ema(50,close) < today's ema(200,close)]
The NEW DecisionPoint LIVE public ChartList has launched! Click on the link and you'll find webinar charts annotated just before the program. Additional "chart spotlights" will be included at the top of the list. Be sure and bookmark it!
Come check out the DecisionPoint Report with Erin Heim on Wednesdays and Fridays at 7:00p EST, a fast-paced 30-minute review of the current markets mid-week and week-end. The archives and registration links are on the Homepage under “Webinars”.
Technical Analysis is a windsock, not a crystal ball.
Happy Charting!
- Erin

