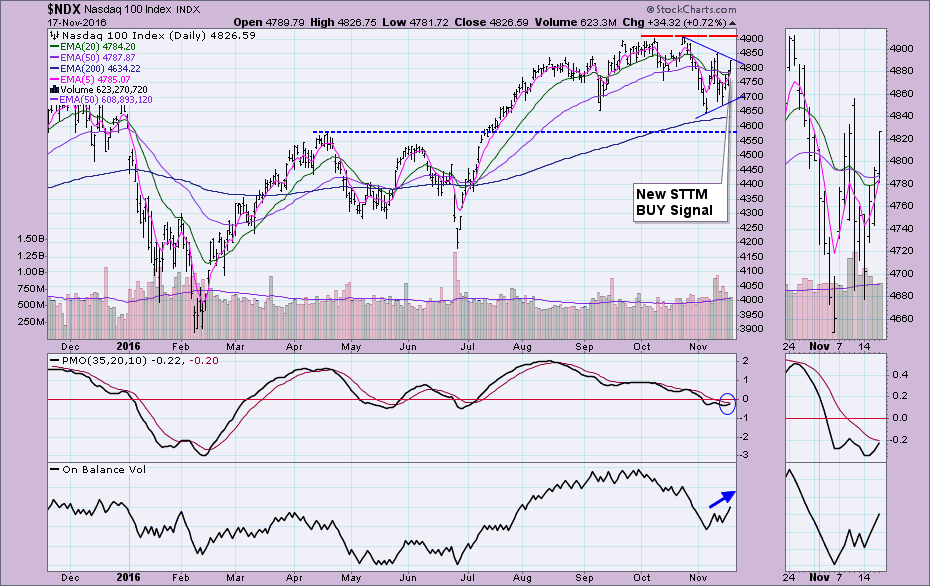
 Today the NDX switched to a Short-Term Trend Model BUY signal. This signal was triggered when the 5-EMA crossed above the 20-EMA. I don't use STTM signals for trading, but they do work as a temperature gauge. This new STTM BUY signal tells us that the NDX may be waking up. In fact, XLK just garnered a new Intermediate-Term Trend Model (ITTM) BUY Signal as the 20-EMA just crossed back above the 50-EMA. The NDX is gearing up for an ITTM BUY signal as well. Even better, I also noticed possible bullish double-bottom patterns on both the NDX and XLK.
Price was unable to penetrate the declining tops resistance line at the top of a symmetrical triangle. These are typically continuation patterns and though it didn't breakout today, the formation suggests an upside breakout. As I noted above, there should be a new ITTM BUY signal very soon with the 20-EMA only about 3.5 points away from a positive crossover the 50-EMA. Additionally, the Price Momentum Oscillator (PMO) is nearing a BUY signal and OBV is behind the rally.
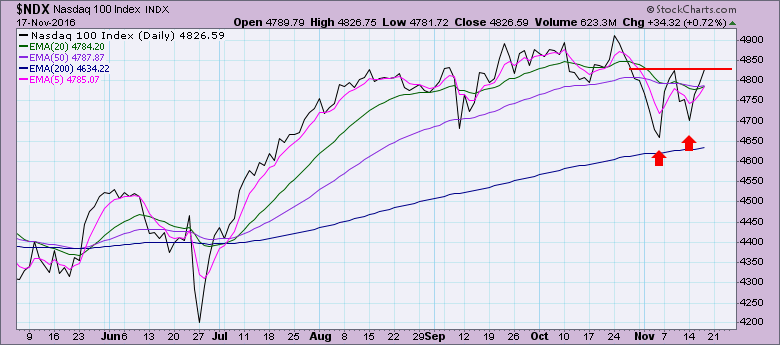
 Here is a line chart so that you can see the double-bottom pattern more clearly. These are bullish reversal patterns. A correction appeared on its way at the end of October, but price rebounded into this pattern. It will execute when price has a significant breakout (some say a decisive 3%) above the neckline which is drawn from the center peak of the pattern. An execution of the pattern would suggest a minimum upside target that is the length of the pattern away from the neckline. In this case, it would easily put price above current all-time highs.
 XLK has a similar set up. Interestingly, a STTM BUY hasn't quite executed yet, but the ITTM BUY signal has. Price also was stopped at declining tops line resistance but is nearing a PMO BUY signal. The SCTR has risen above the 75 line which is also bullish.
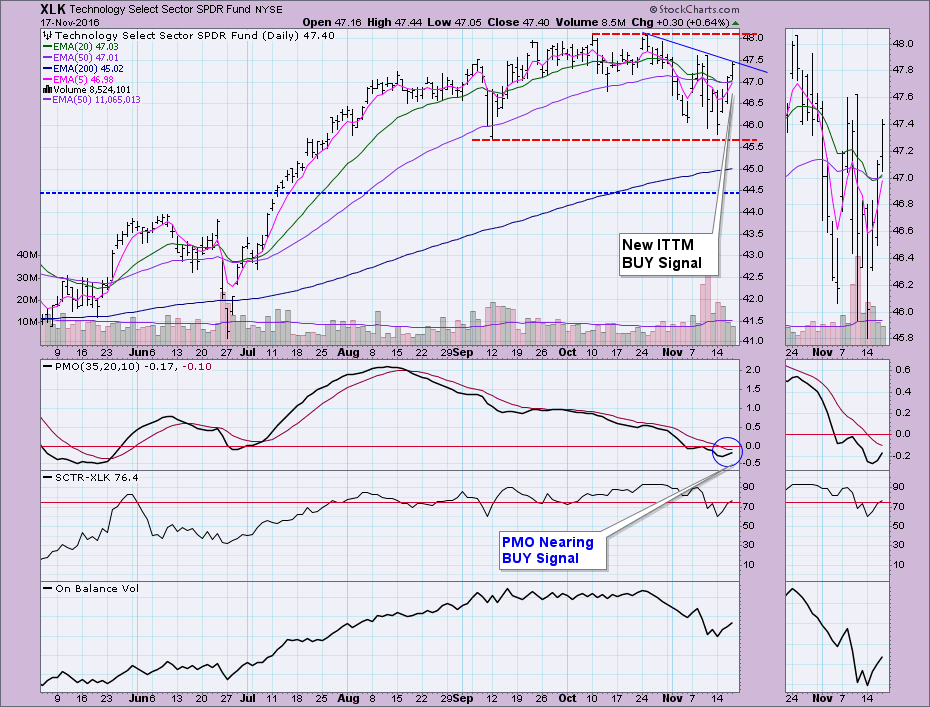 Here is the line chart of the double-bottom formation.
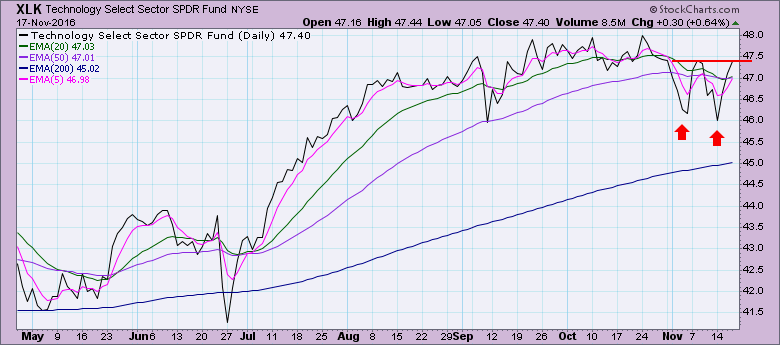 Conclusion: My last blog article questioned where the NDX was in this post-election rally because it seemed it had fallen asleep and was missing out on the party. It appears techs are ready to play catch up which can be of course profitable. One problem they could face is the broader market throwing back on recent all-time high breakouts. That could drag techs along with it. Ultimately, if you watch my recent webinars or read the DecisionPoint Alert daily blog, you know that short-term throwbacks are likely based on currently bearish short-term indicators; however, intermediate-term indicators are bullish and suggest a continuation of the current rally after a possible short-term pause.
The NEW DecisionPoint LIVE public ChartList has launched! Click on the link and you'll find webinar charts annotated just before the program. Additional "chart spotlights" will be included at the top of the list. Be sure and bookmark it!
Come check out the DecisionPoint Report with Erin Heim on Wednesdays and Fridays at 7:00p EST, a fast-paced 30-minute review of the current markets mid-week and week-end. The archives and registration links are on the Homepage under “Webinars”.
Technical Analysis is a windsock, not a crystal ball.
Happy Charting!
- Erin


