Last week I wrote about the ongoing bull market -- the secular bull market, beginning in 2009, and, displayed on the chart, the cyclical bull that began in February of this year. But in spite of a broad market rally, individual sectors are not uniformly bullish. Of the ten sectors making up the S&P 500 Index, three of them (30%) are still experiencing bear markets.
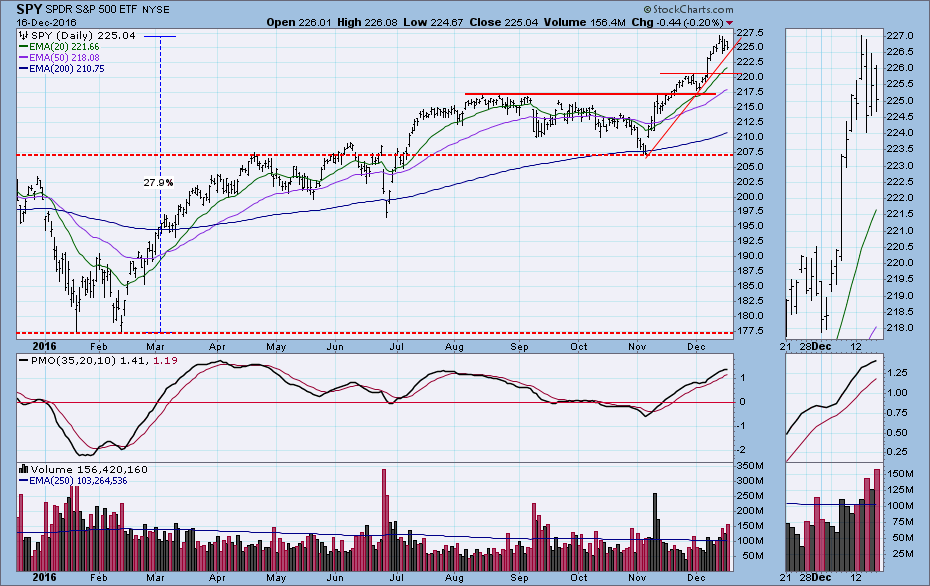
For the purpose of this discussion, the definition of a bear market is when the 50EMA of price is below the 200EMA. It is not an infallible rule, but it is objective and widely accepted as evidence of long-term downward pressure on price.
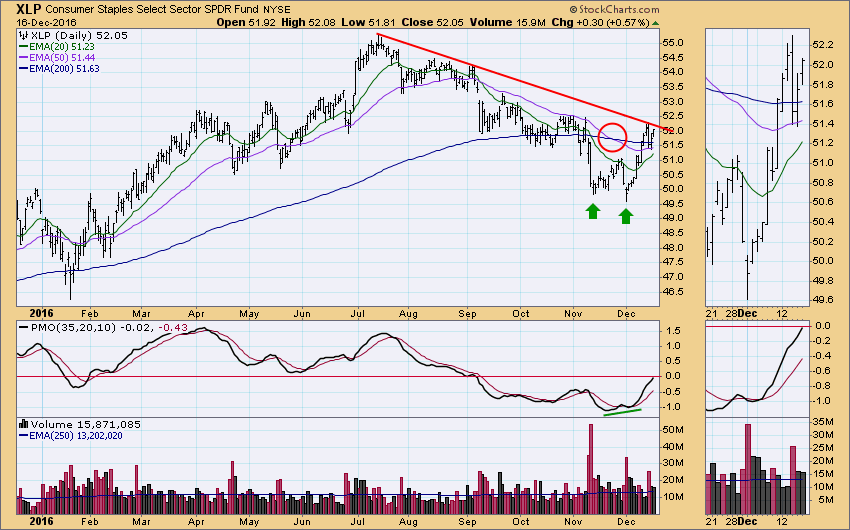
Even though they are of different sectors, the following three charts are so similar that I will discuss them in broad terms first: (1) The sectors topped in July or early-August, (2) the 50/200EMA downside crossover occurred in November, (3) all are rallying off double bottoms, but (4) prices remain below declining tops lines.
Consumer Staples (XLP): The PMO shows a positive divergence, and price has moved above all three EMAs. A break above the declining tops line seems likely, and a 50/200EMA upside crossover would not be far behind.
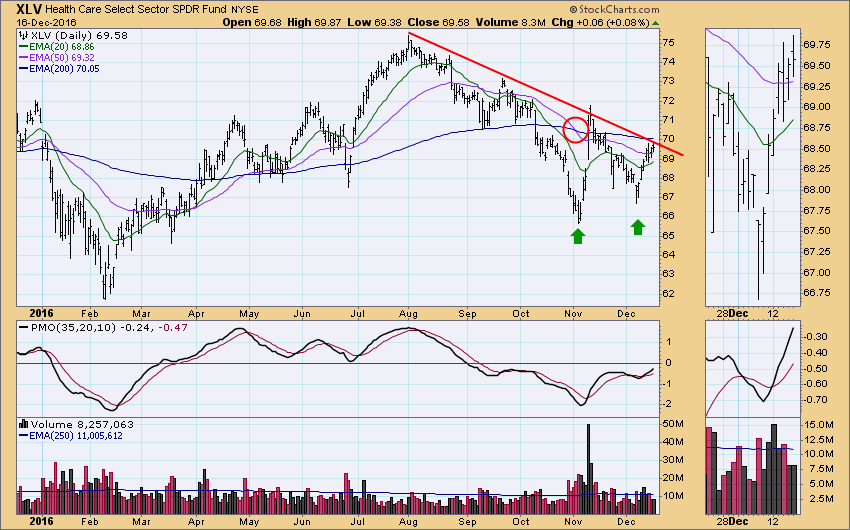
Health Care (XLV): This chart is not as positive as Consumer Staples because price still has to deal with the resistance of the 50EMA and 200EMA, not to mention the declining tops line. Nevertheless, I think chances of a breakout are better than 50%.
Real Estate (XLRE): This is the weakest of the three charts. Price has not reached the declining tops line, and the double bottom is so thinly defined as to possibly represent wishful thinking. The PMO seems toppy. The bounce off the November low has been sluggish, and at this point I think that a breakout is unlikely.
You will remember that this sector was recently spun off from the Financials sector (XLF), which incidentally is rallying big time. As an aside, my personal opinion is that Real Estate was separated from the Financials so as to immunize them from the next real estate crash. I don't know if that is possible in the long run, but it has certainly worked over the last several months.
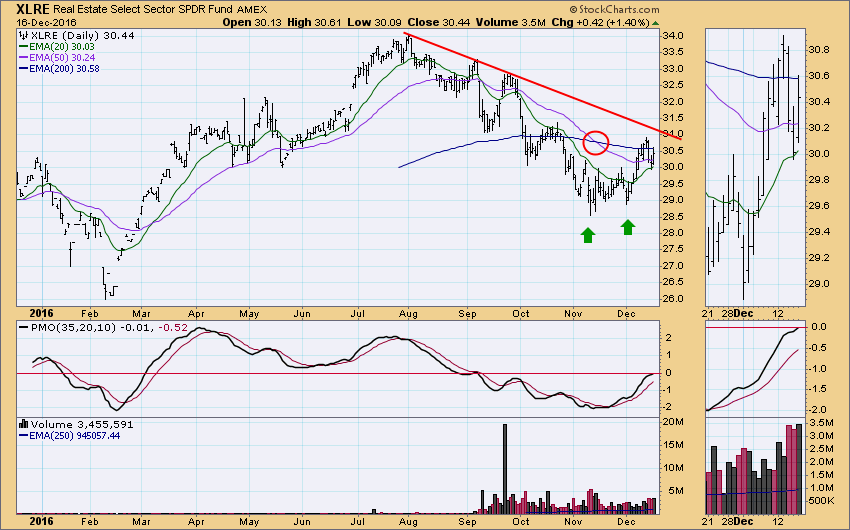
Note: XLRE is new and has only about a year of data. For a long-term view of the sector, you can check out the Real Estate ETF (IYR).
CONCLUSION: Even in the strongest bull market there will be some stocks and sectors that are not following the broad market. Currently, three of the ten S&P 500 sectors are in technical bear markets, and they have remarkably similar charts. Consumer Staples (XLP) and Health Care (XLV) appear to have a good chance of reversing their declines and joining the bull market. Real Estate (XLRE) has been part of the post-election rally, but its performance has been relatively poor, and it seems least likely to escape the bear.
The NEW DecisionPoint LIVE public ChartList has launched! Click on the link and you'll find webinar charts annotated just before the program. Additional "chart spotlights" will be included at the top of the list. Be sure and bookmark it!
Come check out the DecisionPoint Report with Erin Heim on Wednesdays and Fridays at 7:00p EST, a fast-paced 30-minute review of the current markets mid-week and week-end. The archives and registration links are on the Homepage under “Webinars”.
Technical Analysis is a windsock, not a crystal ball.
Happy Charting!
- Carl


