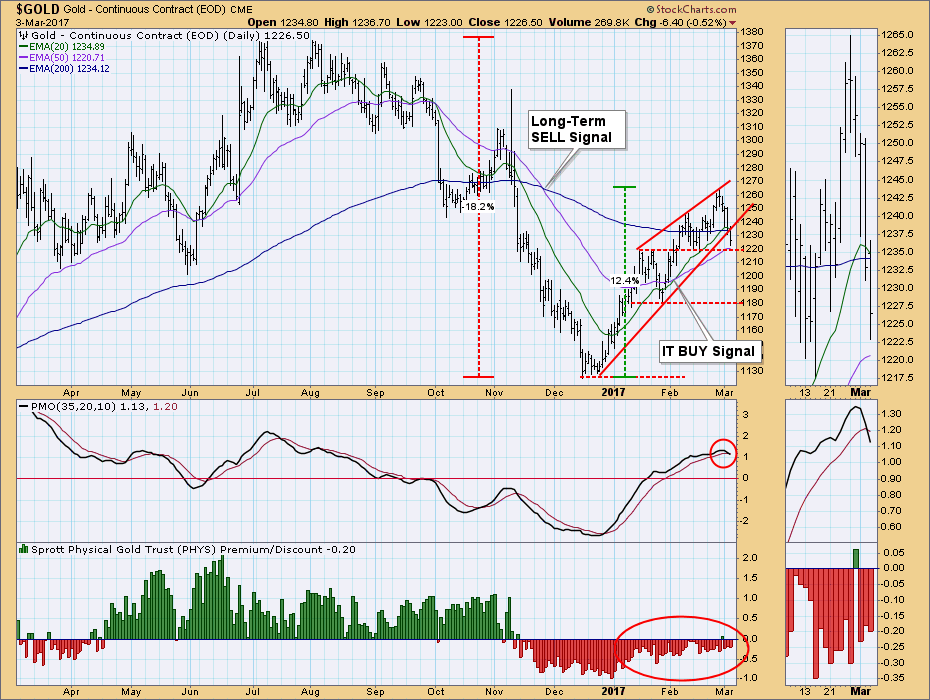
On Friday gold broke below the rising trend line that forms the bottom of a rising wedge pattern. A breakdown was expected because that is the normal and highly reliable resolution of most rising wedge patterns. The minimum downside target is 1180, but downside estimates for rising wedge patterns are highly unreliable, so we'll need to be alert as price is approaching the next level of support at 1220.
Gold entered a bear market in November when the 50EMA crossed down through the 200EMA (long-term SELL signal), but, as price rebounded from the December low, a new intermediate-term BUY signal was generated when the 20EMA crossed up through the 50EMA in February. Reinforcing the short-term negativity of the breakdown is a PMO (Price Momentum Oscillator) SELL signal, generated when the PMO crossed down through its signal line. Having different signals in different time frames is fairly common. At this point, in my opinion, the weight of the evidence favors the bears because we have a short-term PMO SELL signal inside a long-term SELL signal.
The bottom panel on the above chart shows that *Sprott Physical Gold Trust is selling at a discount, reflecting that sentiment is still bearish. Note that, except for one day, sentiment has remained bearish for the duration of the recent rally. It needs to start trading at a premium if we are to have confidence that a rally will continue.
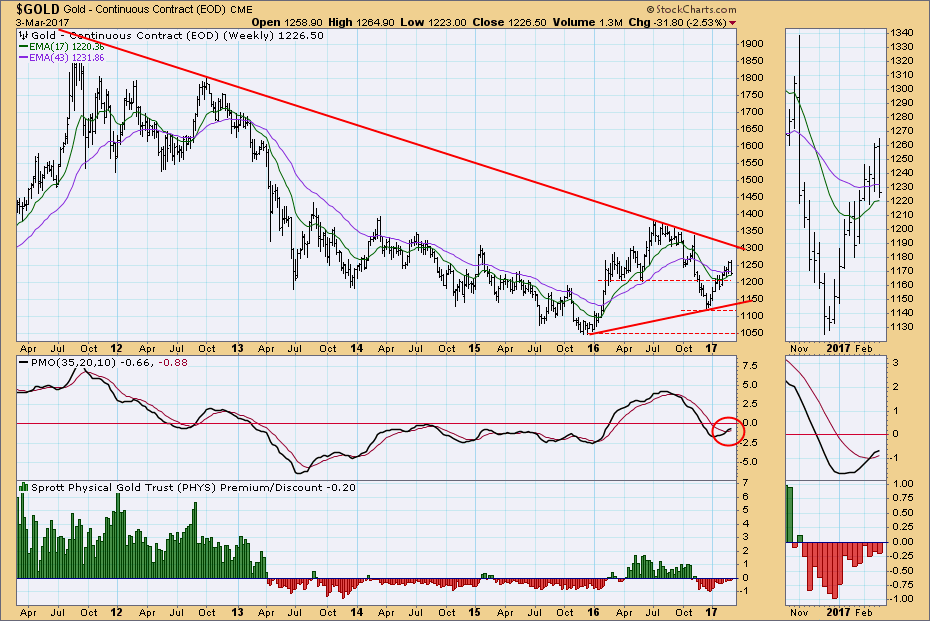
On the weekly chart below we can see that the weekly PMO is rising above its signal line. This is positive, but another week of price decline could cause the PMO to turn down.
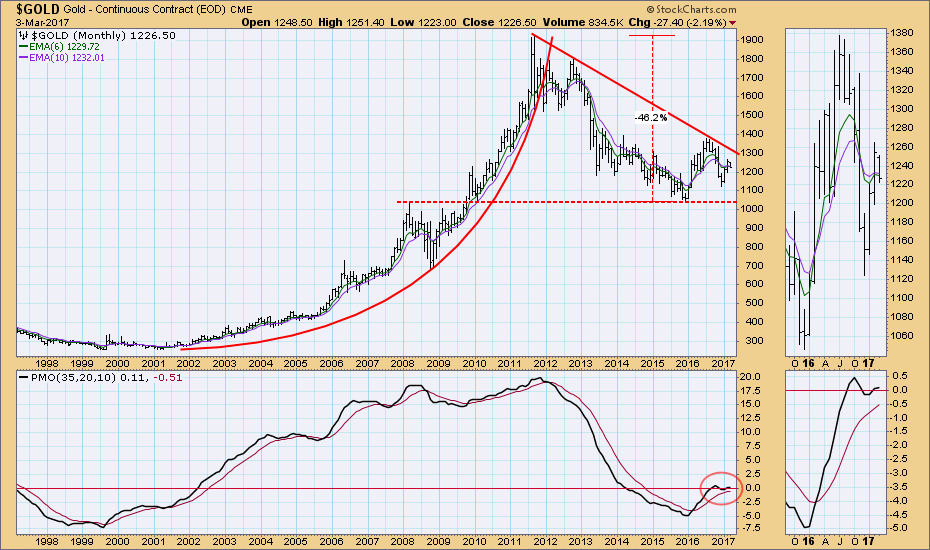
The feature of immediate interest on the monthly chart below is that the monthly PMO is trying to top, but remember that this chart will not be final until the end of the month.
CONCLUSION: Gold broke down from a rising wedge pattern on Friday. Also, the daily PMO topped and crossed down through its signal line. Since gold is in a bear market, I am inclined to believe that there is more price decline ahead for gold.
*Sprott Physical Gold Trust (PHYS) is a closed-end fund that trades like a stock. As such it is possible for it to trade at a premium or discount to its net asset value (NAV).
The NEW DecisionPoint LIVE public ChartList has launched! Click on the link and you'll find webinar charts annotated just before the program. Additional "chart spotlights" will be included at the top of the list. Be sure and bookmark it!
Come check out the DecisionPoint Report with Erin Heim on Wednesdays and Fridays at 7:00p EST, a fast-paced 30-minute review of the current markets mid-week and week-end. The archives and registration links are on the Homepage under “Webinars”.
Technical Analysis is a windsock, not a crystal ball.
Happy Charting!
- Carl


