
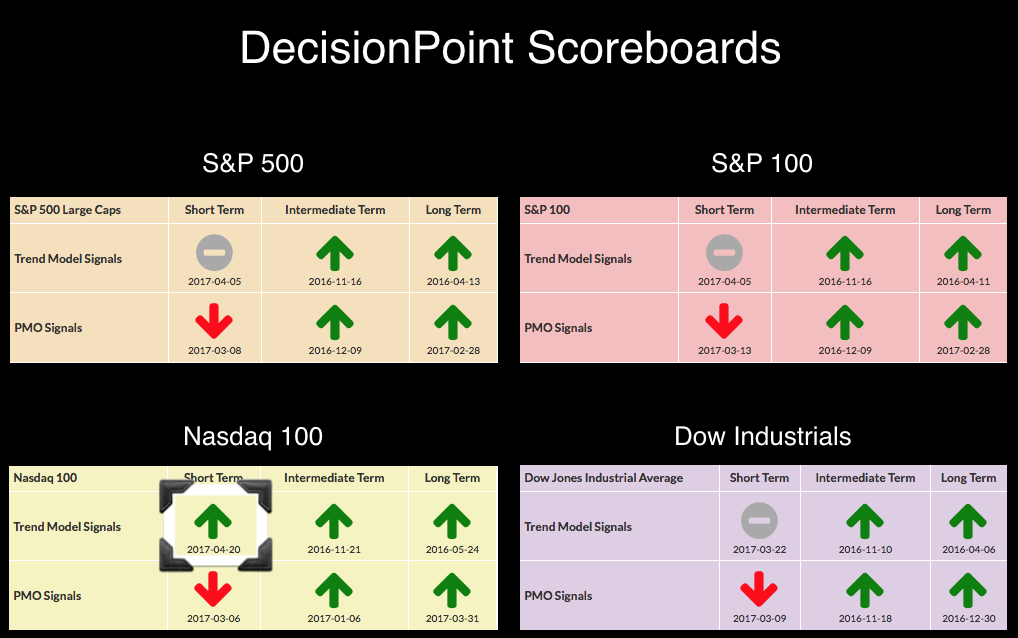
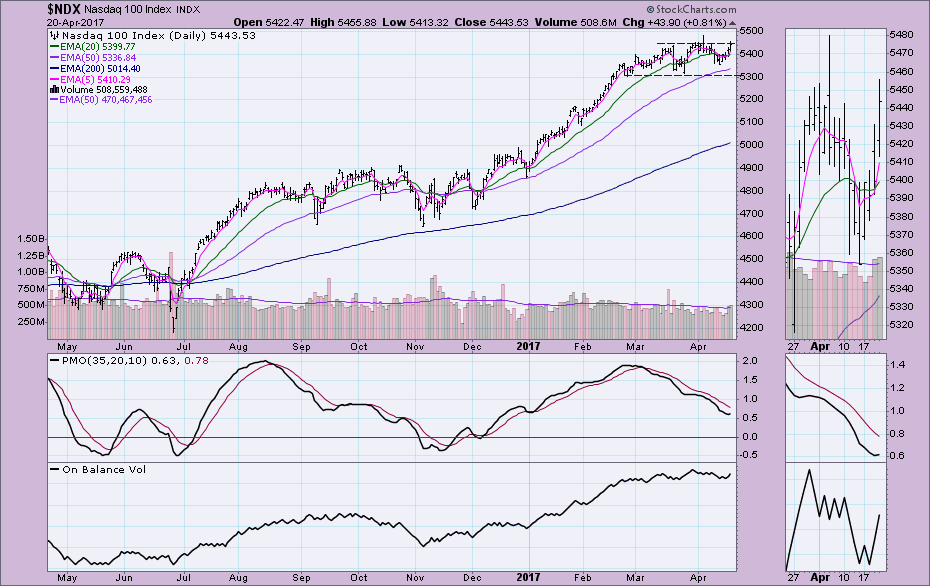
Today the Nasdaq 100 triggered a new Short-Term Trend Model (STTM) BUY signal. This replaces a Neutral signal from exactly one week ago. In the thumbnail of the chart below the DecisionPoint Scoreboards, you can that the Neutral signal was the victim of whipsaw. I've been bearish on the market of late, but looking at NDX price movement, I like the last bottom forming above the previous and a breakout attempt being made to new all-time highs. Note also that the Price Momentum Oscillator (PMO) has now turned up.
The purpose of the DecisionPoint Alert Daily Update is to quickly review the day's action, internal condition, and Trend Model status of the broad market (S&P 500), the nine SPDR Sectors, the U.S. Dollar, Gold, Crude Oil, and Bonds. To ensure that using this daily reference will be quick and painless, we are as brief as possible, and sometimes we let a chart speak for itself.
SIGNALS: Here we include charts of any important signal changes triggered today by our Intermediate-Term Trend Model.
No Signal Changes to Report.
NOTE: Mechanical trading model signals define the implied bias of the price index based upon moving average relationships, but they do not necessarily call for a specific action. They are information flags that should prompt chart review. Further, they do not call for continuous buying or selling during the life of the signal. For example, a BUY signal will probably return the best results if action is taken soon after the signal is generated. Additional opportunities for buying may be found as price zigzags higher, but the trader must look for optimum entry points. Conversely, exit points to preserve gains (or minimize losses) may be evident before the model mechanically closes the signal.
STOCKS: Based upon a 11/15/2016 Intermediate-Term Trend Model BUY signal, our current intermediate-term market posture for the S&P 500 (SPY) is bullish. The Long-Term Trend Model, which informs our long-term outlook, is on a BUY signal as of 4/1/2016 so our long-term posture is bullish.
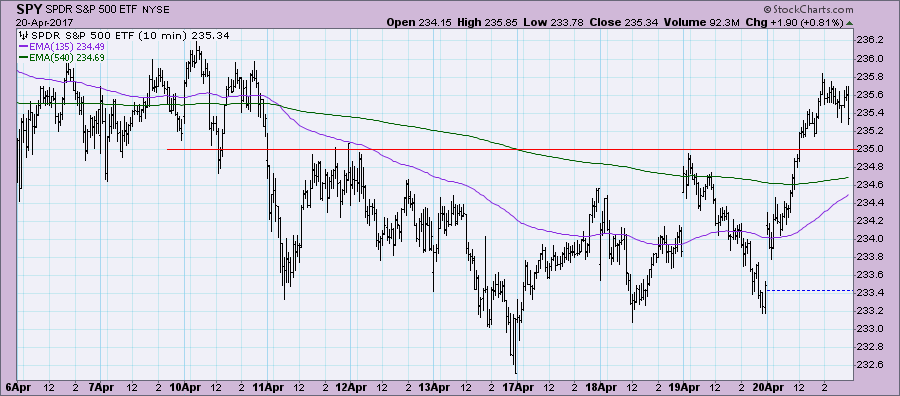
Today price broke above recent resistance and consolidating by the end of the day. Looks like a possible bull flag.
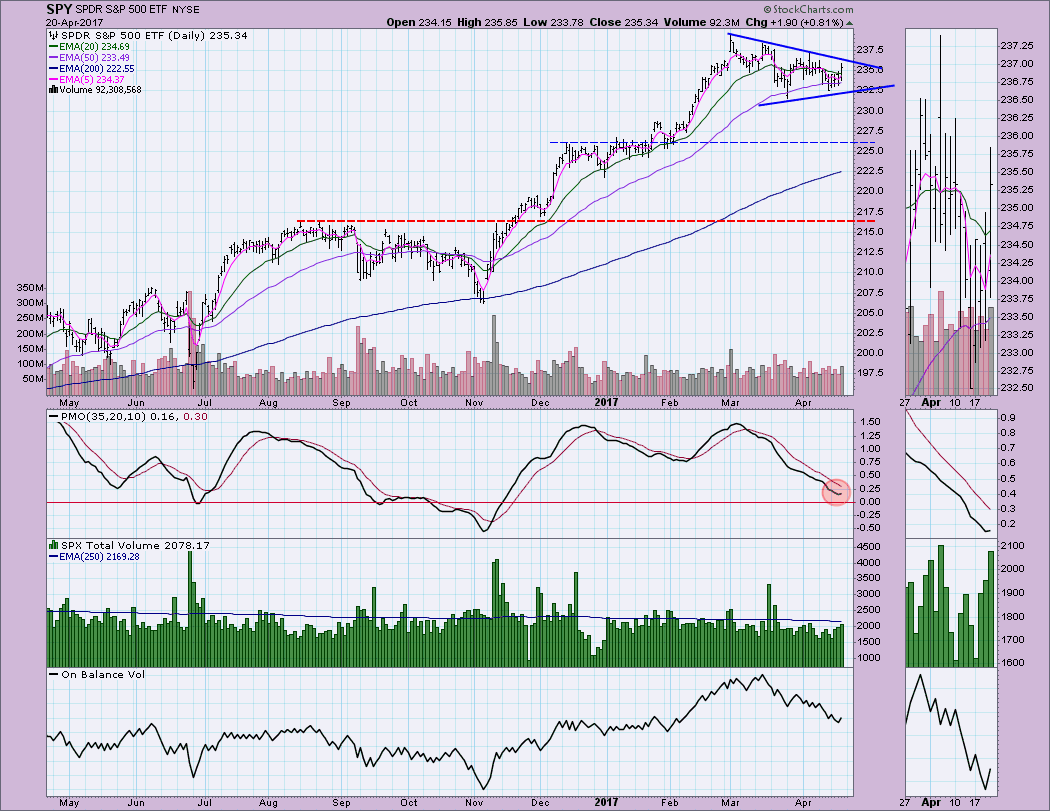
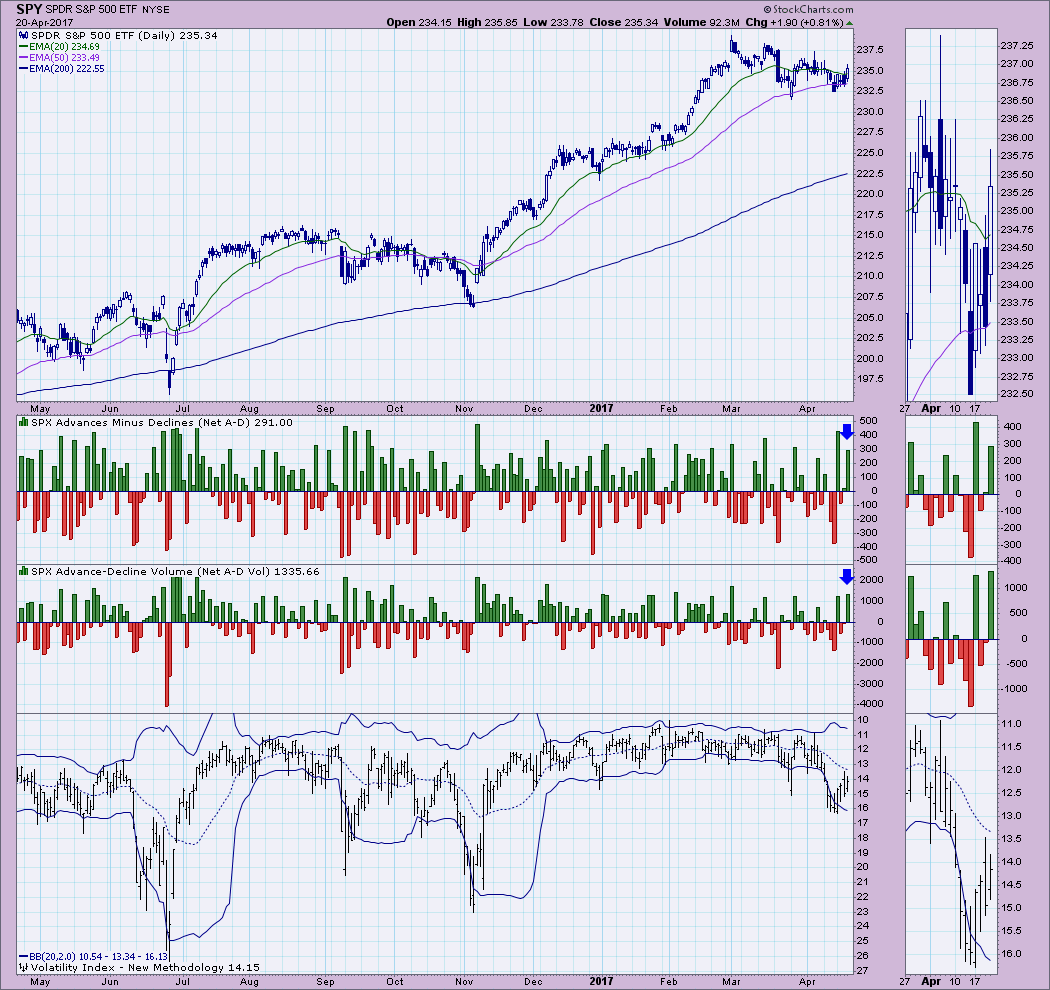
Price is traveling within a symmetrical triangle on the SPY. These patterns are typically continuation patterns which would suggest price should breakout this time around. The PMO is turning up which also increases optimism. It was a sustained rally on increasing volume which is positive. The OBV is not showing us a bullish divergence or confirmation at this time.
Ultra-Short-Term Indicators: Today saw somewhat climactic breadth readings. However, the VIX didn't really confirm this as a buying initiation. The VIX readings are declining which does suggest more bullishness in the market place, but I like to see band penetrations as confirmation.
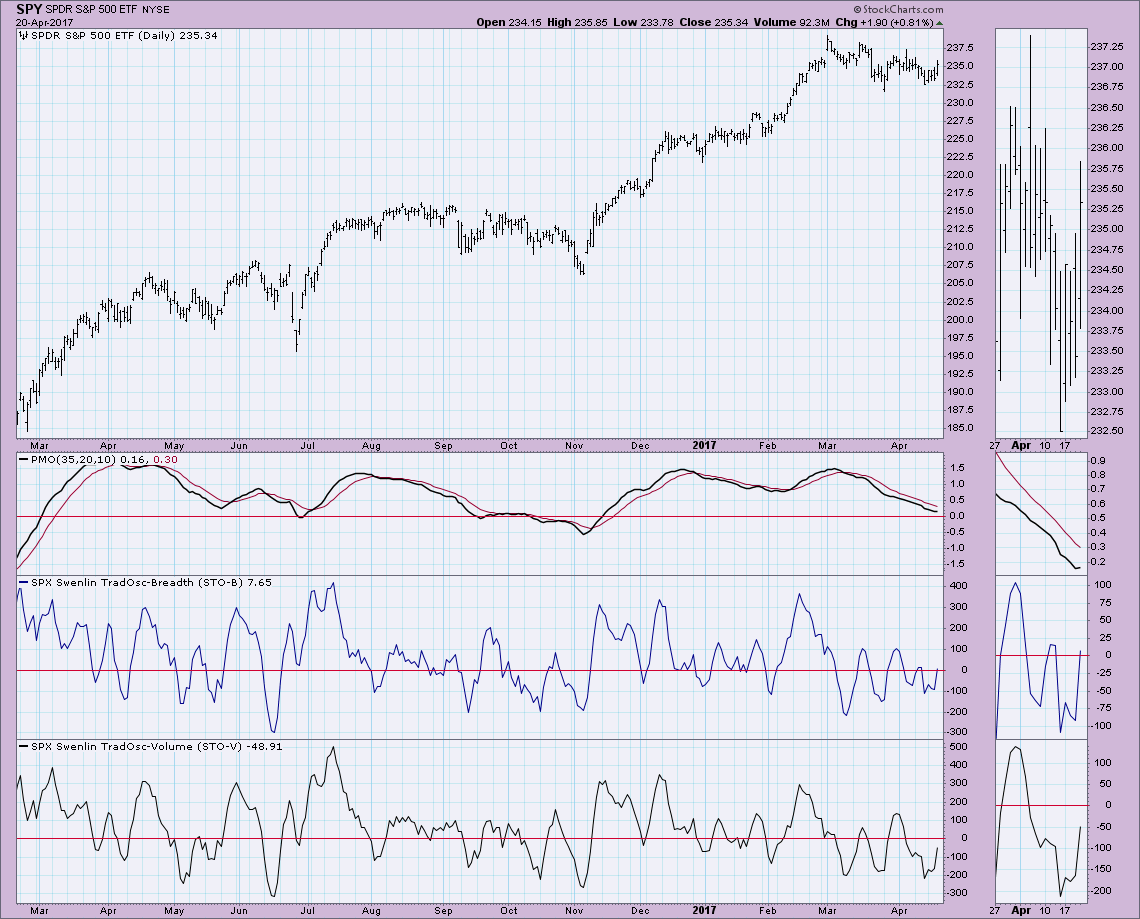
Short-Term Indicators: It appears these indicators have picked a direction and that is 'higher'. Readings are in neutral, but they are rising which is bullish for the short term.
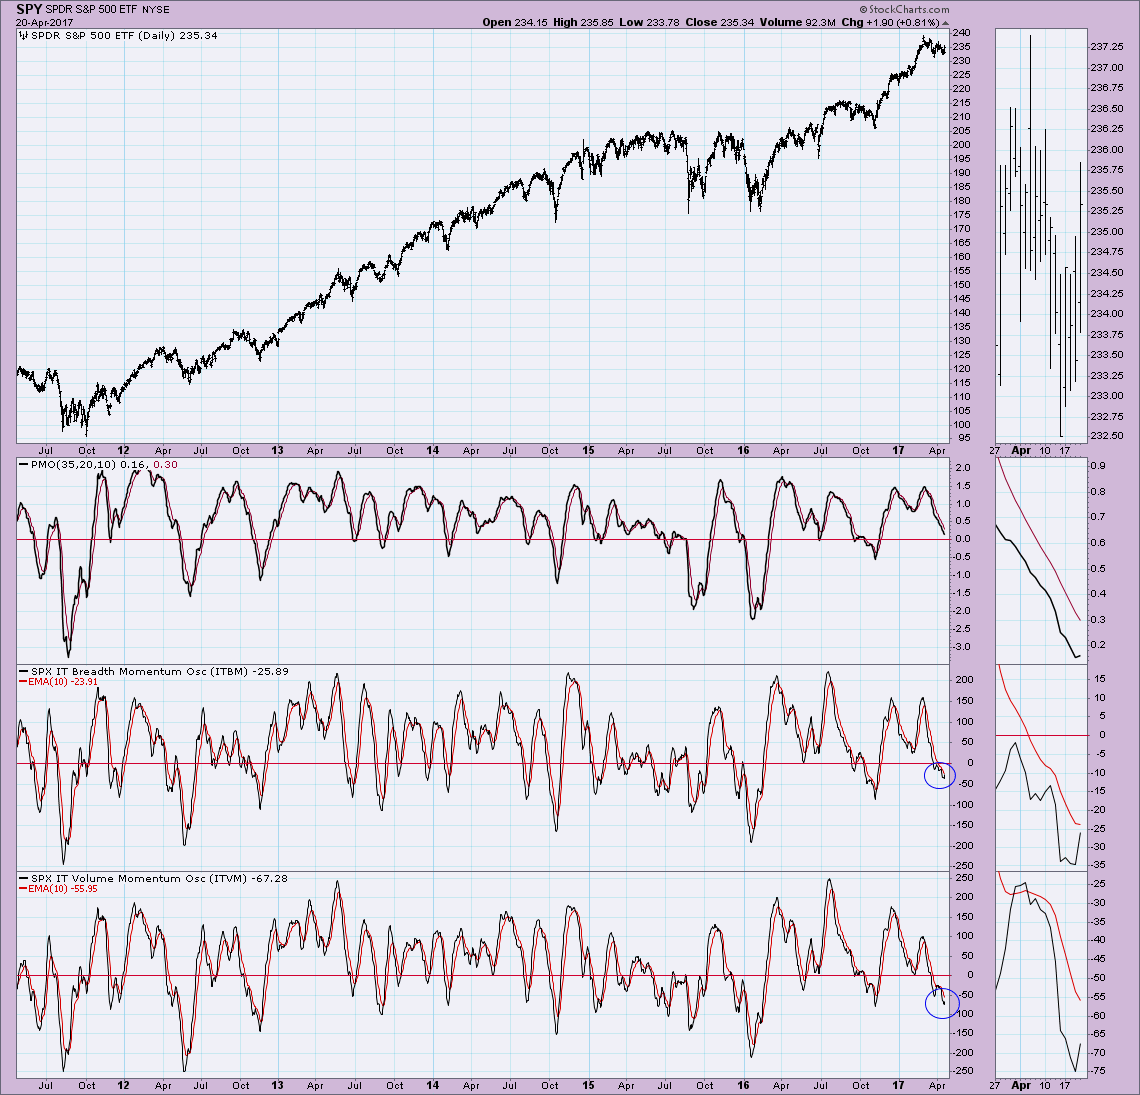
Intermediate-Term Indicators: It's hard to interpret whether this is going to be a reliable bottom on these indicators so it's best to simply wait for the positive crossovers before getting bullish. The readings are sitting in neutral and appear to be rising, I'd call that somewhat bullish.
Conclusion: Price is spiraling into the apex of a symmetrical triangle. It is now testing the top of the triangle. With indicators beginning to look up including a PMO bottom and new BUY signal on the NDX, I'll have to readjust my short-term position to cautiously bullish.
**Don't miss the DecisionPoint Alert Daily Commentary! Click on "Email Updates" at the end of this blog page to be notified as soon as it's published at the end of the market day.**
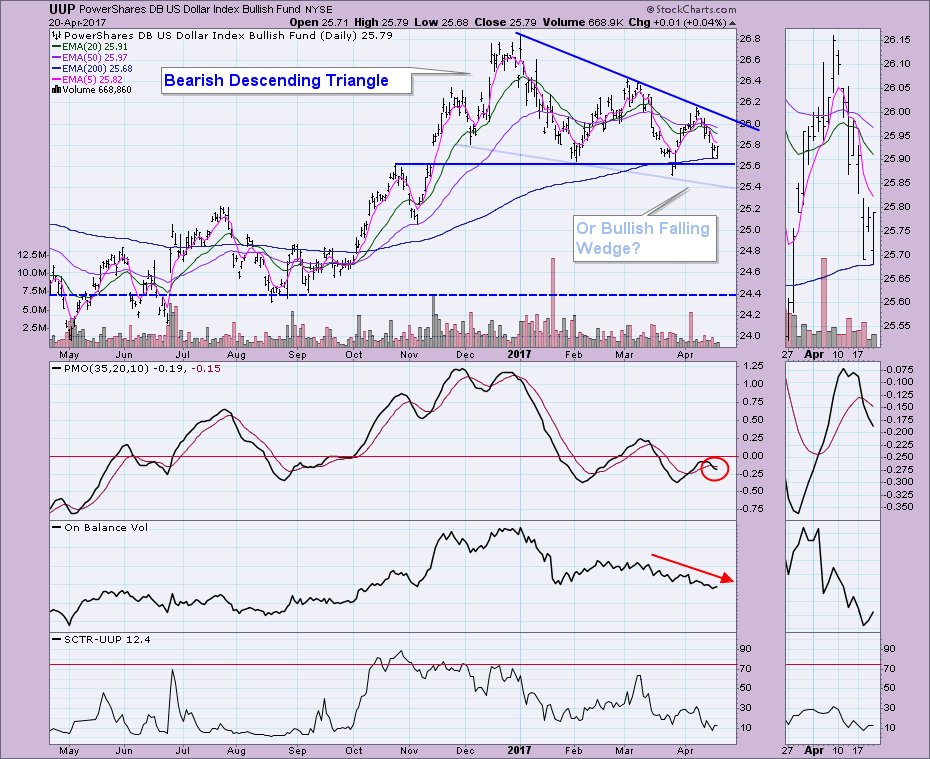
DOLLAR: As of 3/21/2017 the US Dollar Index ETF (UUP) is on an Intermediate-Term Trend Model Neutral signal. The Long-Term Trend Model, which informs our long-term outlook, is on a BUY signal as of 10/17/2016, so our long-term posture is bullish.
I've been pointing out the bearish descending triangle, but a viewer of the MarketWatchers LIVE program that I host M/W/F with Tom Bowley at 12p - 1:30p EST pointed out that you could make a case for a bullish falling wedge. I certainly can see the logic, but the indicators are bearish right now. The PMO just generated a SELL signal and the OBV is not showing any bullish divergences, it actually is showing a bearish confirmation when you compare price tops to OBV tops.
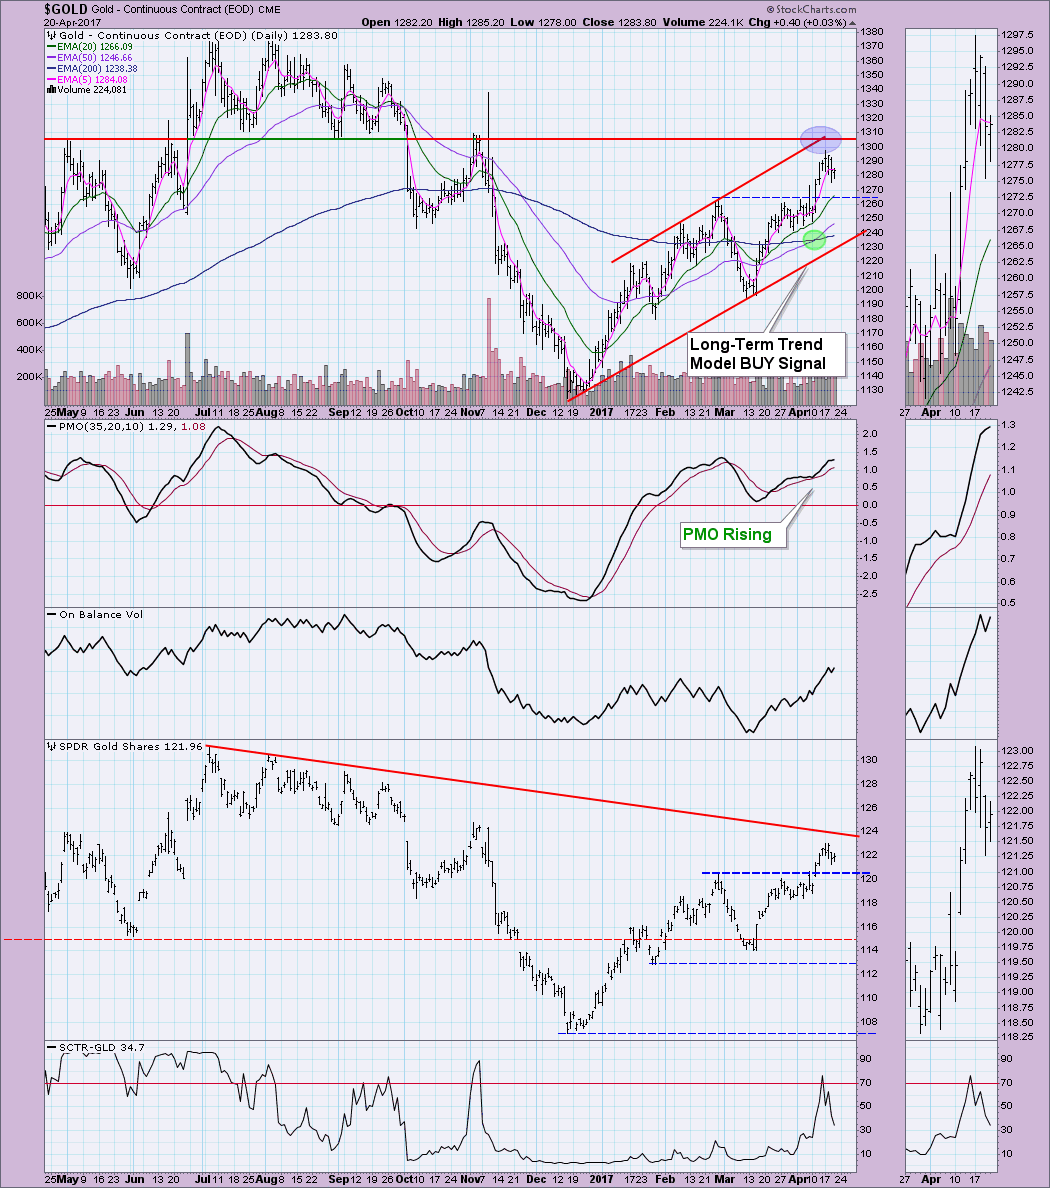
GOLD: As of 2/3/2016 Gold is on an Intermediate-Term Trend Model BUY signal. The Long-Term Trend Model, which informs our long-term outlook, is on a BUY signal as of 4/11/2017, so our long-term posture is bearish.
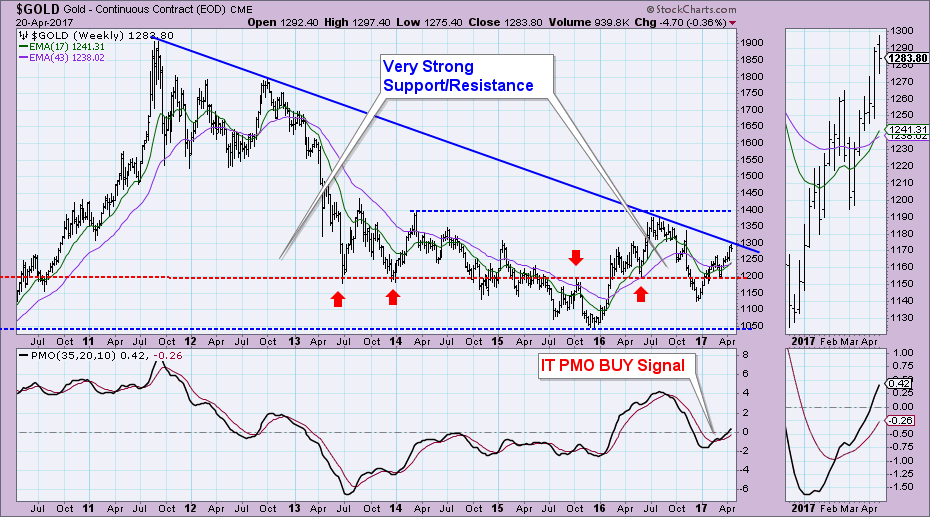
As expected, Gold struggled and was turned away when it reached powerful overhead resistance along horizontal at 1300 and the top of the rising trend channel. I am still bullish intermediate to long term, but short term, we will probably have to endure a pullback toward the bottom of the rising trend channel. There is one more area of overhead resistance and that is visible on the weekly chart along the long-term declining tops trendline.
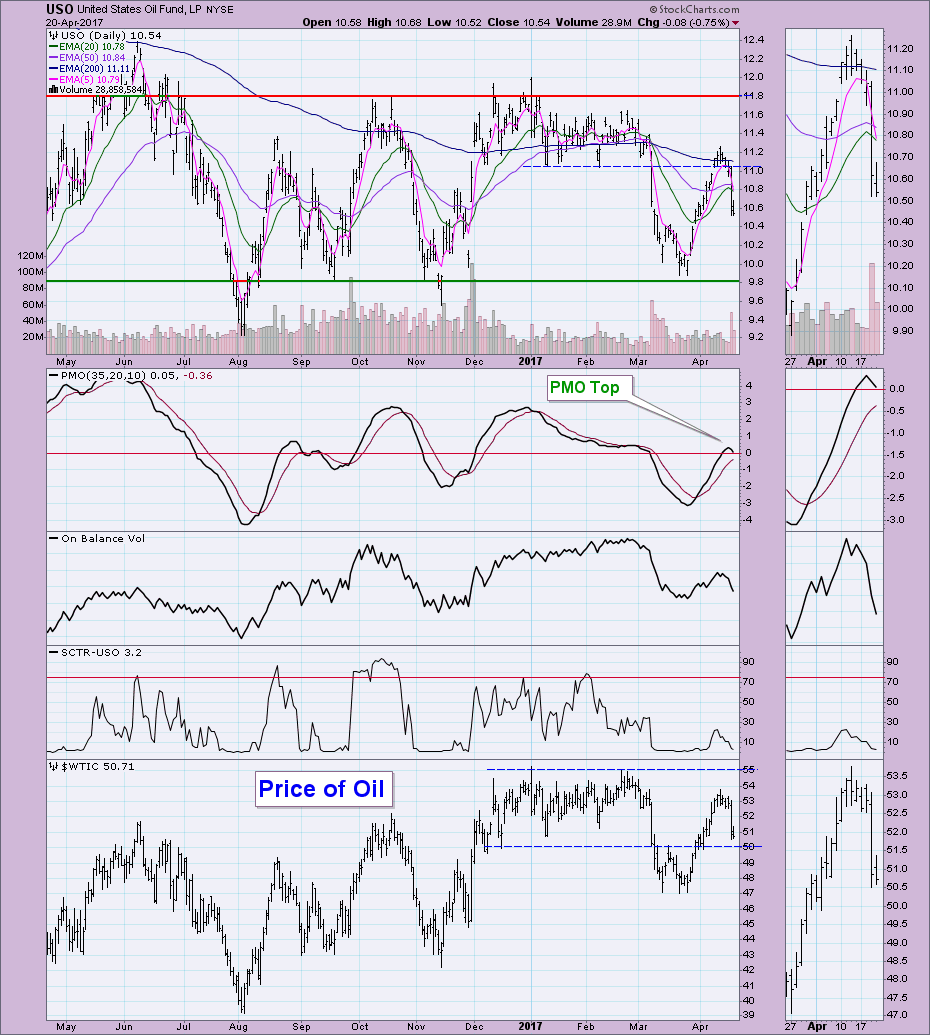
CRUDE OIL (USO): As of 3/8/2017 United States Oil Fund (USO) is on an Intermediate-Term Trend Model Neutral signal. The Long-Term Trend Model, which informs our long-term outlook, is on a SELL signal as of 3/9/2017, so our long-term posture is bearish.
After leap-frogging resistance at $11, USO promptly tanked (no pun intended) losing over half the gains garnered since the March low. We should see a STTM SELL signal tomorrow. The PMO is topping. I would look for a possible test back down in the $9.80 range. For Oil, I'm looking at support between $47 and $50.
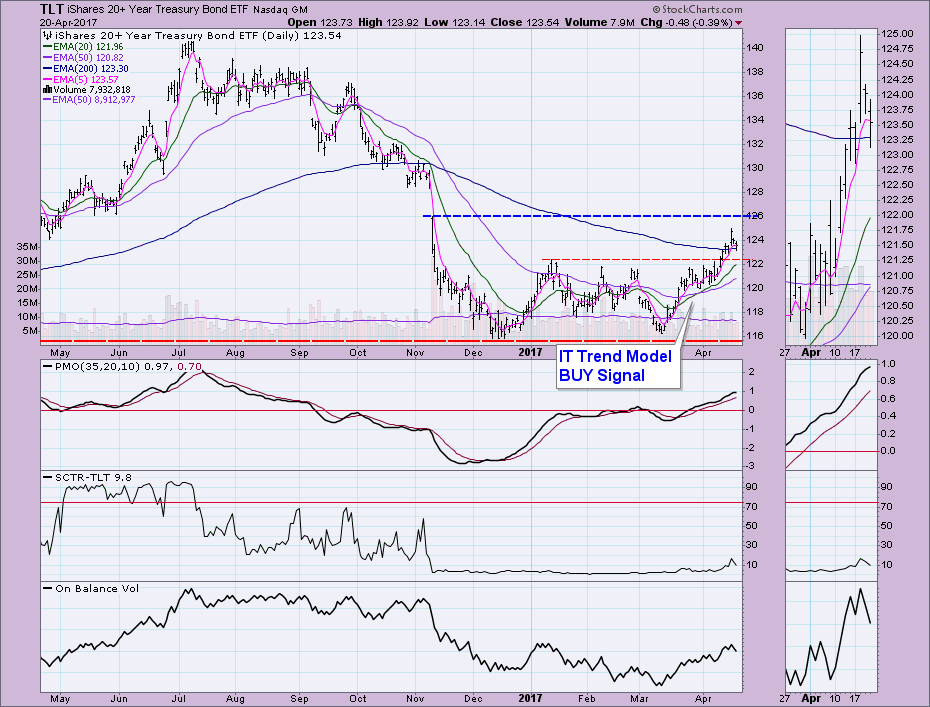
BONDS (TLT): As of 3/31/2017 The 20+ Year T-Bonds ETF (TLT) is on an Intermediate-Term Trend Model BUY signal. The Long-Term Trend Model, which informs our long-term outlook, is on a SELL signal as of 11/17/2016, so our long-term posture is bearish.
TLT is taking a pause after breaking soundly through resistance at the previous 2017 highs. Now that it has reached the bottom of the gap formed in November and is turning back down. It would be nice if support holds at $122, but the PMO is decelerating suggesting that a test of the 20/50-EMAs is next.
The DecisionPoint LIVE Shared ChartList has launched! Click on the link and you'll find webinar and blog chart spotlights. Be sure and bookmark it!
Technical Analysis is a windsock, not a crystal ball.
Happy Charting!
- Erin


