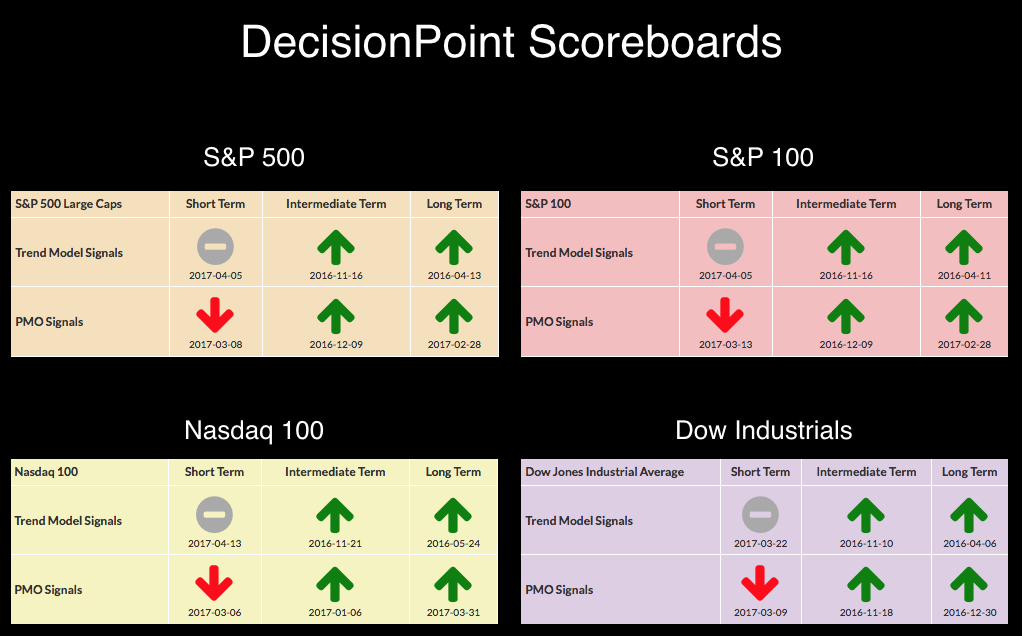
 No changes on the DecisionPoint Scoreboards. You'll find these boards in the DP Chart Gallery. However, we did get a new Intermediate-Term Trend Model (ITTM) Neutral signal on the equal-weight Financials ETF (RYF).
The purpose of the DecisionPoint Alert Daily Update is to quickly review the day's action, internal condition, and Trend Model status of the broad market (S&P 500), the nine SPDR Sectors, the U.S. Dollar, Gold, Crude Oil, and Bonds. To ensure that using this daily reference will be quick and painless, we are as brief as possible, and sometimes we let a chart speak for itself.
SIGNALS: Here we include charts of any important signal changes triggered today by our Intermediate-Term Trend Model.
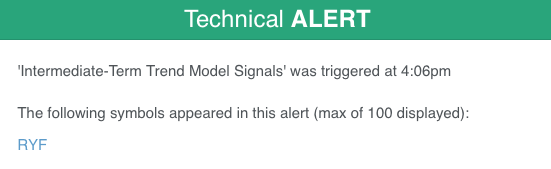
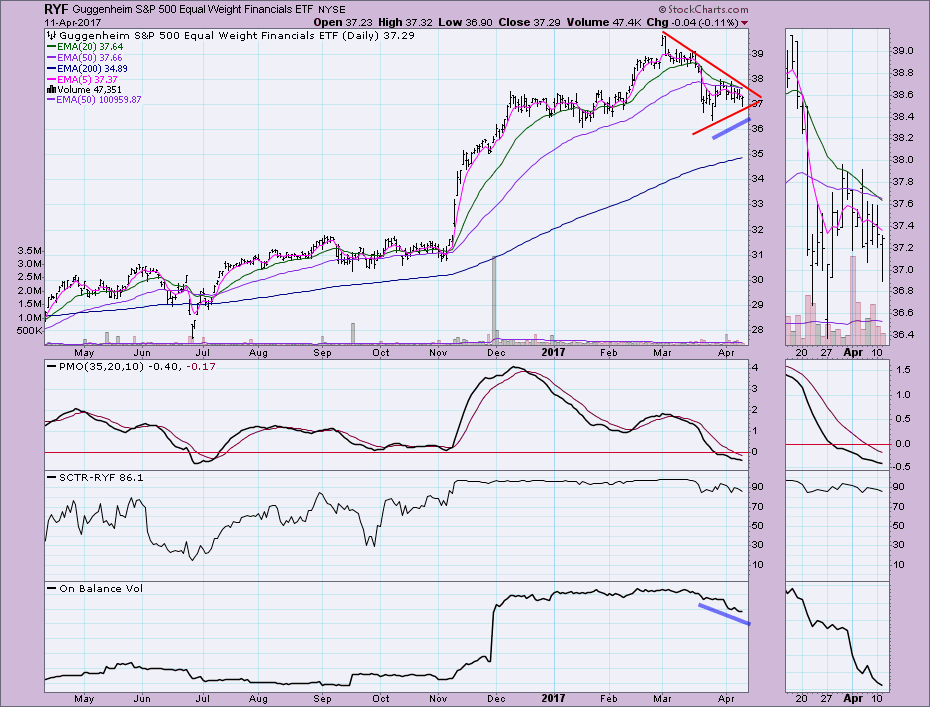
As noted above, I received a Technical Alert in my email box letting me know there was a 20/50-EMA crossover. It was a negative crossover but since the 50-EMA is still above the 200-EMA, it is a Neutral signal, not a SELL signal. There are other problems here too. The PMO is in decline, although getting oversold, and there is a clear negative divergence between the OBV and price bottoms. The chart pattern is a symmetrical triangle which is considered a continuation pattern, meaning that the previous trend will remain intact. Given the negative indicators, I would be looking for a breakdown right now.
NOTE: Mechanical trading model signals define the implied bias of the price index based upon moving average relationships, but they do not necessarily call for a specific action. They are information flags that should prompt chart review. Further, they do not call for continuous buying or selling during the life of the signal. For example, a BUY signal will probably return the best results if action is taken soon after the signal is generated. Additional opportunities for buying may be found as price zigzags higher, but the trader must look for optimum entry points. Conversely, exit points to preserve gains (or minimize losses) may be evident before the model mechanically closes the signal.
STOCKS: Based upon a 11/15/2016 Intermediate-Term Trend Model BUY signal, our current intermediate-term market posture for the S&P 500 (SPY) is bullish. The Long-Term Trend Model, which informs our long-term outlook, is on a BUY signal as of 4/1/2016 so our long-term posture is bullish.
The 10-minute bar chart shows the breakdown this morning which is concerning, but buyers were able to clear some of those losses. However, they weren't able to get price above the resistance along the rising bottoms trendline.
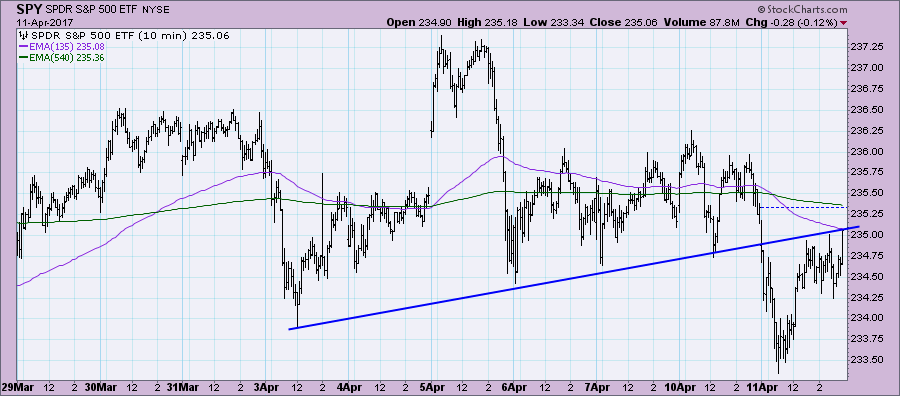
The SPY has loosely formed a symmetrical triangle which would imply a breakout above declining tops resistance. However, there is a fairly clear negative divergence between OBV bottoms and price bottoms. The PMO is still in decline. I do like that support held along the intermediate-term rising bottoms trendline, but I am concerned that it will hold up. Notice the 5-EMA crossing below the 20-EMA that triggered a Short-Term Trend Model Neutral signal.
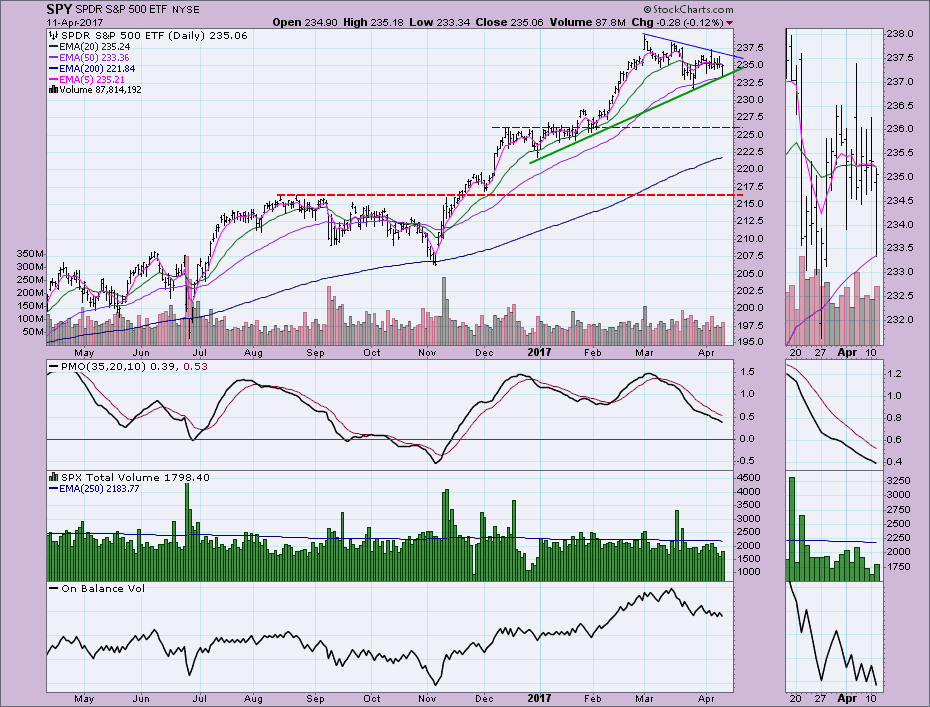
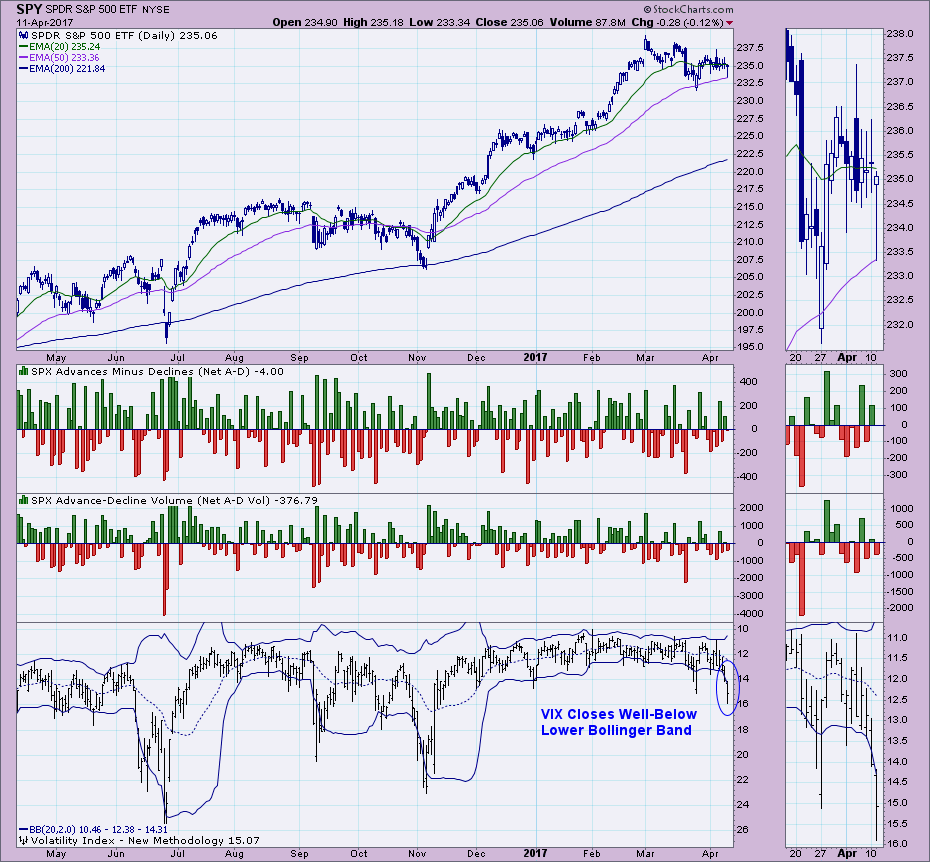
Ultra-Short-Term Indicators: Although there are bearish indications on the daily chart, the VIX has closed for a second time below the lower Bollinger Band. This is nearly always followed by a rally pop in the next day or two.
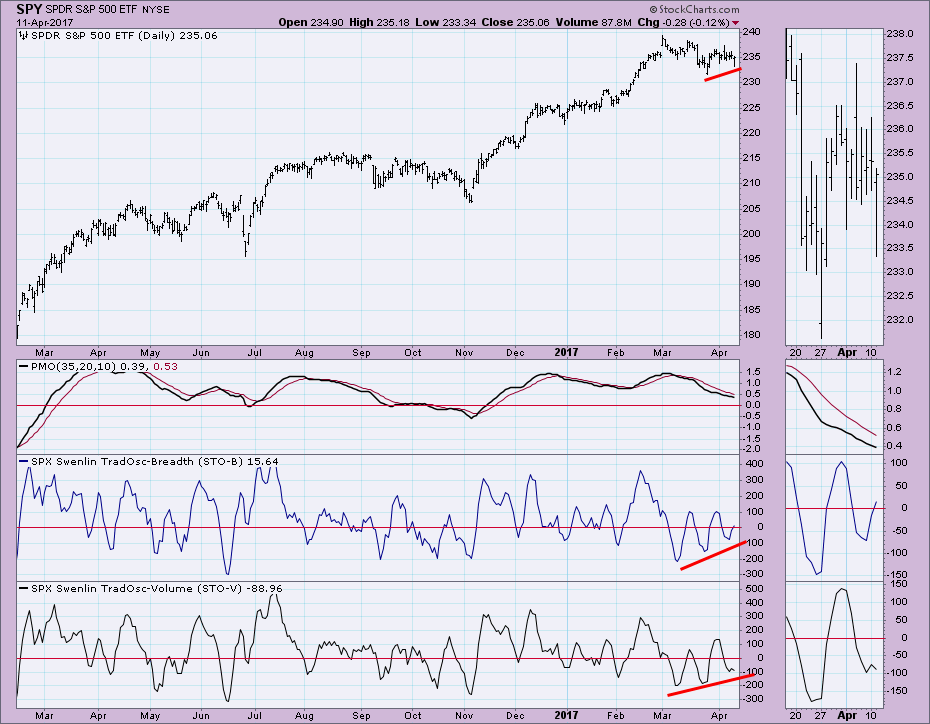
Short-Term Indicators: These indicators are mixed. The STO-B is rising nicely, but there is hesitation in the STO-V. I also note a bullish confirmation on these indicators bottoms.
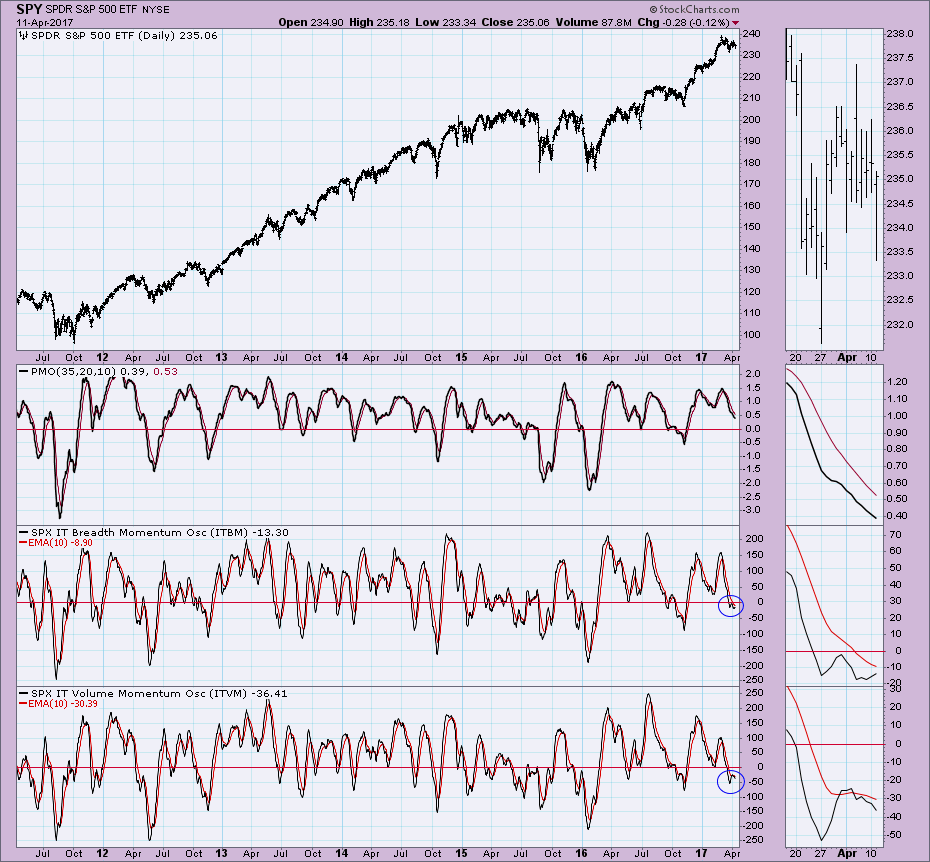
Intermediate-Term Indicators: These indicators are mixed as well with the ITVM falling after a failed attempt at a positive crossover. Both seem to be ready to bottom, but seeing divergent readings is concerning.
Conclusion: Putting it all together, I would expect to see a rally pop off the rising bottoms trendline that will likely be followed with a decline and breakdown. The VIX suggests a pop, but volume indicators are negative and that tells me that volume isn't confirming the positive rise in the price-based indicators (STO-B and ITBM). I suspect we will see lower prices by week's end.
**Don't miss the DecisionPoint Alert Daily Commentary! Click on "Email Updates" at the end of this blog page to be notified as soon as it's published at the end of the market day.**
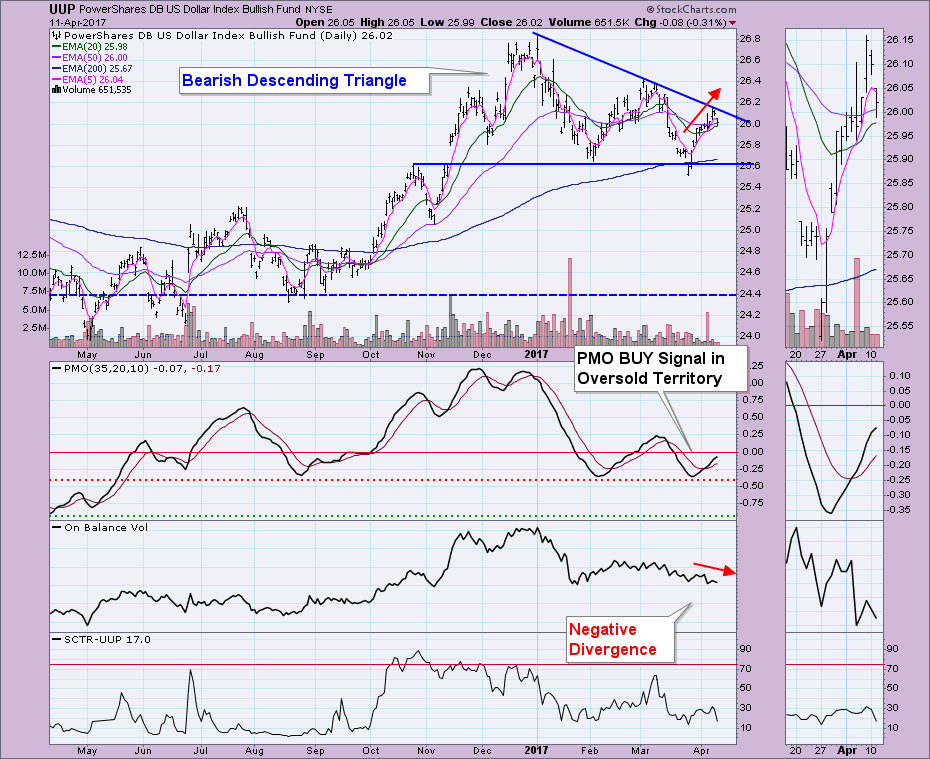
DOLLAR: As of 3/21/2017 the US Dollar Index ETF (UUP) is on an Intermediate-Term Trend Model Neutral signal. The Long-Term Trend Model, which informs our long-term outlook, is on a BUY signal as of 10/17/2016, so our long-term posture is bullish.
How fascinating that price hit declining tops line resistance and was turned away. This third top convinces me that this is a bearish descending triangle. The OBV is showing a negative divergence and the SCTR has turned down. The PMO is on what looks like a good BUY signal, but note that it is already trying to decelerate on today's decline. I'd look for a test of support at $25.60.
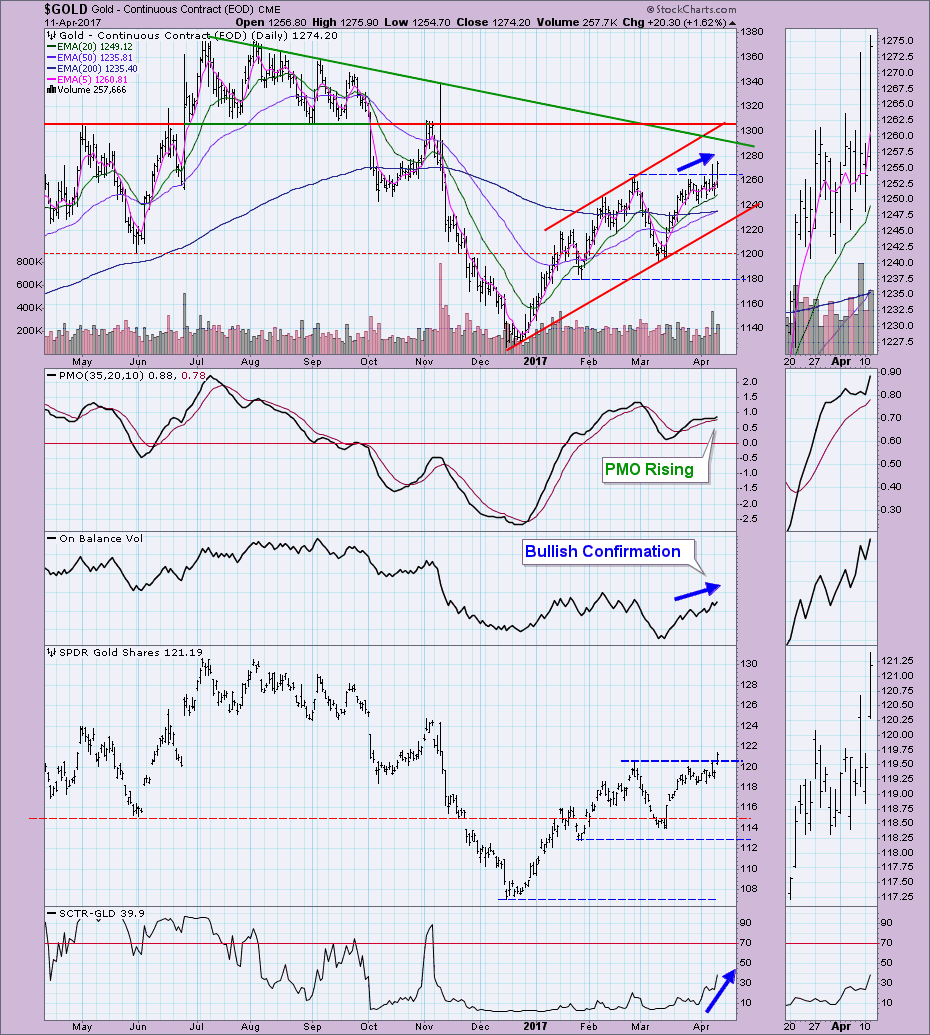
GOLD: As of 2/3/2016 Gold is on an Intermediate-Term Trend Model BUY signal. The Long-Term Trend Model, which informs our long-term outlook, is on a SELL signal as of 11/25/2016, so our long-term posture is bearish.
A weak dollar favors Gold. The indicators are backing this up as well as the solid breakouts on both $GOLD and GLD. My main concern right now is the looming convergent resistance at the declining tops trendline, top of rising trend channel and horizontal resistance at about 1300. If the Dollar dives, resistance could be overcome, but it has held up for a very long time so Gold can't rely on the Dollar to push it past resistance. Buyers need to get in there.
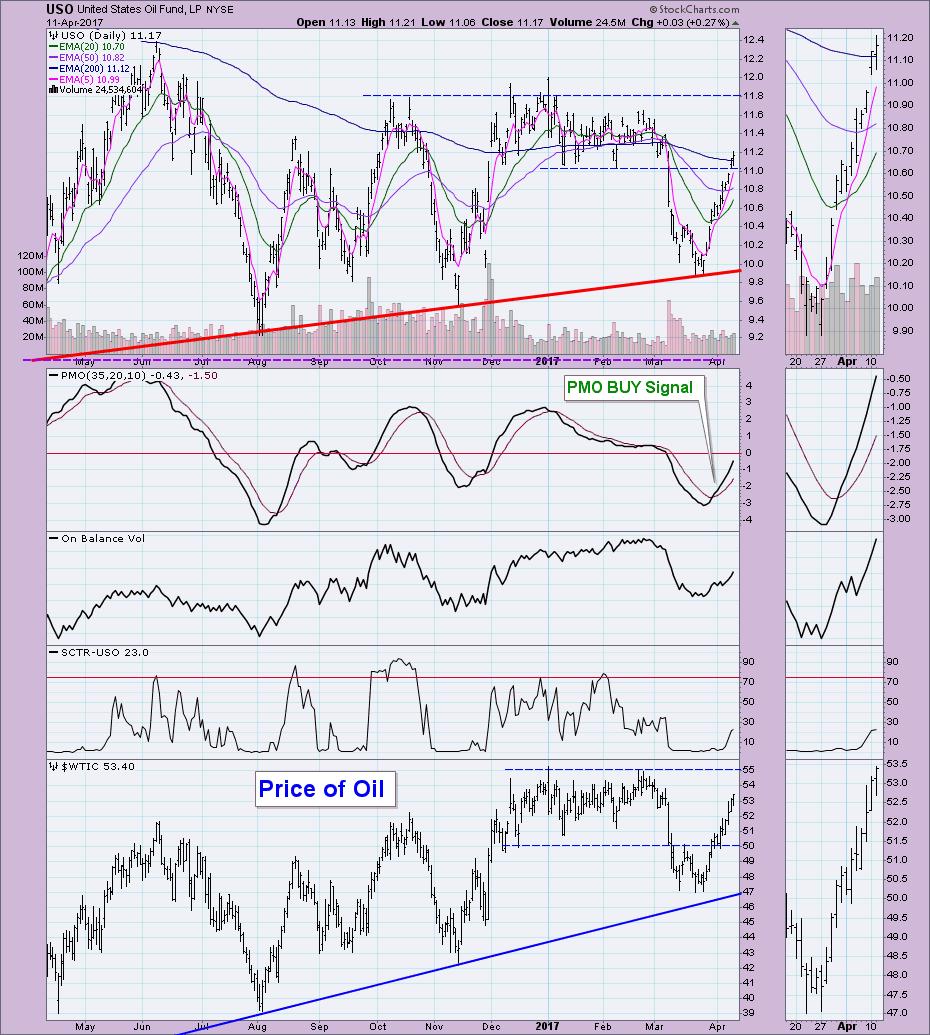
CRUDE OIL (USO): As of 3/8/2017 United States Oil Fund (USO) is on an Intermediate-Term Trend Model Neutral signal. The Long-Term Trend Model, which informs our long-term outlook, is on a SELL signal as of 3/9/2017, so our long-term posture is bearish.
Oil has taken off after finding strong support along the rising bottoms trendline. I like the gap up yesterday that took price above resistance and today's follow-through keeping price above that resistance today is bullish. It appears that USO is ready to take on resistance in the $11.60 - $11.80 range.
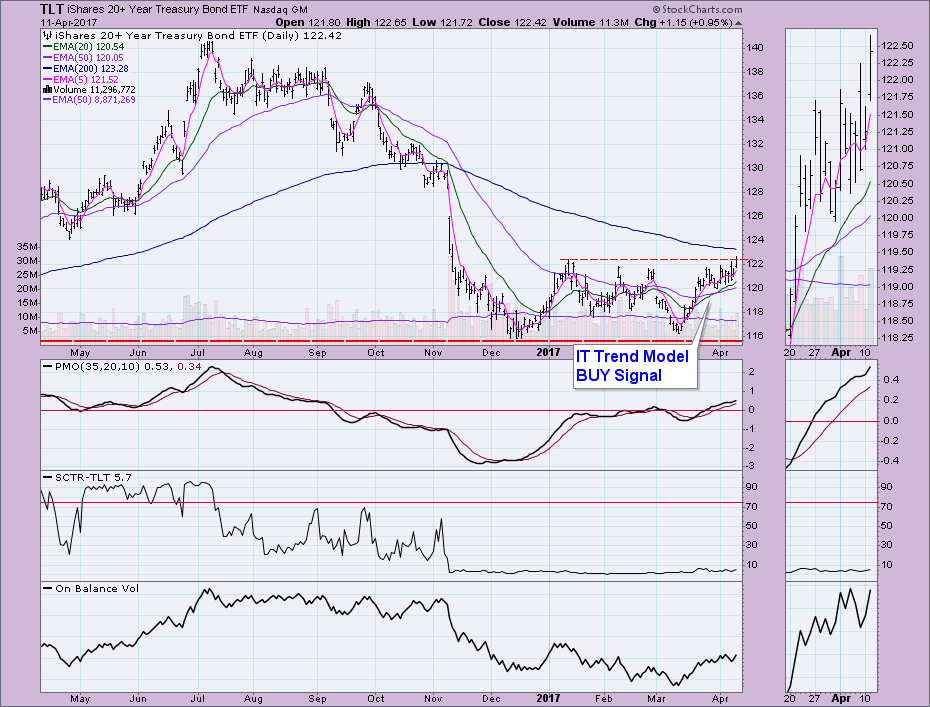
BONDS (TLT): As of 9/15/2016 The 20+ Year T-Bonds ETF (TLT) is on an Intermediate-Term Trend Model Neutral signal. The Long-Term Trend Model, which informs our long-term outlook, is on a SELL signal as of 11/17/2016, so our long-term posture is bearish.
We finally saw a small breakout above previous tops. I like the rising PMO and I have to say that the OBV is confirming the rally as bottoms and tops are in line with price bottoms and tops. I'm looking for the next move to take price to about $126 where the gap down occurred in November.
The DecisionPoint LIVE Shared ChartList has launched! Click on the link and you'll find webinar and blog chart spotlights. Be sure and bookmark it!
Technical Analysis is a windsock, not a crystal ball.
Happy Charting!
- Erin


