 I realized that I haven't really reviewed the small and mid-cap ETFs in some time. You'll find these charts in the DecisionPoint LIVE shared ChartList if you want to keep an eye on them with my annotations. The chart patterns for these ETFs aren't mimicking the large-caps, but they have managed to hold on to key support. It is always important to see small-caps do well in concert with large-caps. For obvious reasons, you need everyone participating if you're going to have a strong bull market rally. There are still some problems with these charts so I don't think they support a big rally right now. Good news is they don't support a correction either.
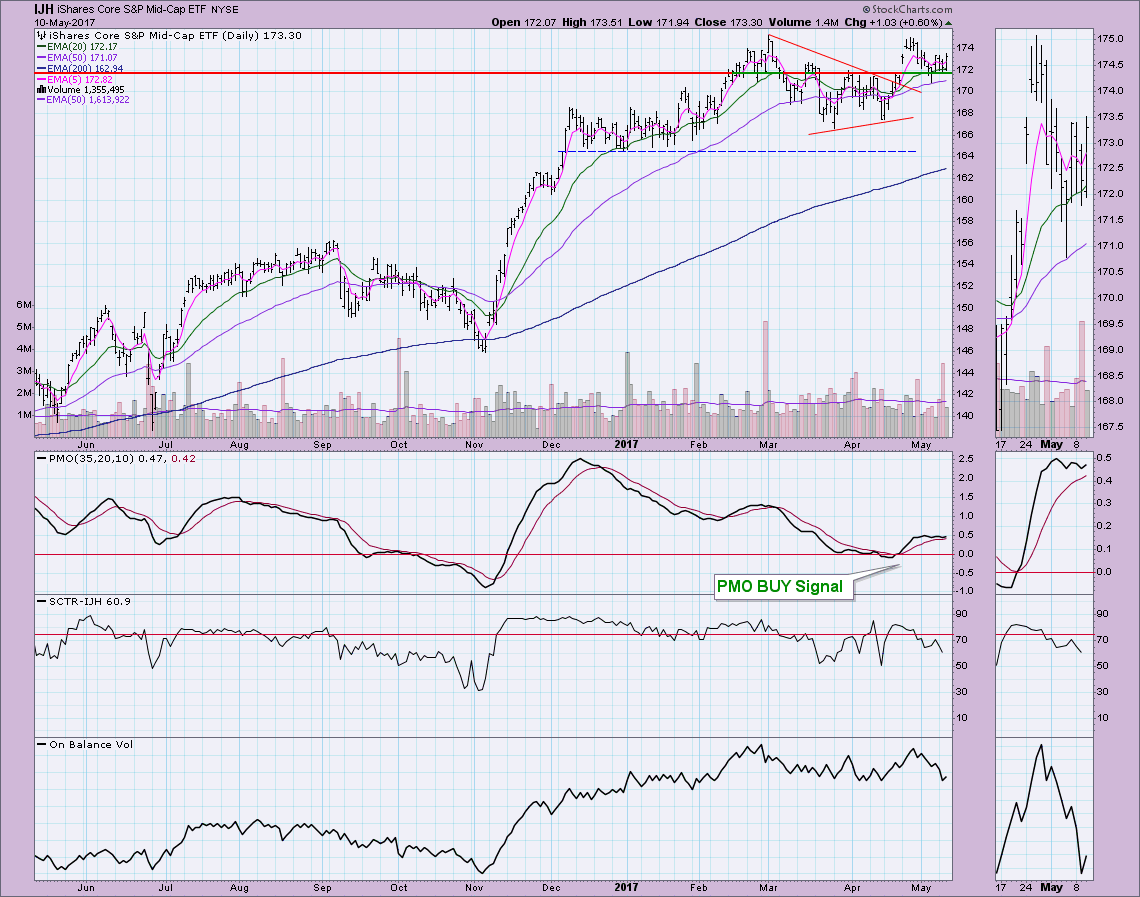
We can see that price hit overhead resistance on IJH at the February high and was then turned away. Instead of consolidating sideways as we've seen on the large-caps, the mid-caps experienced a decline. Good news is that when support was hit, price rallied to stay above it. The Price Momentum Oscillator (PMO) has been twitching which is characteristic of a period of indecision. It remains above which is positive, but the SCTR is now losing steam and I don't see anything positive on the OBV right now. I do think it speaks to internal strength that it has been able to hold support despite some very high volume negative days.
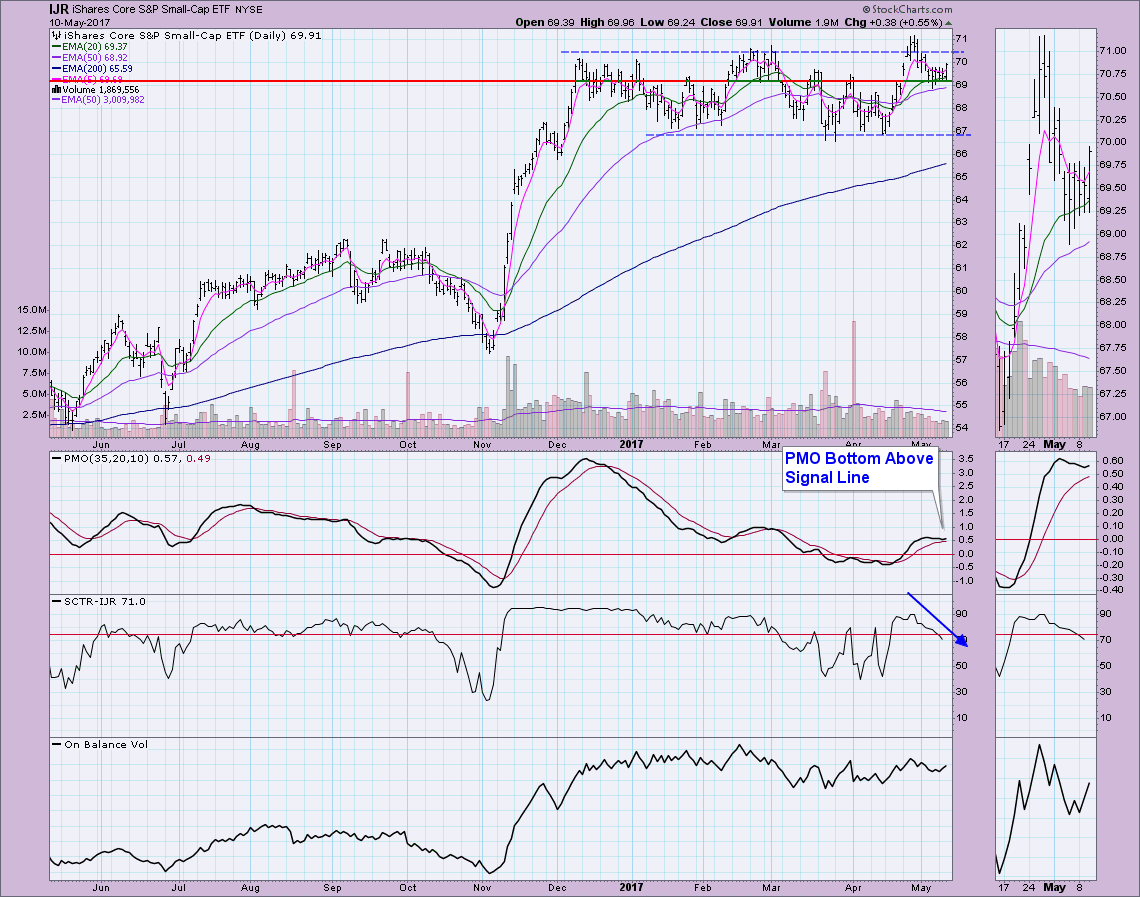
The S&P 600 ETF (IJR) has a similar pattern although its last price high broke above resistance at previous all-time highs. Support was found around $69 and now we have a PMO that has turned up above its signal line which is bullish. The OBV looks better than IJH's, but nothing to write home about. The SCTR is falling and has moved out of the 'hot zone'. Probably looking at more sideways movement in the coming week.
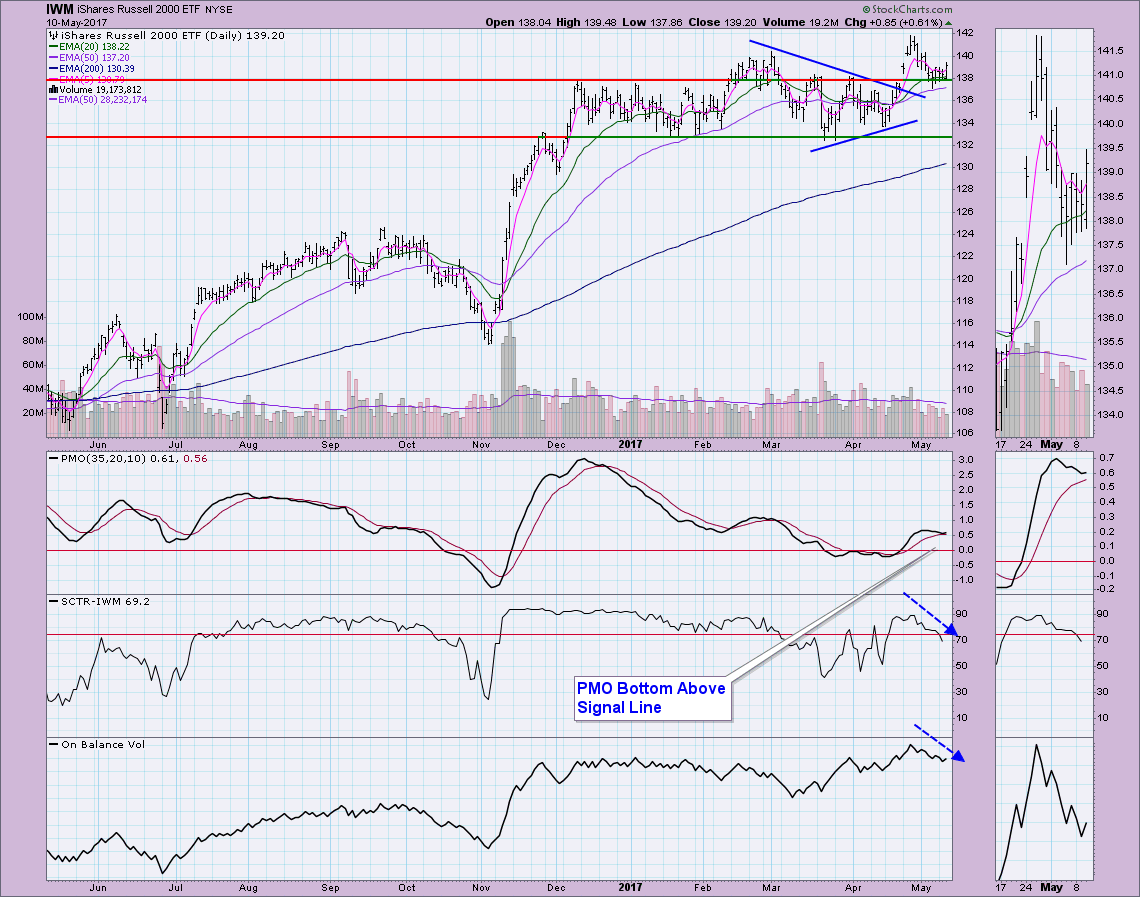
You'll notice on the small-cap charts, that price broke out above symmetrical triangle patterns. This was expected as these are continuation patterns, meaning price should breakout in the direction it was traveling before the formation of the triangle. The breakouts didn't hold very long, but again, price has found support along previous all-time highs. I like the PMO turning up above the signal line like the others, but again, the SCTR and OBV don't support a big rally right now.
The DecisionPoint LIVE Shared ChartList is available now! Click on the link and you'll find all your favorite DP charts all annotated! Be sure and bookmark it!
Technical Analysis is a windsock, not a crystal ball.
Happy Charting!
- Erin


