
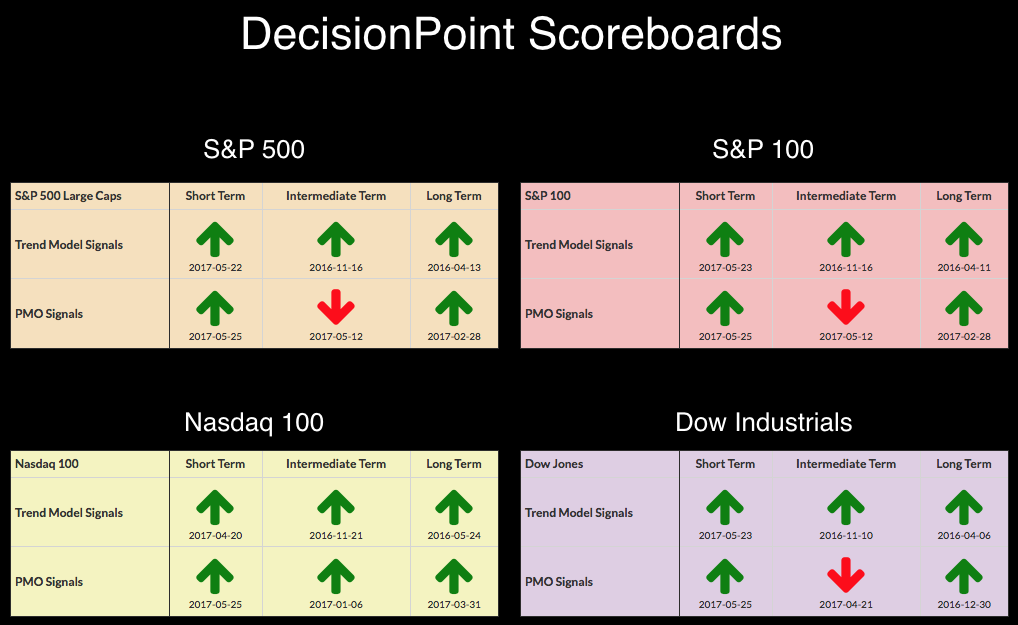
No new changes to report today. Although we are seeing BUY signals on all of the DecisionPoint Scoreboards, the short-term picture is not that bullish according to our other market indicators.
The purpose of the DecisionPoint Alert Daily Update is to quickly review the day's action, internal condition, and Trend Model status of the broad market (S&P 500), the nine SPDR Sectors, the U.S. Dollar, Gold, Crude Oil, and Bonds. To ensure that using this daily reference will be quick and painless, we are as brief as possible, and sometimes we let a chart speak for itself.
SIGNALS: Here we include charts of any important signal changes triggered today by our Intermediate-Term Trend Model.
NO SIGNAL CHANGES TO REPORT.
NOTE: Mechanical trading model signals define the implied bias of the price index based upon moving average relationships, but they do not necessarily call for a specific action. They are information flags that should prompt chart review. Further, they do not call for continuous buying or selling during the life of the signal. For example, a BUY signal will probably return the best results if action is taken soon after the signal is generated. Additional opportunities for buying may be found as price zigzags higher, but the trader must look for optimum entry points. Conversely, exit points to preserve gains (or minimize losses) may be evident before the model mechanically closes the signal.
STOCKS
IT Trend Model: BUY as of 11/15/2016
LT Trend Model: BUY as of 4/1/2016
The market has taken a long pause. Market action over the past three days has been a snooze.
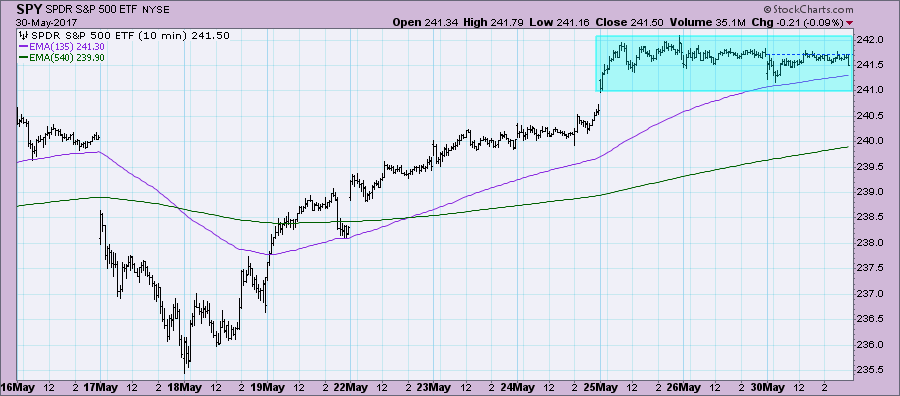
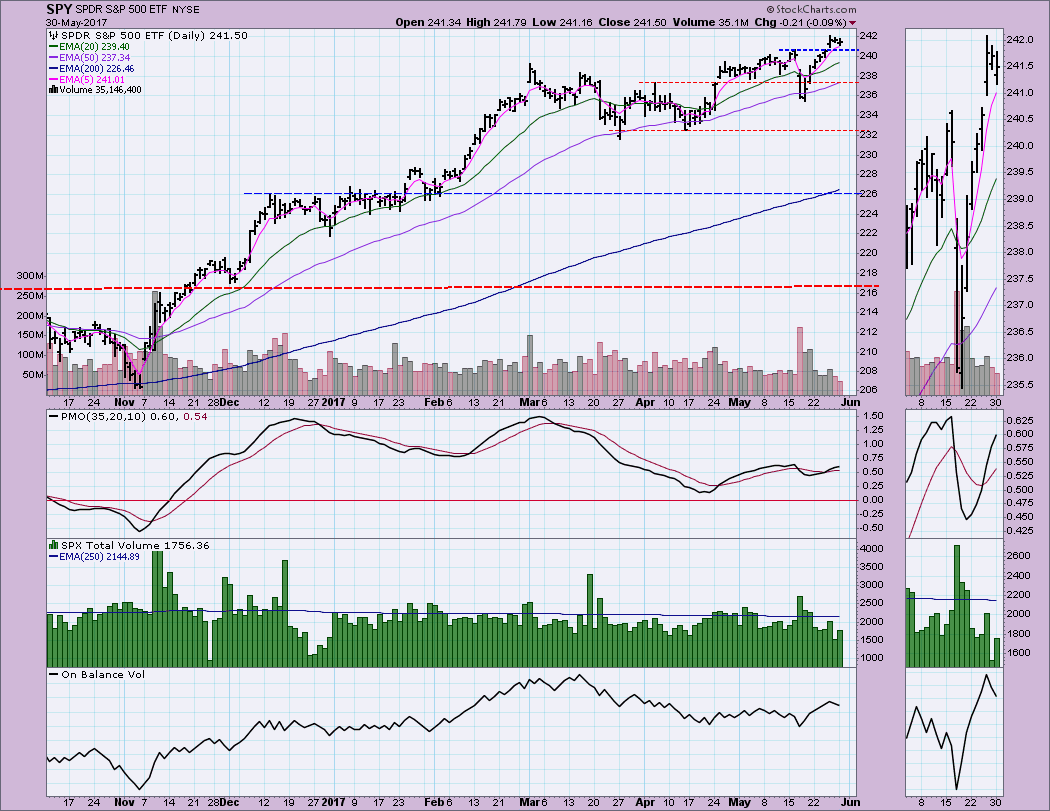
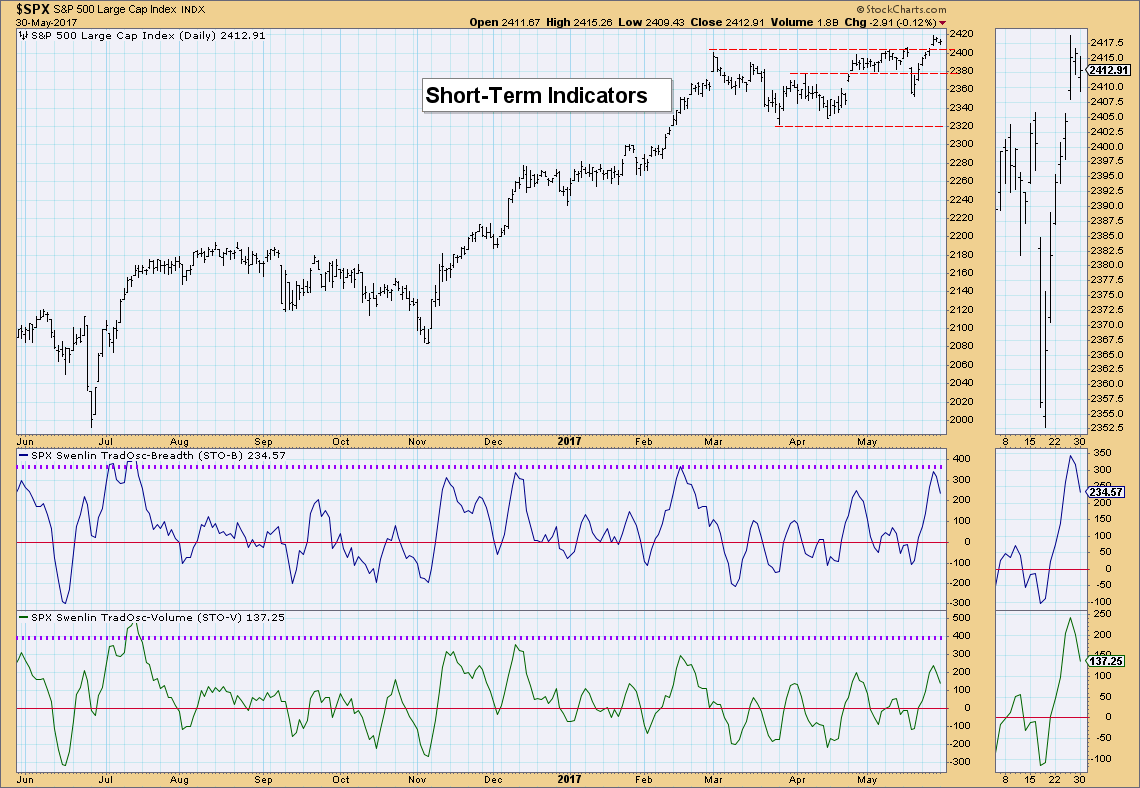
Since breaking above overhead resistance at previous all-time highs, price has halted the advance. Support is holding up, but I'm seeing a possible island reversal setting up. After the gap up, price has clustered in an "island". If this pattern were to execute, we would see a closure of that gap and a breakdown. The PMO is still rising but might be showing signs of deceleration.
Ultra-Short-Term Indicators: Today we saw decliners outnumber advancers. This is another sign that there is short-term weakness. The VIX is staying in bullish territory above the average. I'm watching for ultra-low readings that push higher toward the upper Bollinger Band.
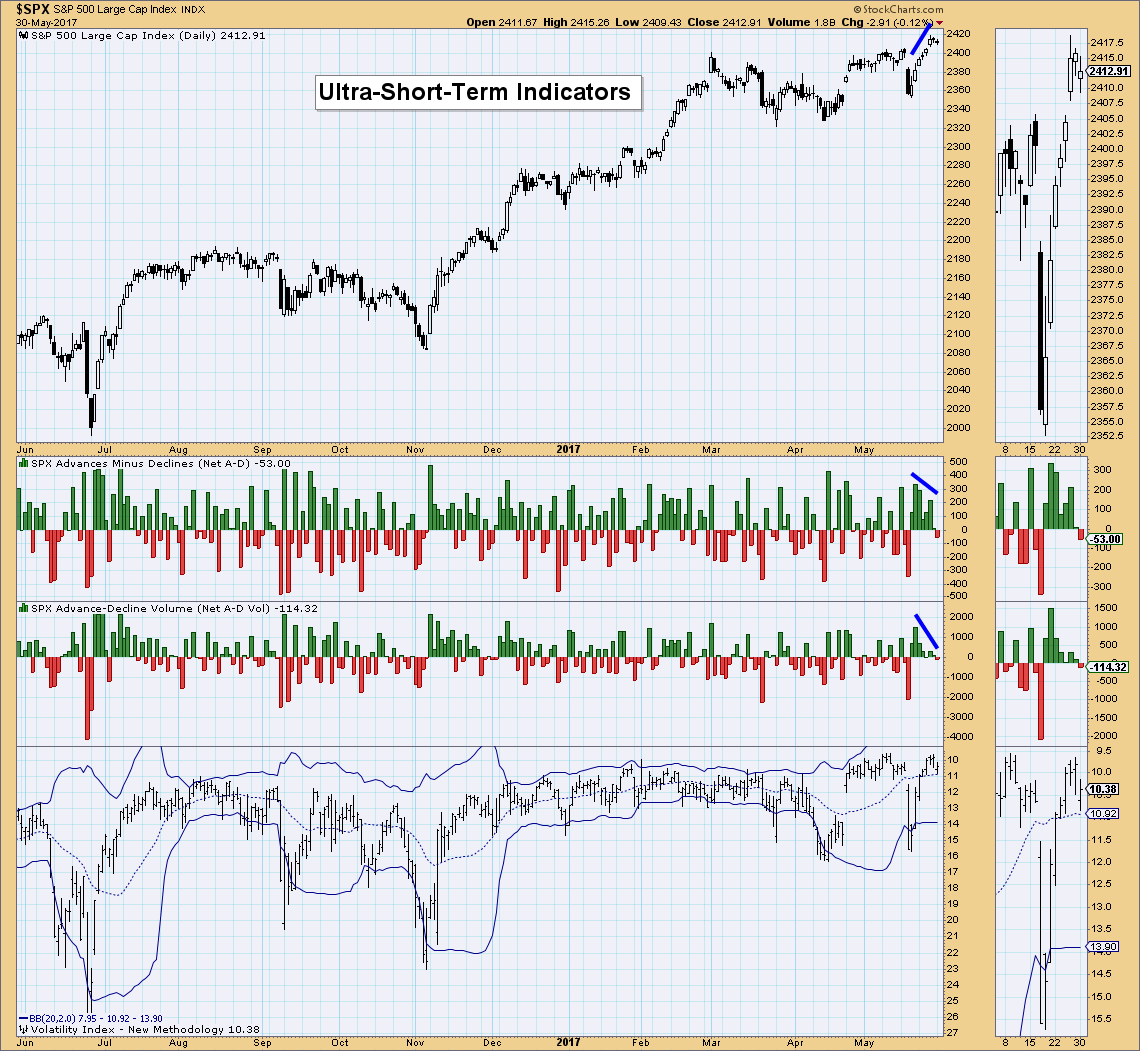
Short-Term Indicators: These indicators have me concerned. They reached overbought extremes and are now pointing straight down. Typically these indicators will unwind through price declines.
Intermediate-Term Indicators: The PMO configuration suggests a decline is ahead. However, it is technically rising again and we are seeing healthy readings on the ITBM and ITVM.
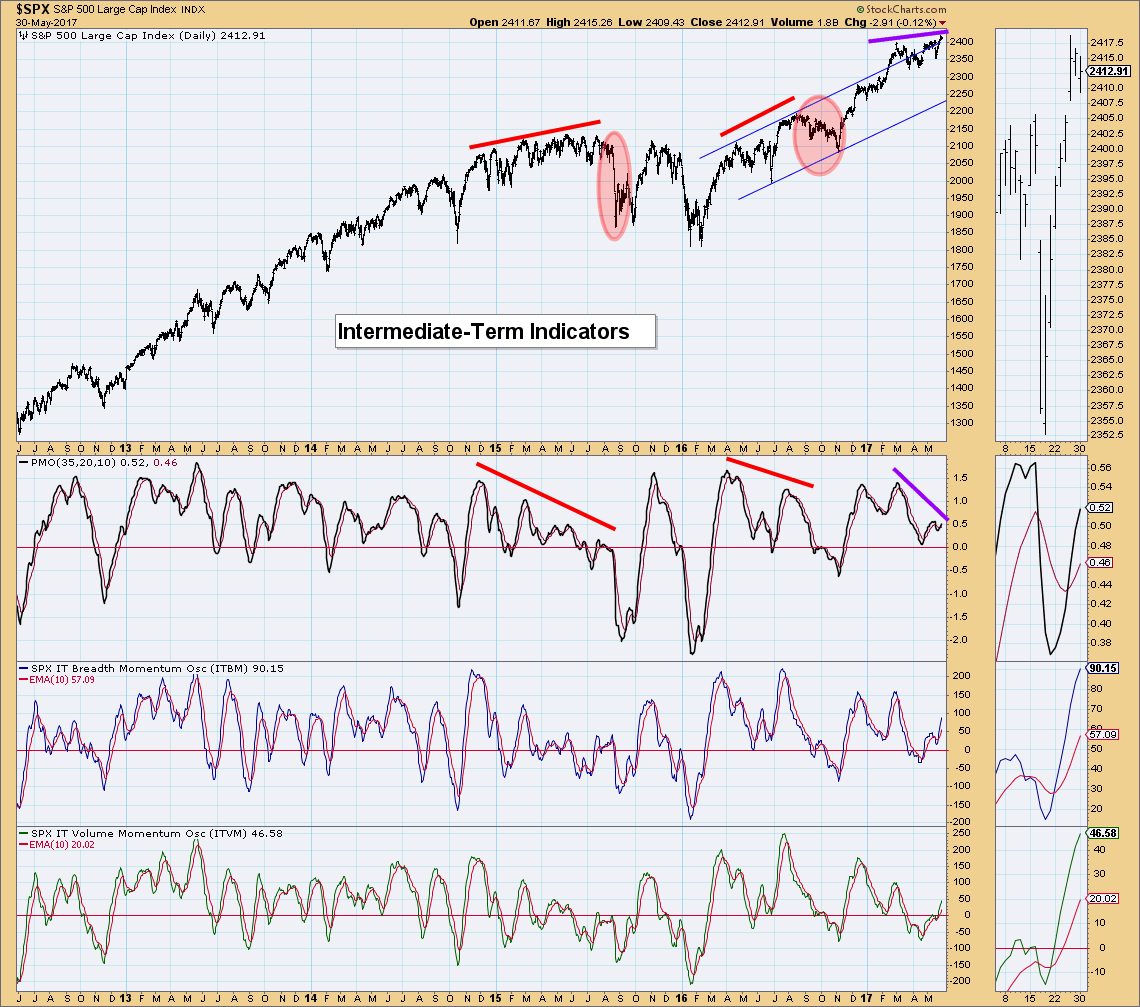
Conclusion: The shorter-term indicators are bearish right now and do suggest a pullback or continuation of consolidation. Given the positive intermediate-term indicators, I'm not looking for a correction.
DOLLAR
IT Trend Model: NEUTRAL as of 3/21/2016
LT Trend Model: BUY as of 10/17/2016
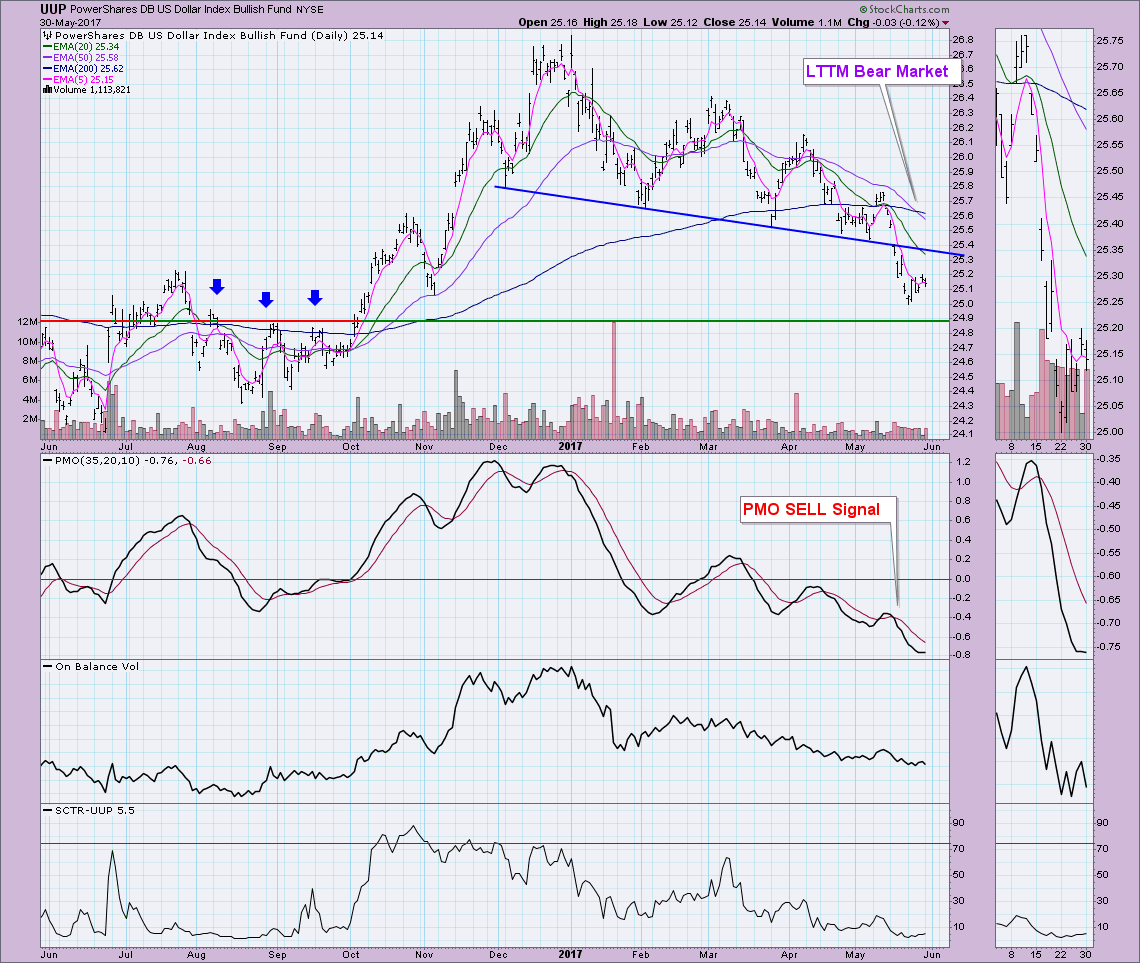
The Dollar is stalling before it even reaches overhead resistance. The new Long-Term Trend Model SELL signal is concerning, but indicators are so oversold and both the SCTR and PMO appear to be bottoming.
GOLD
IT Trend Model: BUY as of 5/22/2017
LT Trend Model: BUY as of 4/12/2017
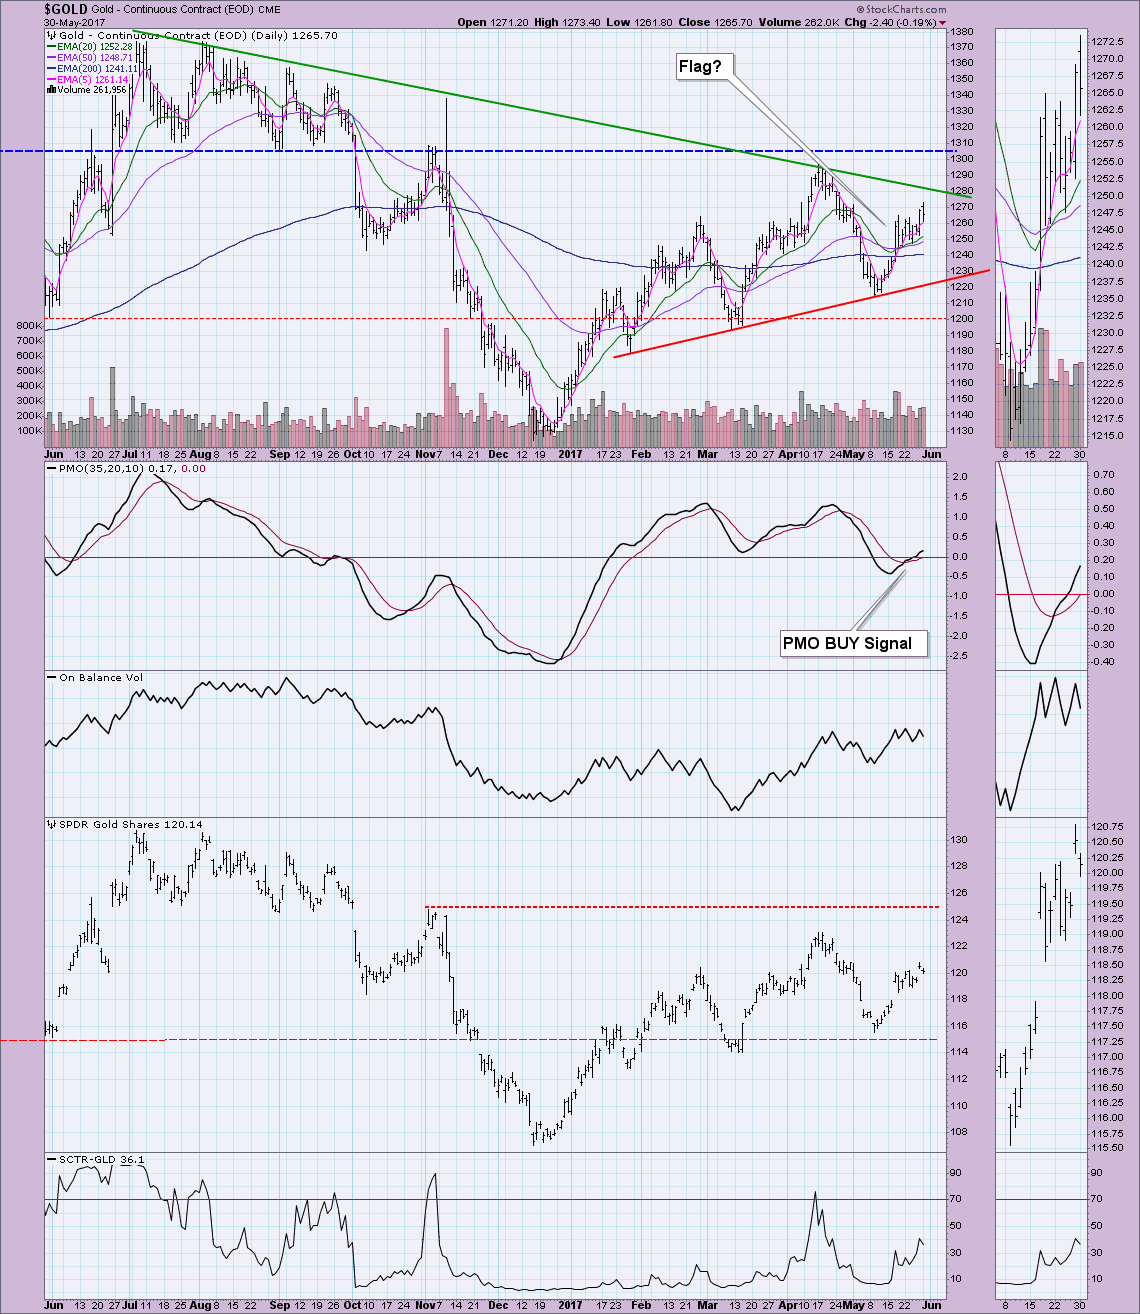
I suspect we have just seen the execution of a bullish flag formation. The minimum upside target would be around $1310 (or right on overhead resistance). The OBV has not confirmed this bullish breakout as last OBV tops are declining and price tops are rising. I'm watching the $1280 area of overhead resistance. It is a critical level that must be broken. The long-term declining tops trendline (green) has been in effect since 2012. A breakout would very meaningful in the short and longer terms.
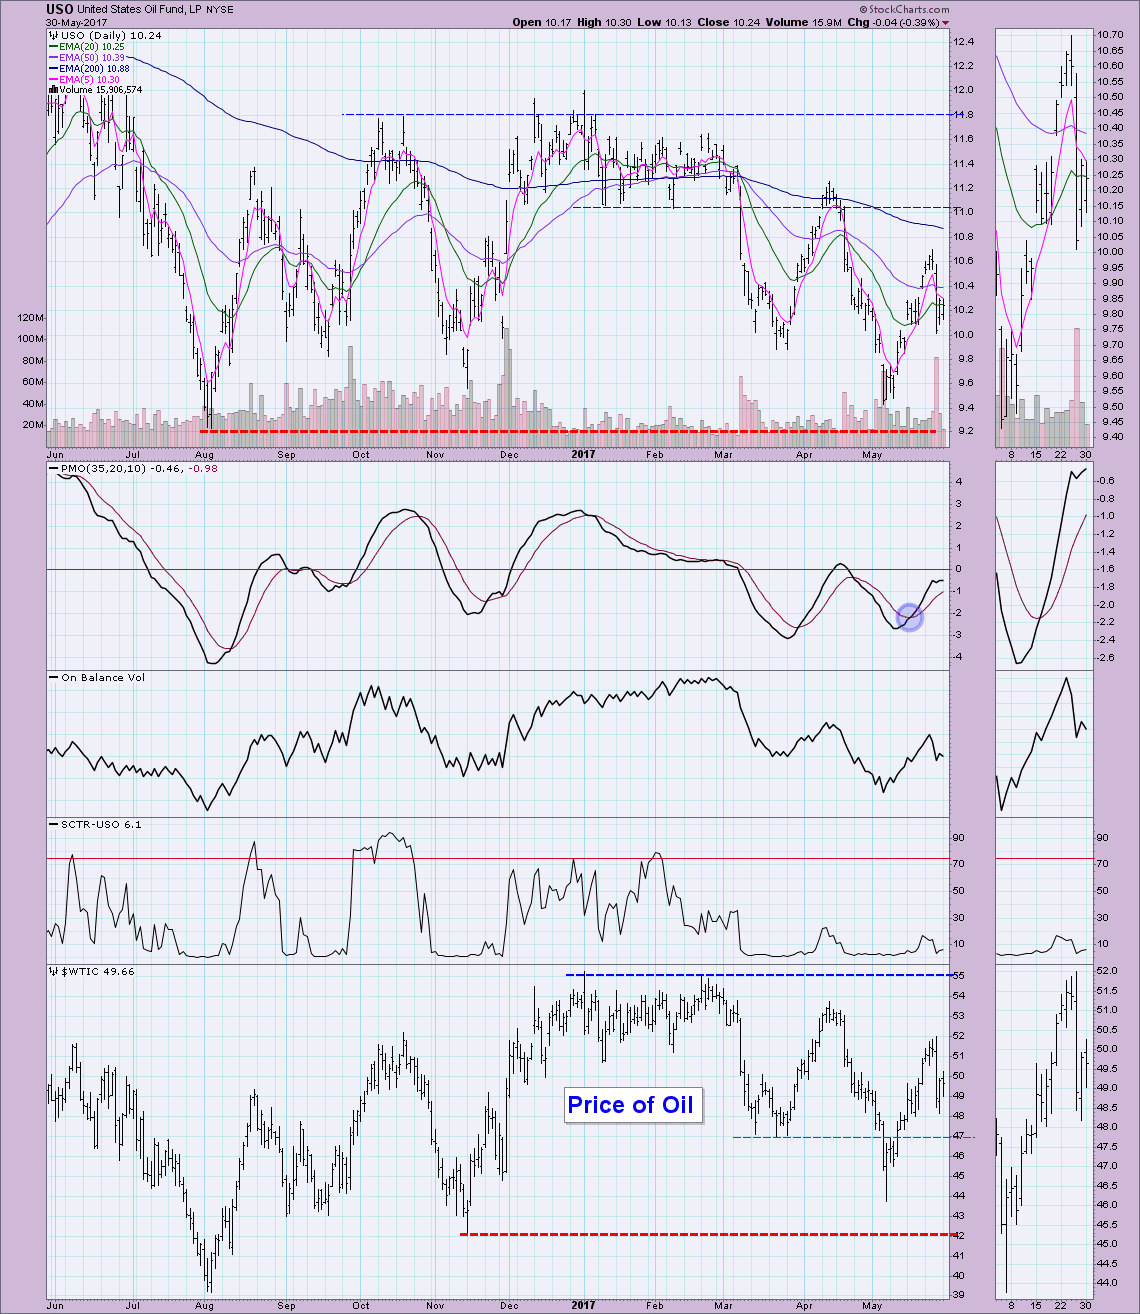
CRUDE OIL (USO)
IT Trend Model: NEUTRAL as of 3/8/2017
LT Trend Model: SELL as of 3/9/2017
Oil ended its bull market with a bang last Thursday. It is encouraging to see the PMO turn back up, but that is the only positive I see here right now. The $10 level could be maintained as support, but I'd be prepared for price to move lower to around $9.40 - $9.80.
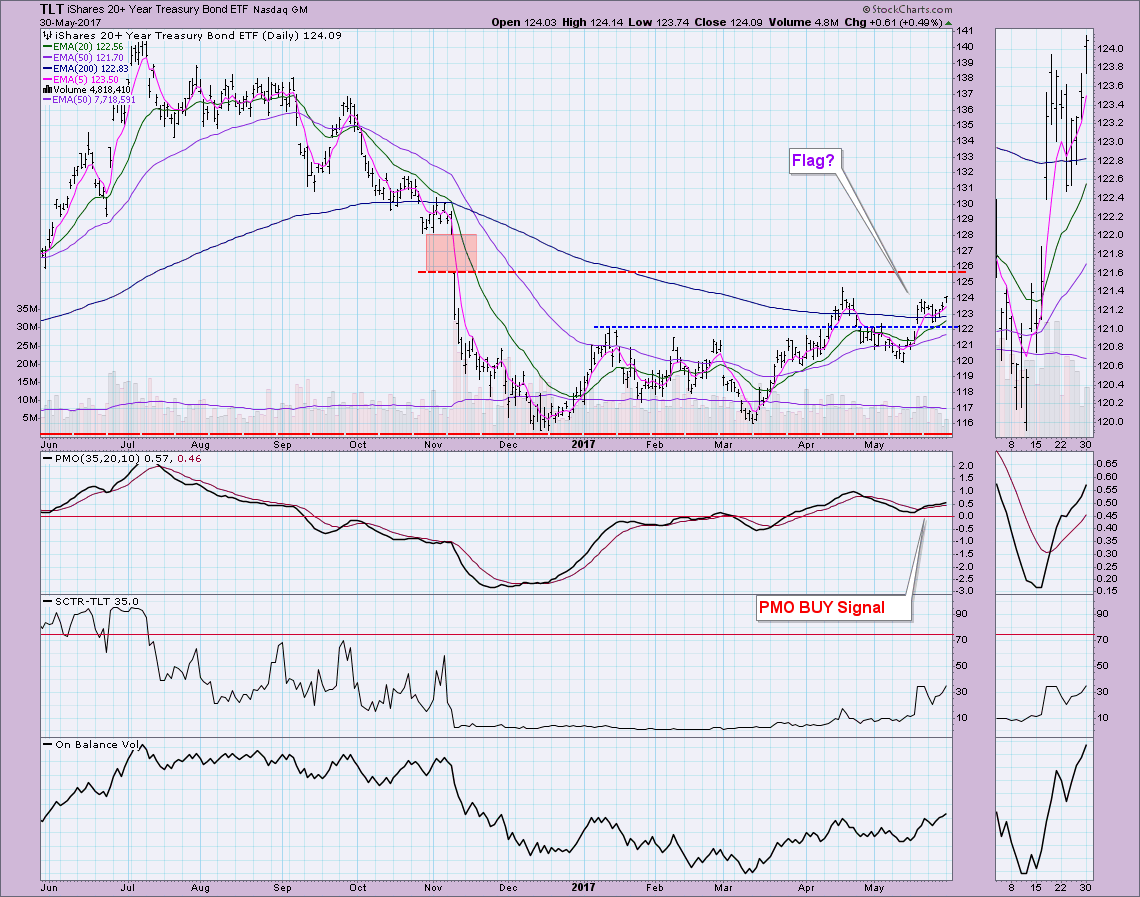
BONDS (TLT)
IT Trend Model: BUY as of 3/31/2017
LT Trend Model: SELL as of 11/17/2016
If the current price pattern is a flag, then technically today it broke out. The minimum upside target for this flag would have price close the gap around $128. Indicators are rising and that is positive. Next on the agenda is to get that 50-EMA above the 200-EMA to trigger a LT Trend Model BUY signal. As long as the 50-EMA is below the 200-EMA, TLT is in a bear market.
Helpful DecisionPoint Links:
DecisionPoint Shared ChartList and DecisionPoint Chart Gallery
Price Momentum Oscillator (PMO)
Swenlin Trading Oscillators (STO-B and STO-V)
Technical Analysis is a windsock, not a crystal ball.
Happy Charting!
- Erin
**Don't miss DecisionPoint Commentary! Add your email below to be notified of new updates"**


