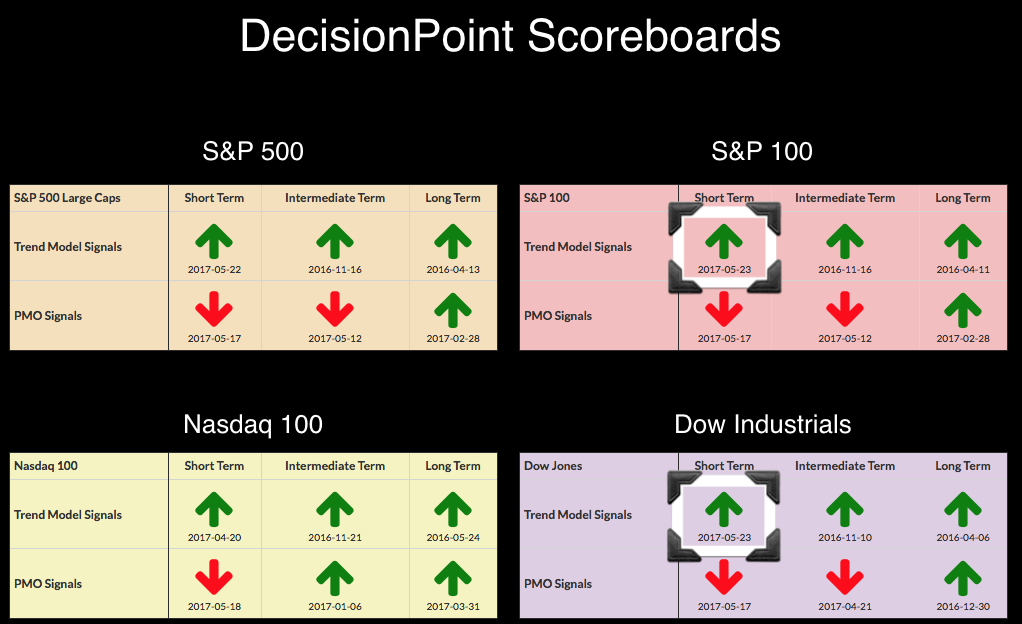
 The market recovery since Wednesday has been remarkable. With this steady rally, last week's bearish signals are being erased. I did mention in yesterday's blog that ST Trend Model signals will whipsaw quite a bit but they do help us to characterize the market in the very-short term. These new BUY signals could be considered bullish confirmations of the new rally higher.
The purpose of the DecisionPoint Alert Daily Update is to quickly review the day's action, internal condition, and Trend Model status of the broad market (S&P 500), the nine SPDR Sectors, the U.S. Dollar, Gold, Crude Oil, and Bonds. To ensure that using this daily reference will be quick and painless, we are as brief as possible, and sometimes we let a chart speak for itself.
SIGNALS: Here we include charts of any important signal changes triggered today by our Intermediate-Term Trend Model.
No new signals to report.
NOTE: Mechanical trading model signals define the implied bias of the price index based upon moving average relationships, but they do not necessarily call for a specific action. They are information flags that should prompt chart review. Further, they do not call for continuous buying or selling during the life of the signal. For example, a BUY signal will probably return the best results if action is taken soon after the signal is generated. Additional opportunities for buying may be found as price zigzags higher, but the trader must look for optimum entry points. Conversely, exit points to preserve gains (or minimize losses) may be evident before the model mechanically closes the signal.
STOCKS
IT Trend Model: BUY as of 11/15/2016
LT Trend Model: BUY as of 4/1/2016
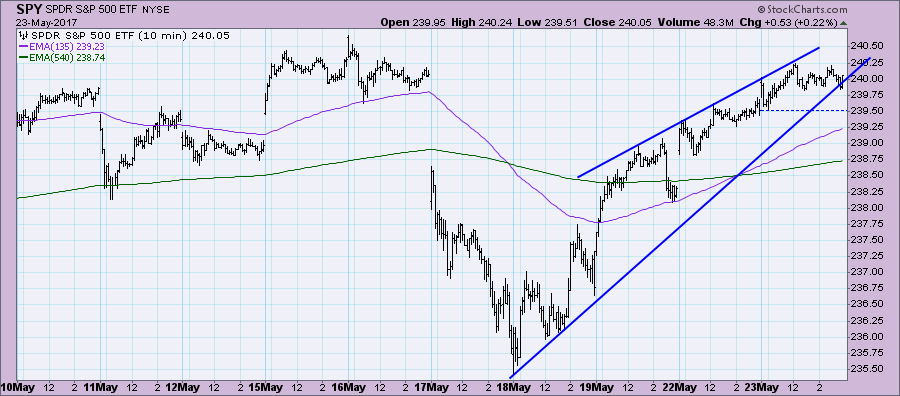
The 10-minute bar chart shows a very mature bearish rising wedge. The expectation is a breakdown. However, price started consolidating and has drifted out so the pattern is likely busting rather than executing. I do note that price reached overhead resistance at last week's highs and at that point stalled and began moving sideways.
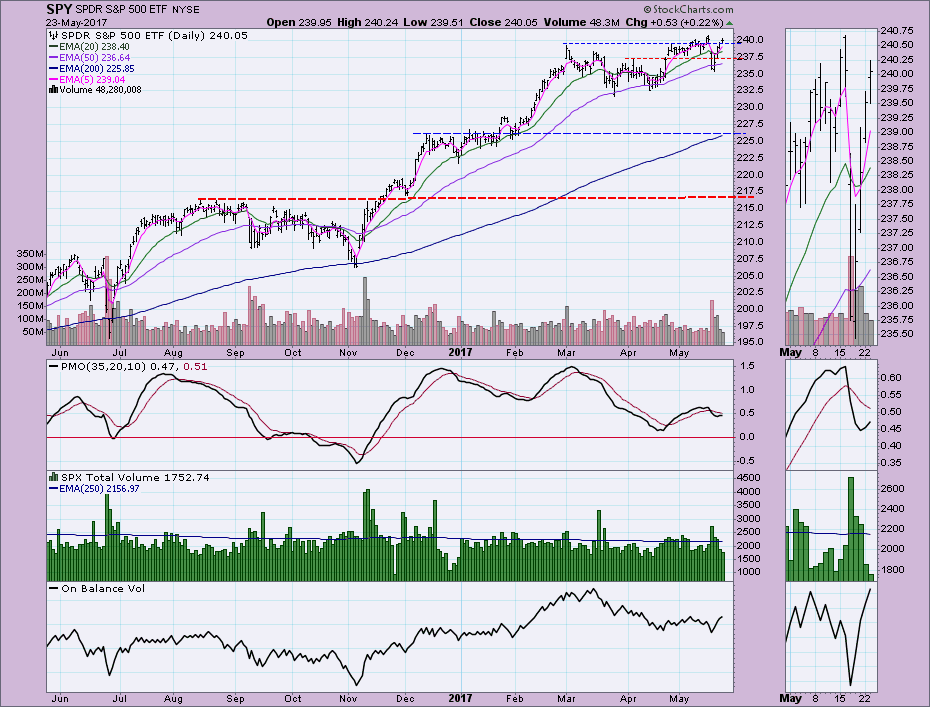
Now all Trend Models are on BUY signals. The PMO has already bottomed. I would be looking for a breakout to new all-time highs.
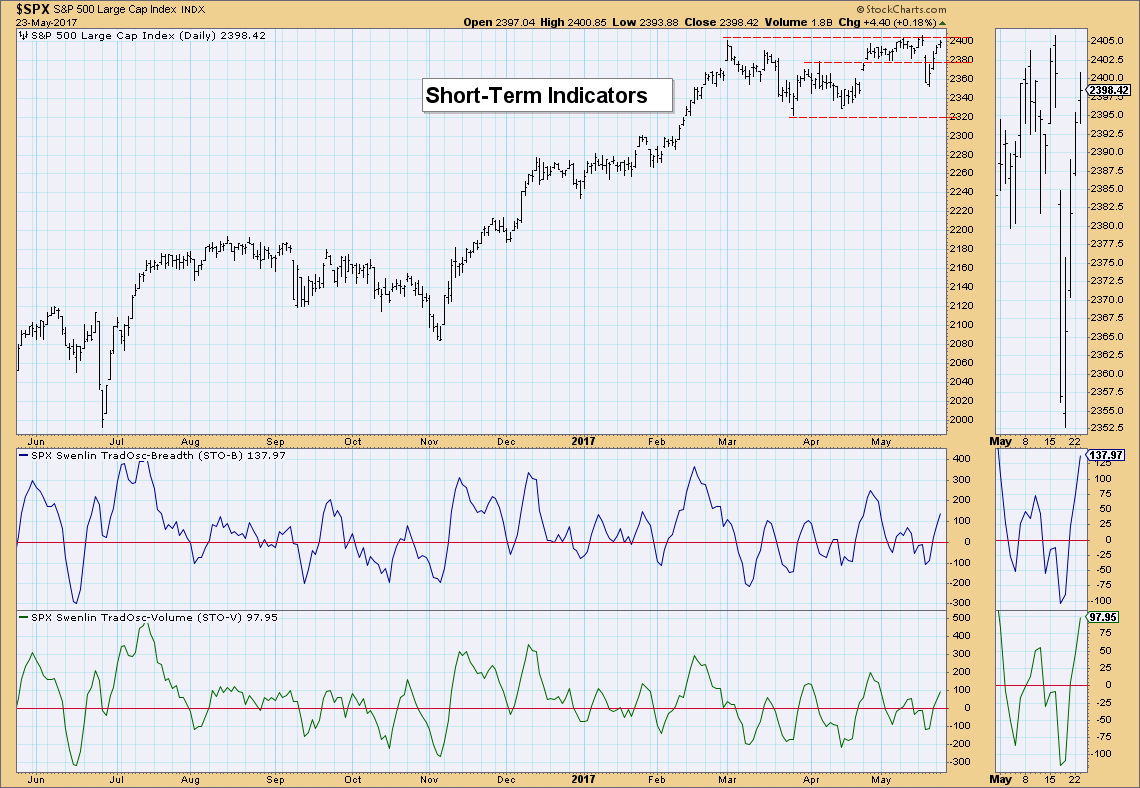
Ultra-Short-Term Indicators: Nothing to report on these indicators.
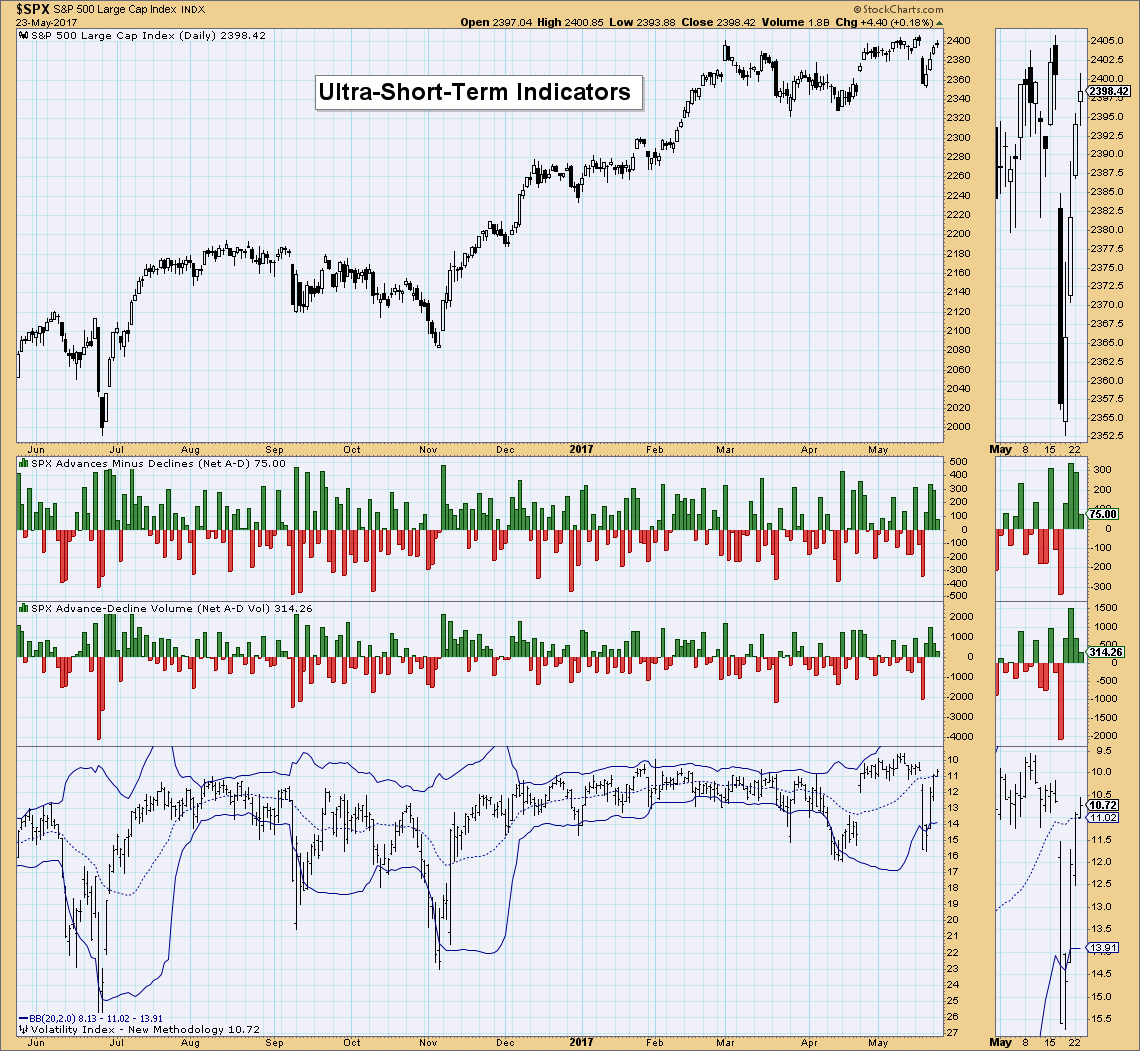
Short-Term Indicators: They continue to rise strongly after bottoming last week. I'd expect higher prices in the short term.
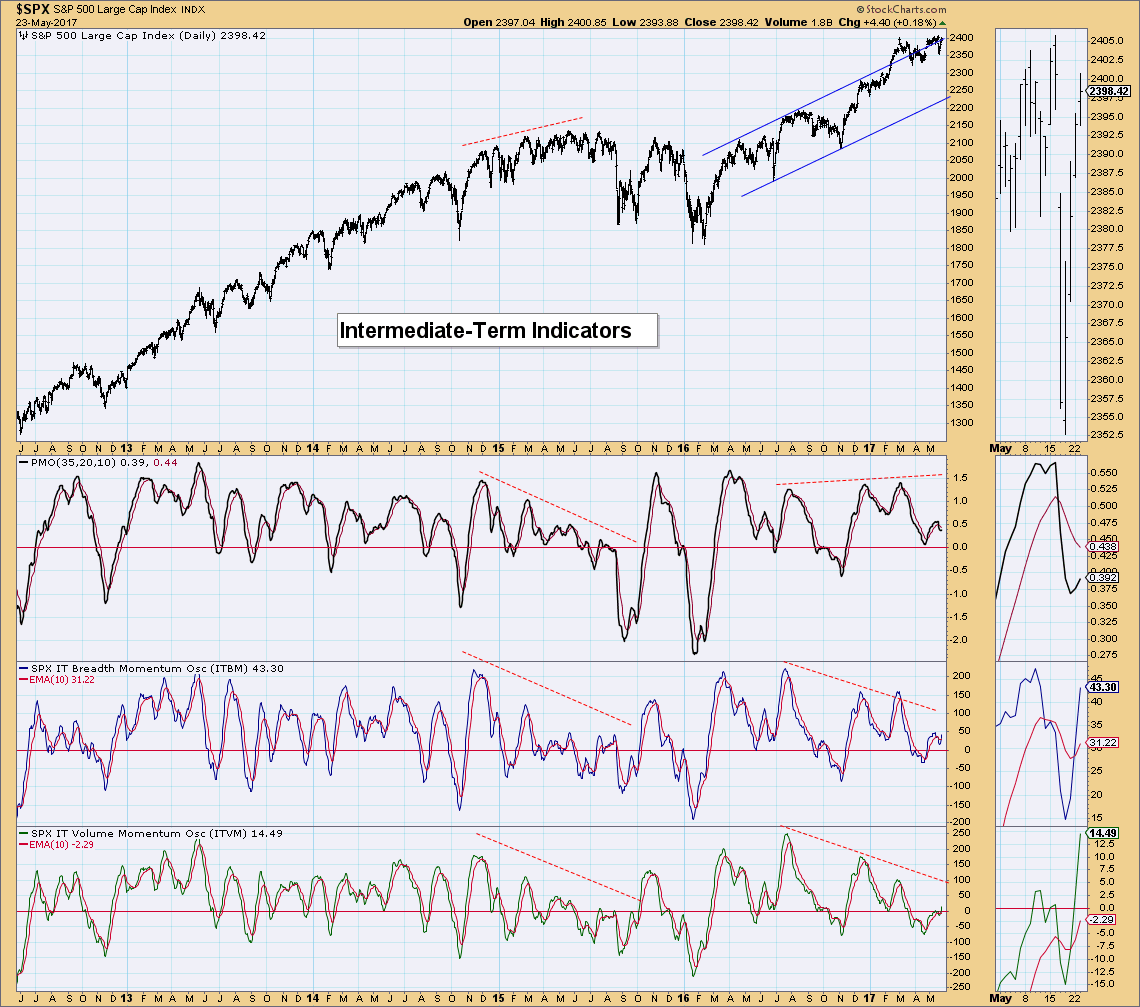
Intermediate-Term Indicators: Although we are seeing similar negative divergences on the ITBM and ITVM as we did before the 2015 bear market drop. However, the PMO is healthier than before. Both the ITBM and ITVM have had positive crossovers their signal lines which is very bullish. I will start to bite my nails if readings can't travel above the last indicator tops. We don't want to see negative divergences continue.
Conclusion: The markets are flirting with all-time highs again after a speedy recovery from last week's ST correction. Price is now up against overhead resistance at all-time highs. Indicators in the short and long terms are bullish and suggest we will see a breakout.
DOLLAR
IT Trend Model: NEUTRAL as of 3/21/2016
LT Trend Model: BUY as of 10/17/2016
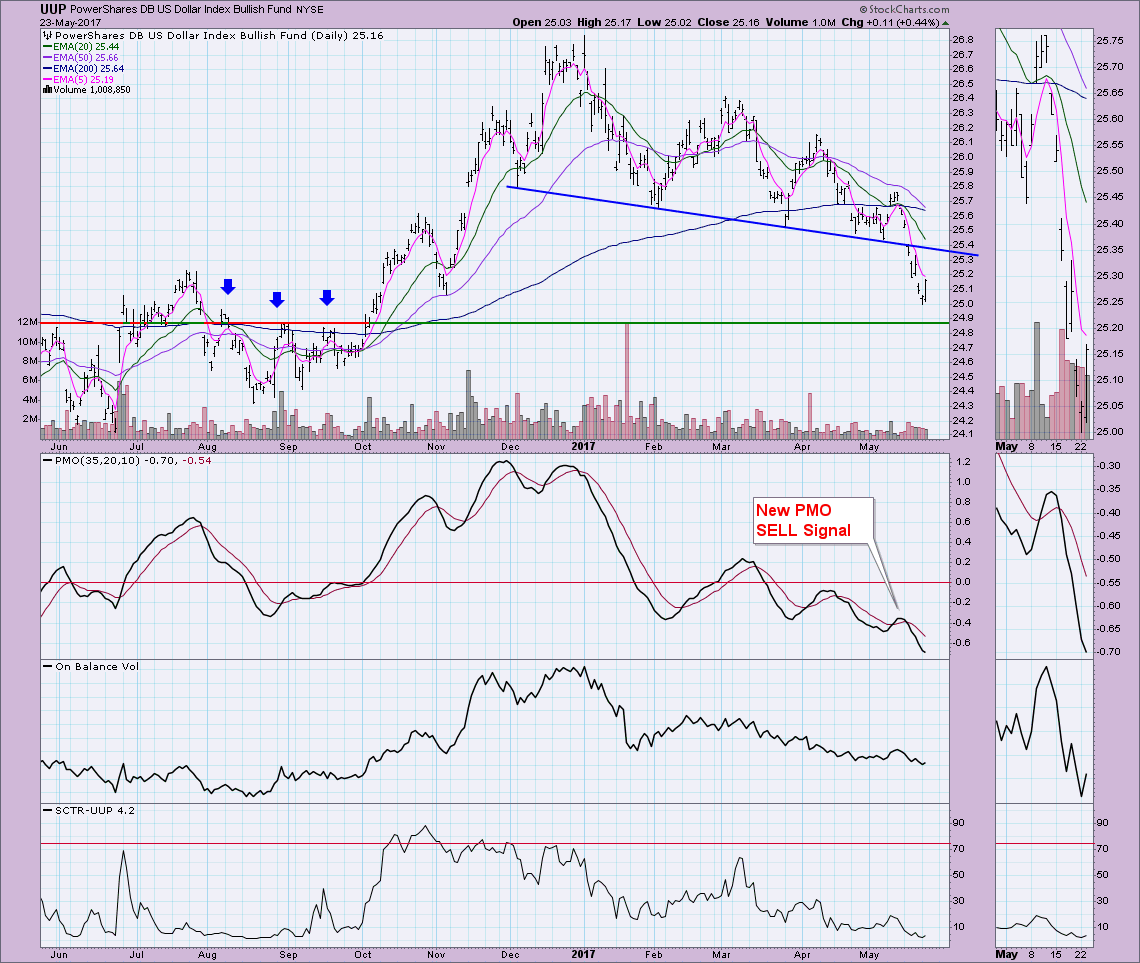
The Dollar seems to have found support near the August/September highs. The PMO, however, hasn't ended its descent just yet. The biggest worry for UUP right now is the likelihood of a new Long-Term Trend Model SELL signal which will trigger when the 50-EMA crosses below the 200-EMA.
GOLD
IT Trend Model: NEUTRAL as of 5/11/2017
LT Trend Model: BUY as of 4/12/2017
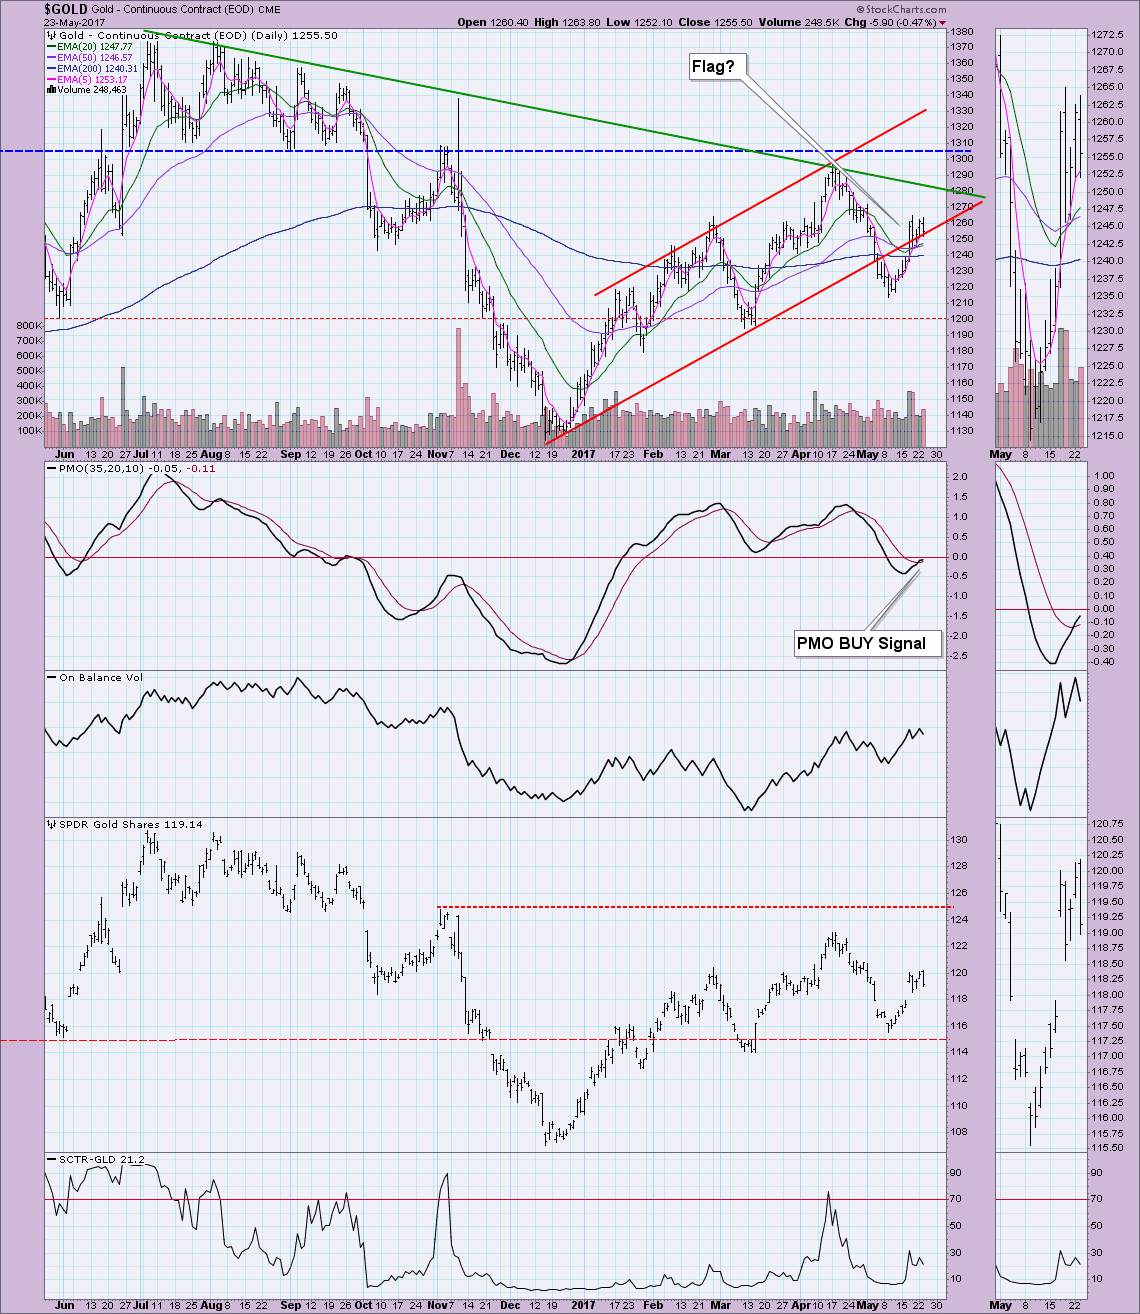
Gold broke back into the rising trend channel, but it is getting held up there. I'm now seeing the possibility of a bull flag. If it were to execute, it would interestingly put a minimum upside target around 1315 which would keep the rising trend channel going and break resistance at the long-term declining tops trend line and horizontal resistance at $1300 - $1310.
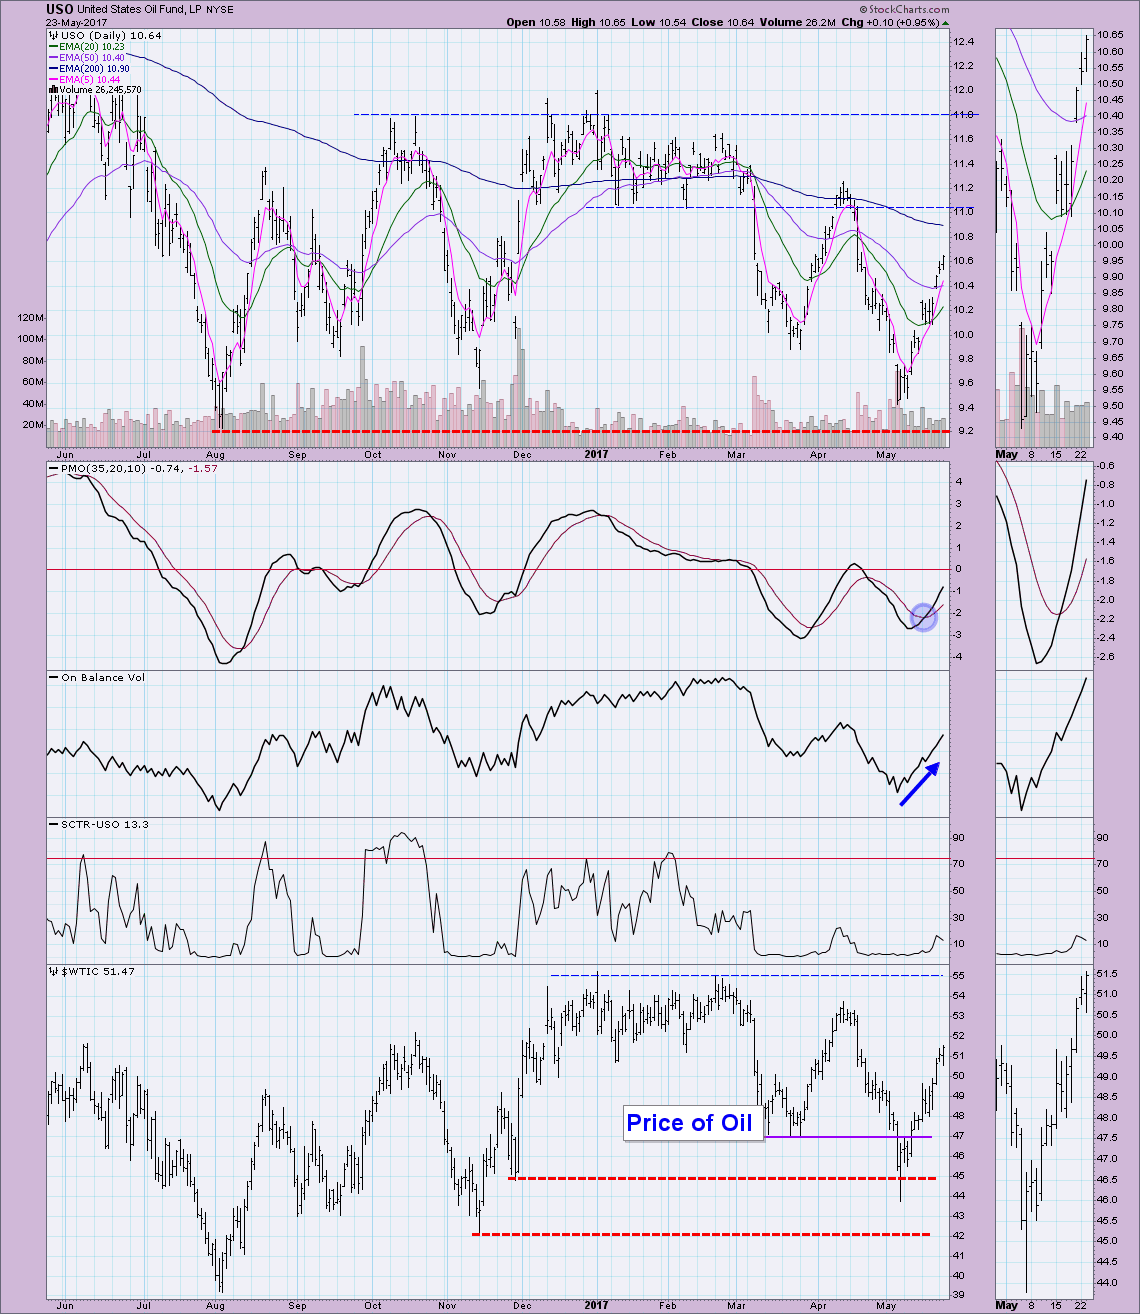
CRUDE OIL (USO)
IT Trend Model: NEUTRAL as of 3/8/2017
LT Trend Model: SELL as of 3/9/2017
Oil continues to fly higher. Note the breakaway and runaway gaps on USO since the price bottom at $9.40. The PMO is on a clean BUY signal and the OBV is soaring skyward. I don't think this is the end of it. Oil has plenty of room before it hits overhead resistance at about $55. Since USO follows Oil, this suggests that USO should reach at least $11.00.
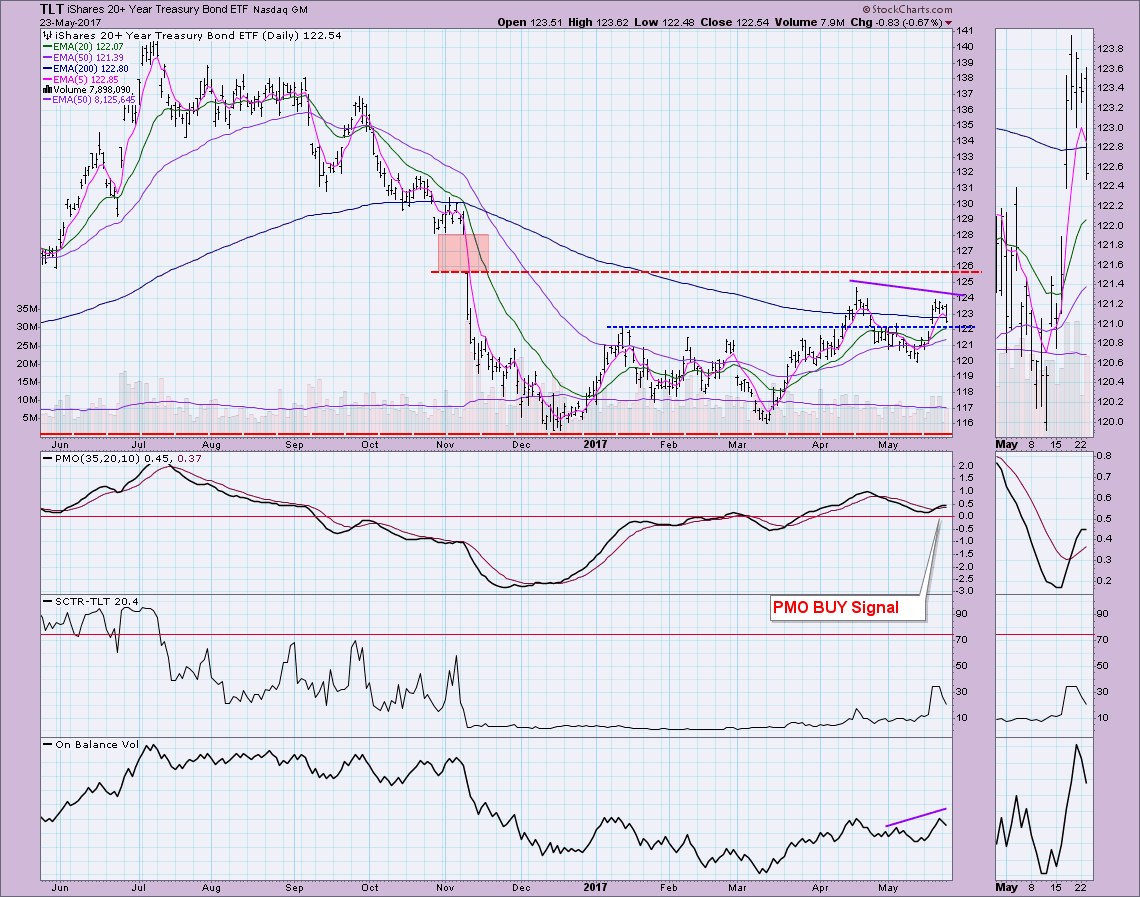
BONDS (TLT)
IT Trend Model: BUY as of 3/31/2017
LT Trend Model: SELL as of 11/17/2016
Few positives remain on the TLT chart. The PMO is on a BUY signal, but it has already topped. There is a positive divergence between OBV tops and price tops, but the SCTR is failing. The momentum of truth is now. Support at $122 needs to hold up.
Helpful DecisionPoint Links:
DecisionPoint Shared ChartList and DecisionPoint Chart Gallery
Price Momentum Oscillator (PMO)
Swenlin Trading Oscillators (STO-B and STO-V)
Technical Analysis is a windsock, not a crystal ball.
Happy Charting!
- Erin
**Don't miss DecisionPoint Commentary! Add your email below to be notified of new updates"**


