
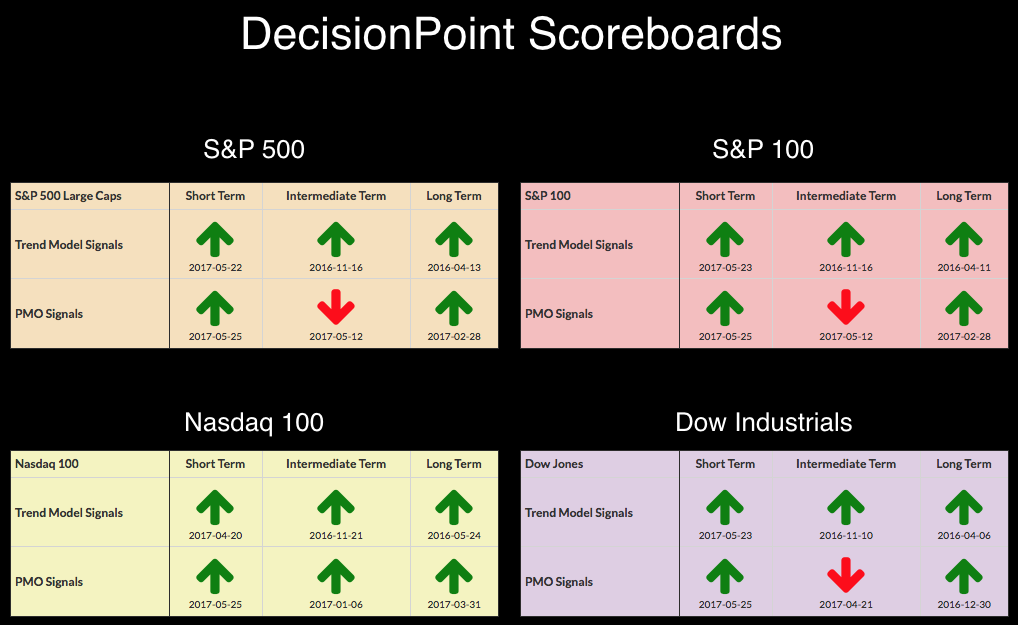
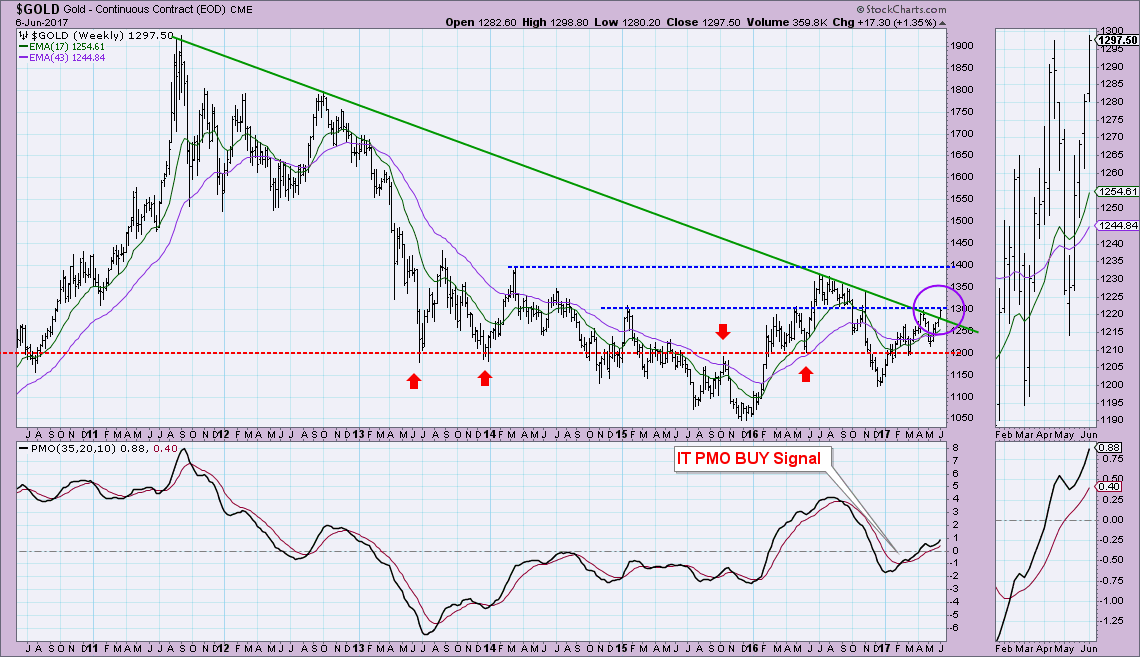
The markets have been backing off this week but so far it hasn't shifted any short-term timing signals on the DecisionPoint Scoreboards. Gold rallied today and finally hurdled long-term overhead resistance along a declining tops trendline that originally formed in 2012. Price has made numerous attempts at pushing through this trendline, but today, it finally succeeded.
The purpose of the DecisionPoint Alert Daily Update is to quickly review the day's action, internal condition, and Trend Model status of the broad market (S&P 500), the nine SPDR Sectors, the U.S. Dollar, Gold, Crude Oil, and Bonds. To ensure that using this daily reference will be quick and painless, we are as brief as possible, and sometimes we let a chart speak for itself.
SIGNALS: Here we include charts of any important signal changes triggered today by our Intermediate-Term Trend Model.
NO NEW SIGNALS TO REPORT.
NOTE: Mechanical trading model signals define the implied bias of the price index based upon moving average relationships, but they do not necessarily call for a specific action. They are information flags that should prompt chart review. Further, they do not call for continuous buying or selling during the life of the signal. For example, a BUY signal will probably return the best results if action is taken soon after the signal is generated. Additional opportunities for buying may be found as price zigzags higher, but the trader must look for optimum entry points. Conversely, exit points to preserve gains (or minimize losses) may be evident before the model mechanically closes the signal.
STOCKS
IT Trend Model: BUY as of 11/15/2016
LT Trend Model: BUY as of 4/1/2016
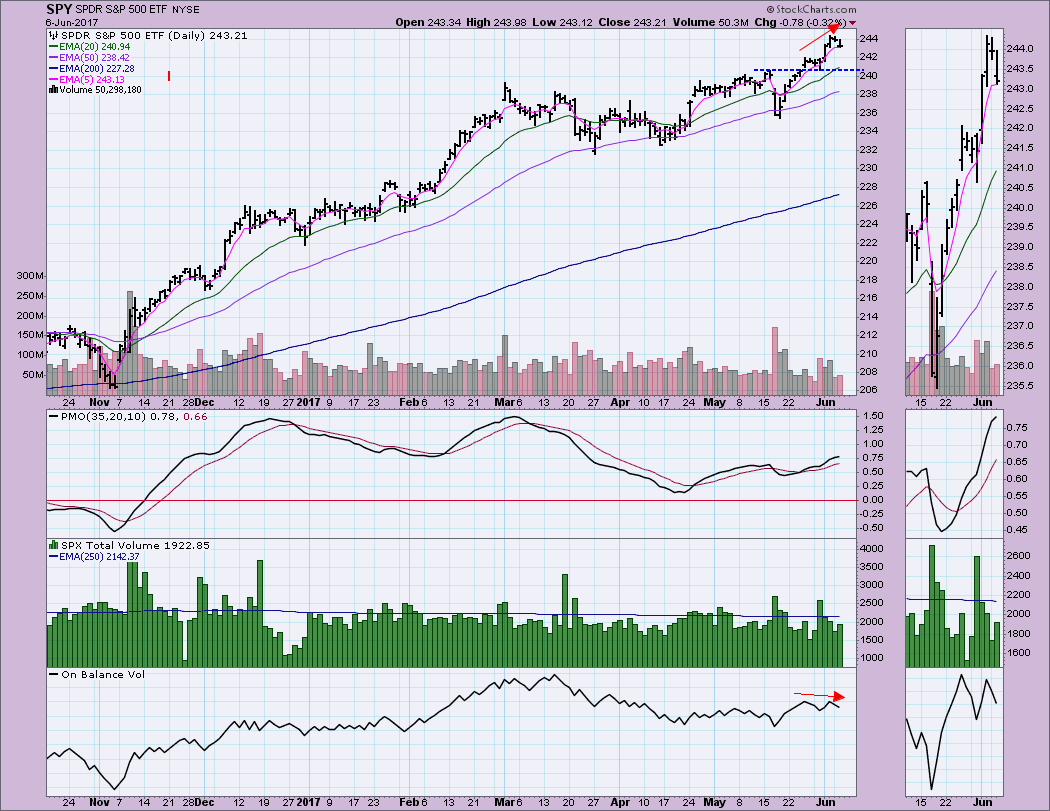
The market topped on Friday and spent yesterday mostly consolidating sideways. Today's gap down took us to intraday lows and despite a valiant effort by bulls to push price in positive territory, bears succeeded in bringing price down to opening lows.
I noted on the Monday MarketWatchers LIVE show that I was going to be watching the OBV on the SPY/SPX closely because it could set up a bullish confirmation or bearish divergence. When the market closed to the negative side yesterday, it 'gave' the day's volume to the bears and the OBV topped to set up a negative divergence. There is support waiting at 242 on the SPY and I suspect it may be tested before a move to new all-time highs.
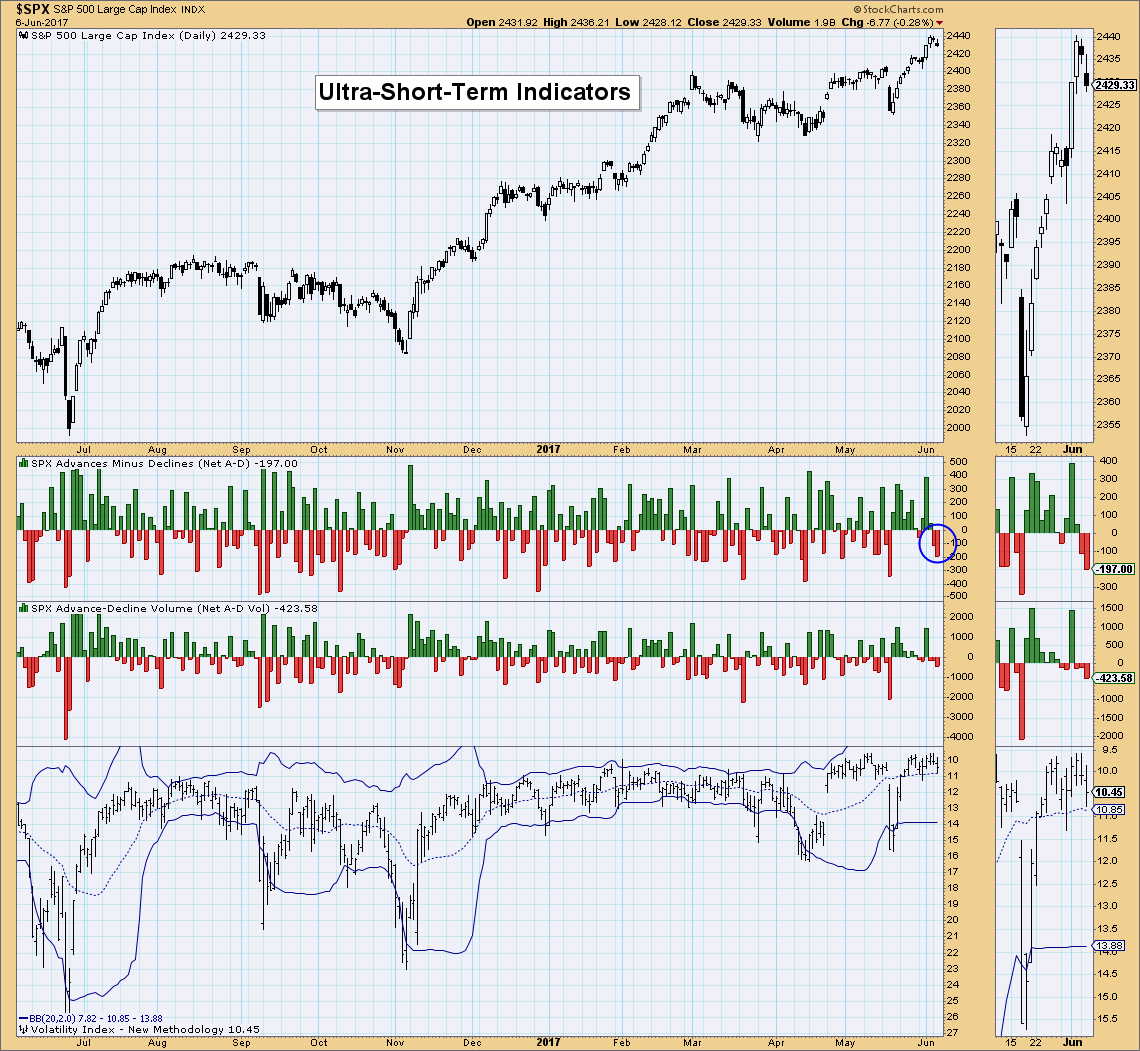
Ultra-Short-Term Indicators: I annotated a climactic reading on the Net A-D which could be a selling exhaustion. The VIX remains above its average on the inverted scale suggesting market complacency or lack of fear.
Short-Term Indicators: These indicators continue lower quite quickly now that price has turned lower for the week. If they turn back up above the zero line that would infer that short-term internal strength has returned. For now it leaves us vulnerable to more price decline.
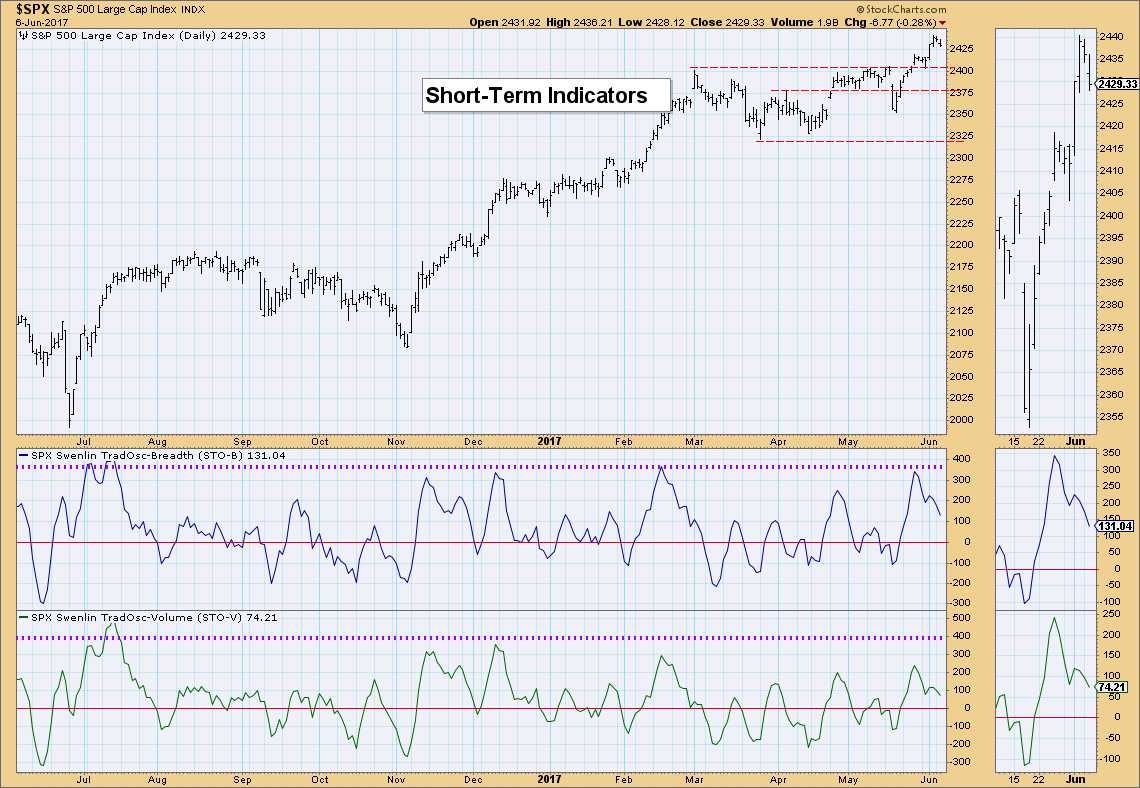
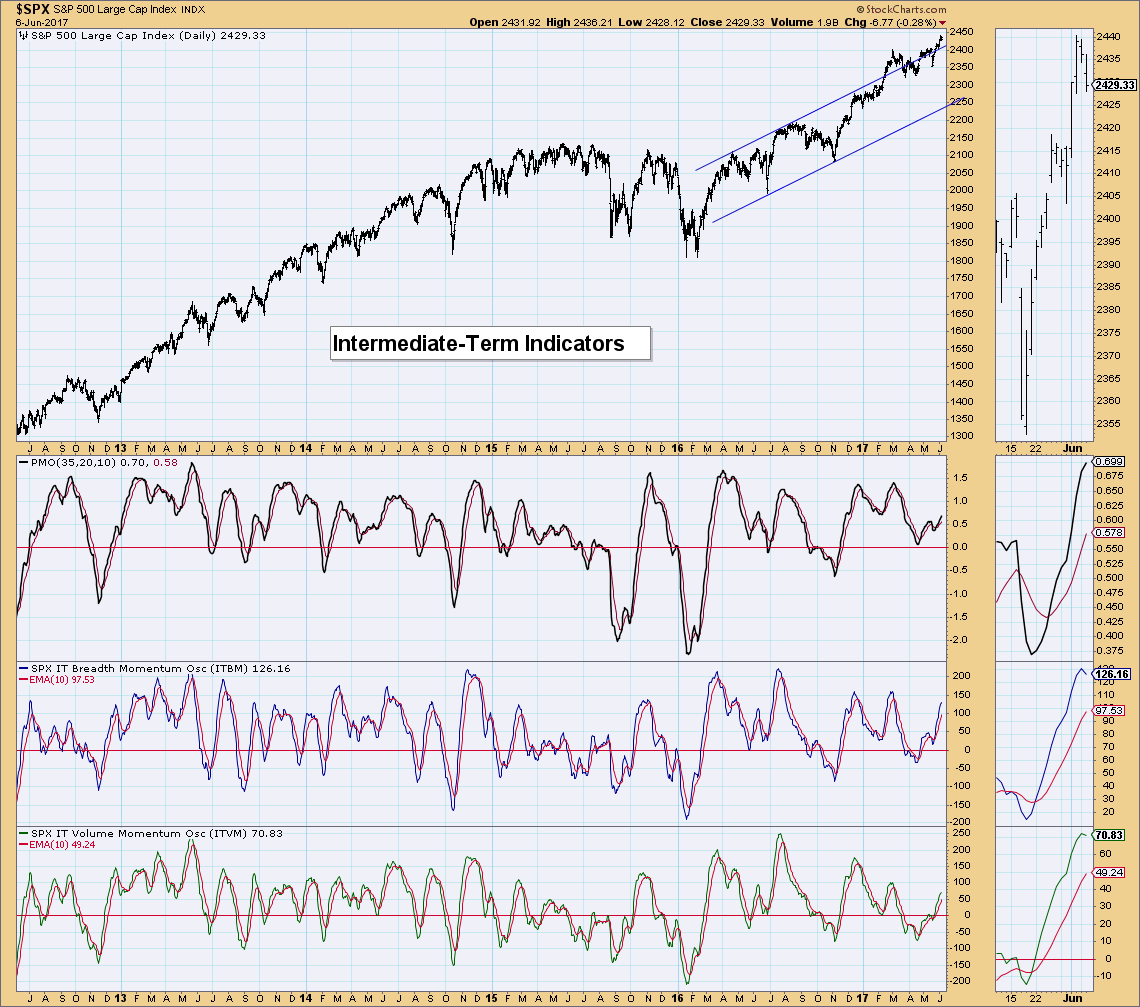
Intermediate-Term Indicators: These indicators are still configured bullishly, but today saw both ITBM and ITVM top. I won't get too concerned until we see a negative crossover.
Conclusion: I expected the market to finish higher on the week, but it's already logged two days lower. Ultra-short-term indicators suggest a possible selling exhaustion but short-term indicators are still falling. Look for support around 240 for the SPY, once tested I expect to see higher highs.
DOLLAR
IT Trend Model: NEUTRAL as of 3/21/2016
LT Trend Model: BUY as of 10/17/2016
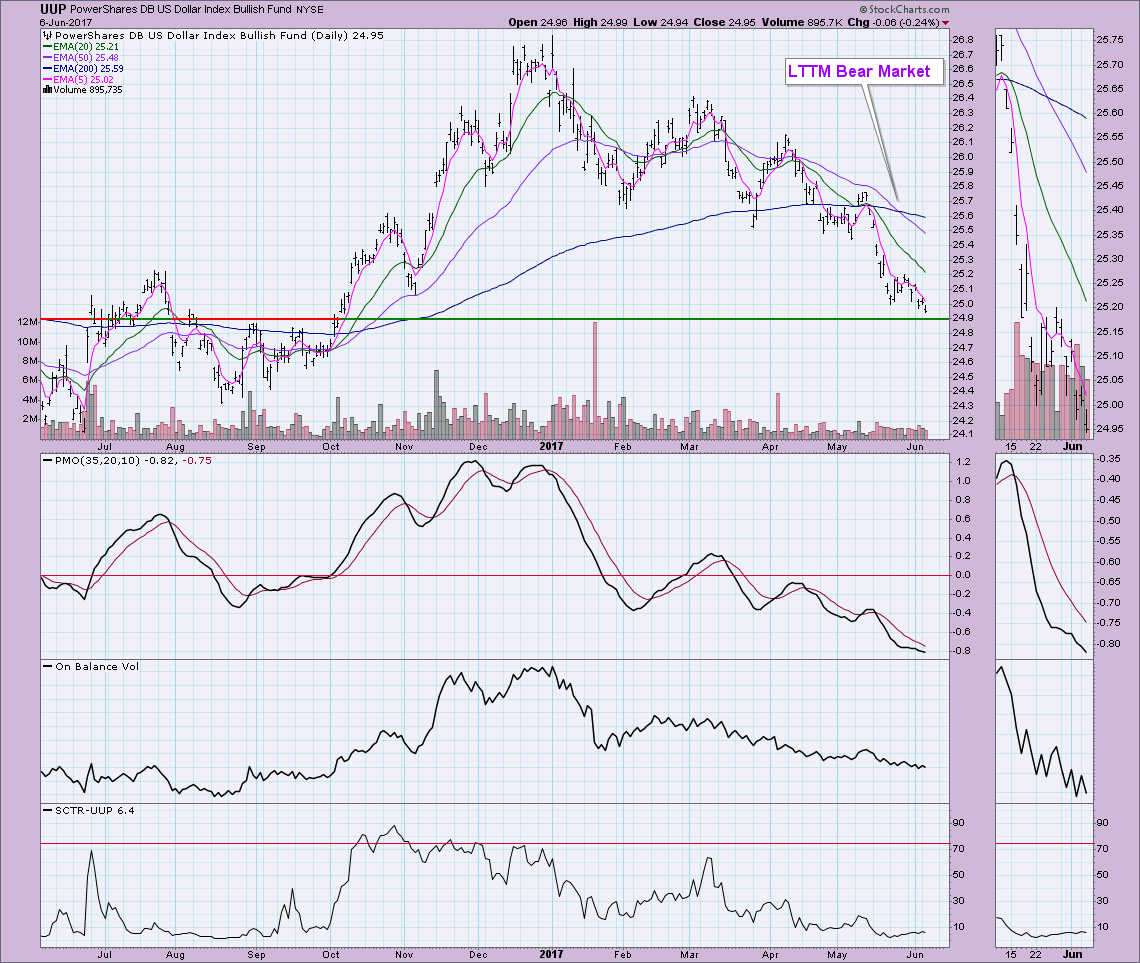
UUP made an attempt late last month to rally off support at $25. It's now been breached and support is available at $24.90. The PMO has turned lower and OBV/SCTR are configured bearishly. That area of support will likely be broken.
GOLD
IT Trend Model: BUY as of 5/22/2017
LT Trend Model: BUY as of 4/12/2017
Gold was up over 1% today, trading above declining tops line support. With the execution of the flag last month, the minimum upside target lies just above overhead resistance at 1300. OBV has already moved above its prior top setting up a bullish confirmation of the breakout. The SCTR has just about reached the "hot zone" above 75.
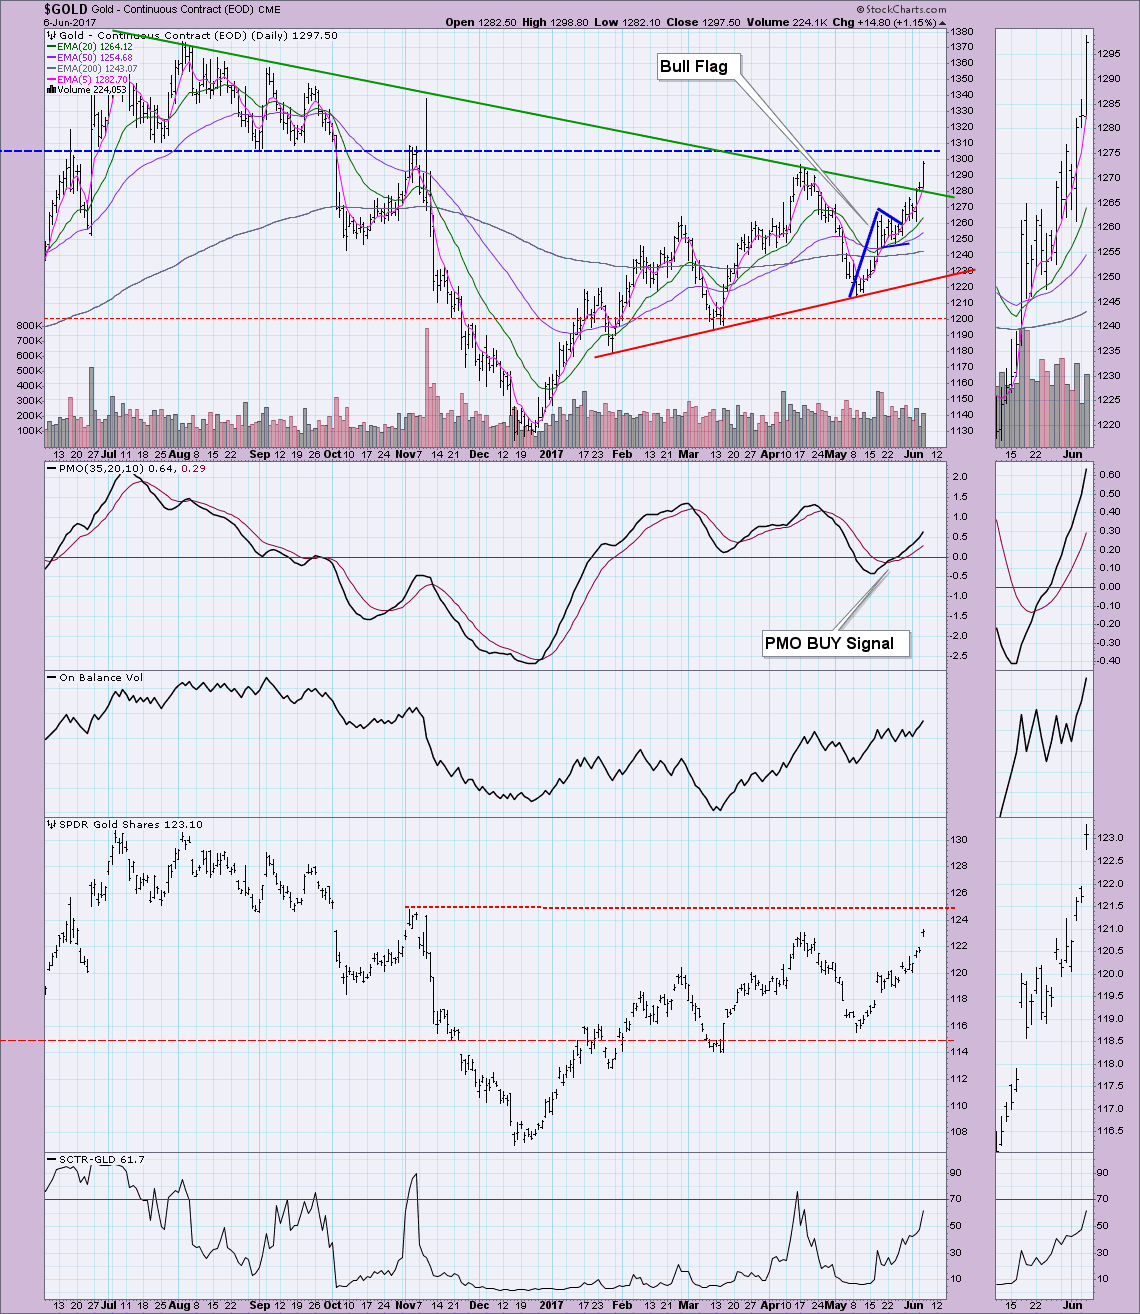
You can see the importance of today's breakout on the weekly chart. 1300 is the next hurdle. I suspect we'll see a pullback or consolidation first.
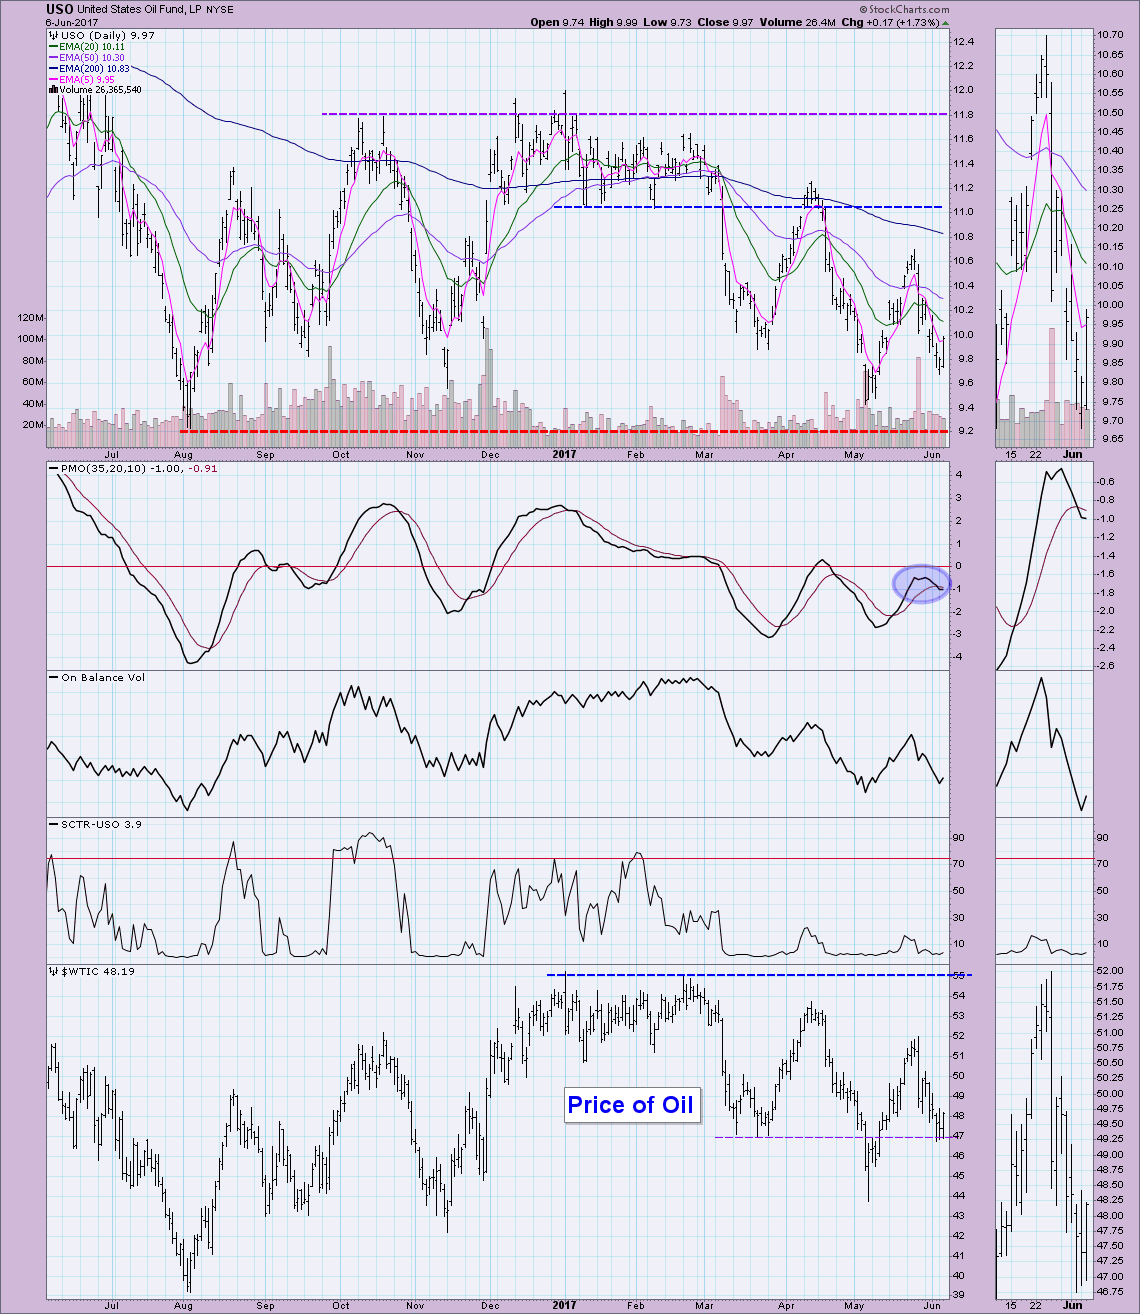
CRUDE OIL (USO)
IT Trend Model: NEUTRAL as of 3/8/2017
LT Trend Model: SELL as of 3/9/2017
USO rallied strongly today, but the PMO SELL signal is still intact and falling. Looking at Oil, $47/barrel is holding as support right now which suggests USO is probably putting in a short-term bottom, but with its volatility as of late, I wouldn't be attempting to catch that very sharp falling knife.
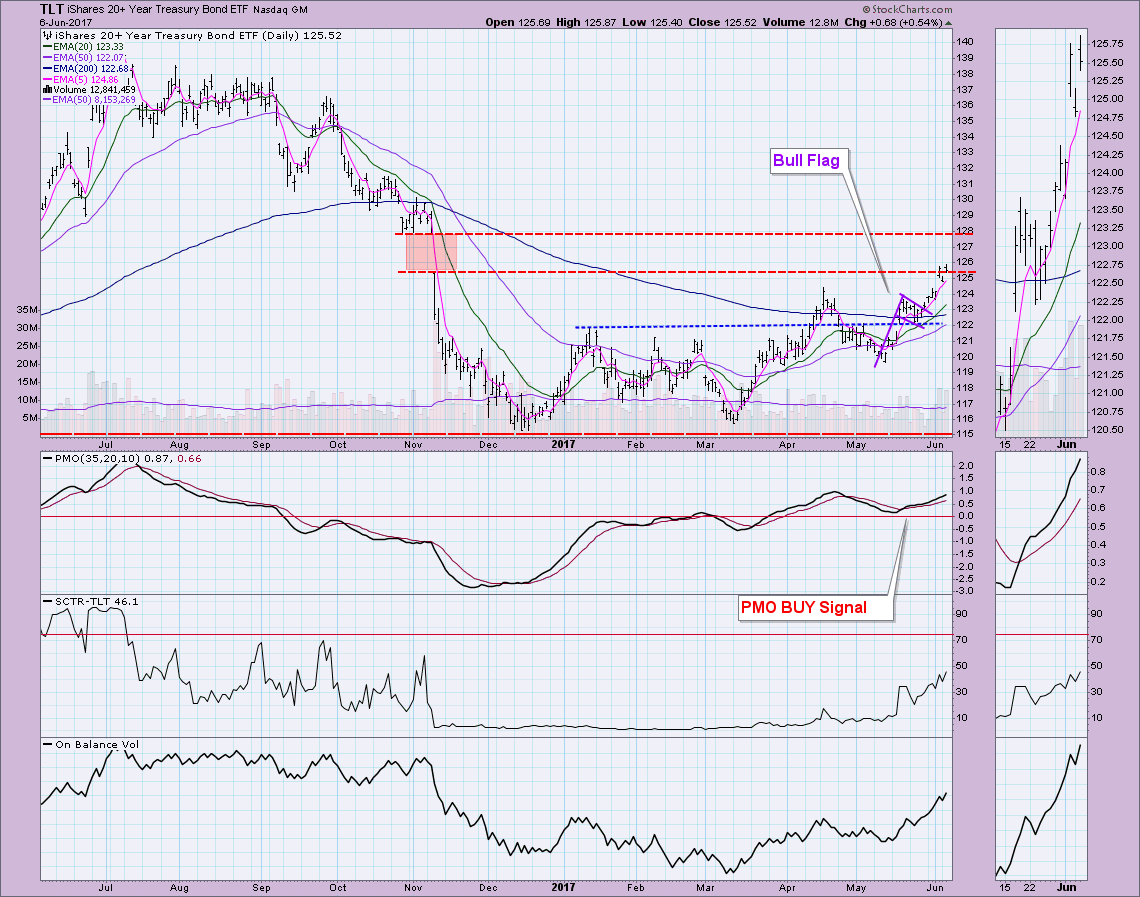
BONDS (TLT)
IT Trend Model: BUY as of 3/31/2017
LT Trend Model: SELL as of 11/17/2016
Like Gold, TLT executed a bull flag. It's minimum upside target is at $128. Today's close at around $125.50 has price on its way to closing the gap formed back in November. If the target is reached the gap will be successfully closed. The PMO can certainly accommodate more upside momentum without becoming overbought yet. My only concern is rising yields which would hurt bond prices.
Helpful DecisionPoint Links:
DecisionPoint Shared ChartList and DecisionPoint Chart Gallery
Price Momentum Oscillator (PMO)
Swenlin Trading Oscillators (STO-B and STO-V)
Technical Analysis is a windsock, not a crystal ball.
Happy Charting!
- Erin
**Don't miss DecisionPoint Commentary! Add your email below to be notified of new updates"**


