 Admittedly I was surprised that the market had just a brilliant day given the very bearish configuration of short-term market indicators. Apparently I should have paid more attention to the short-term buy signals that were produced over the past week or two. The rally brought the S&P 600 ETF (IJR) a new IT Trend Model BUY signal with a PMO nearing a positive crossover BUY signal.
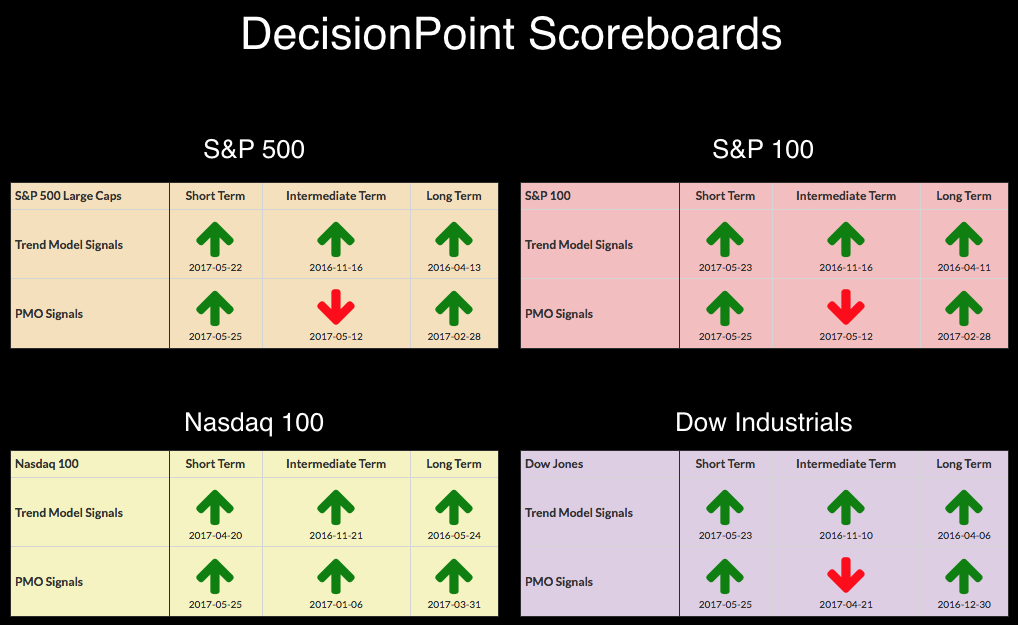
The purpose of the DecisionPoint Alert Daily Update is to quickly review the day's action, internal condition, and Trend Model status of the broad market (S&P 500), the nine SPDR Sectors, the U.S. Dollar, Gold, Crude Oil, and Bonds. To ensure that using this daily reference will be quick and painless, we are as brief as possible, and sometimes we let a chart speak for itself.
SIGNALS: Here we include charts of any important signal changes triggered today by our Intermediate-Term Trend Model.
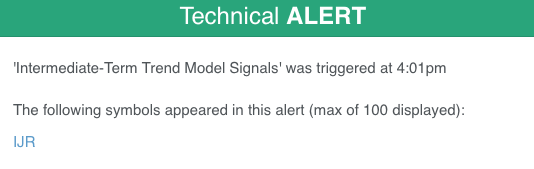
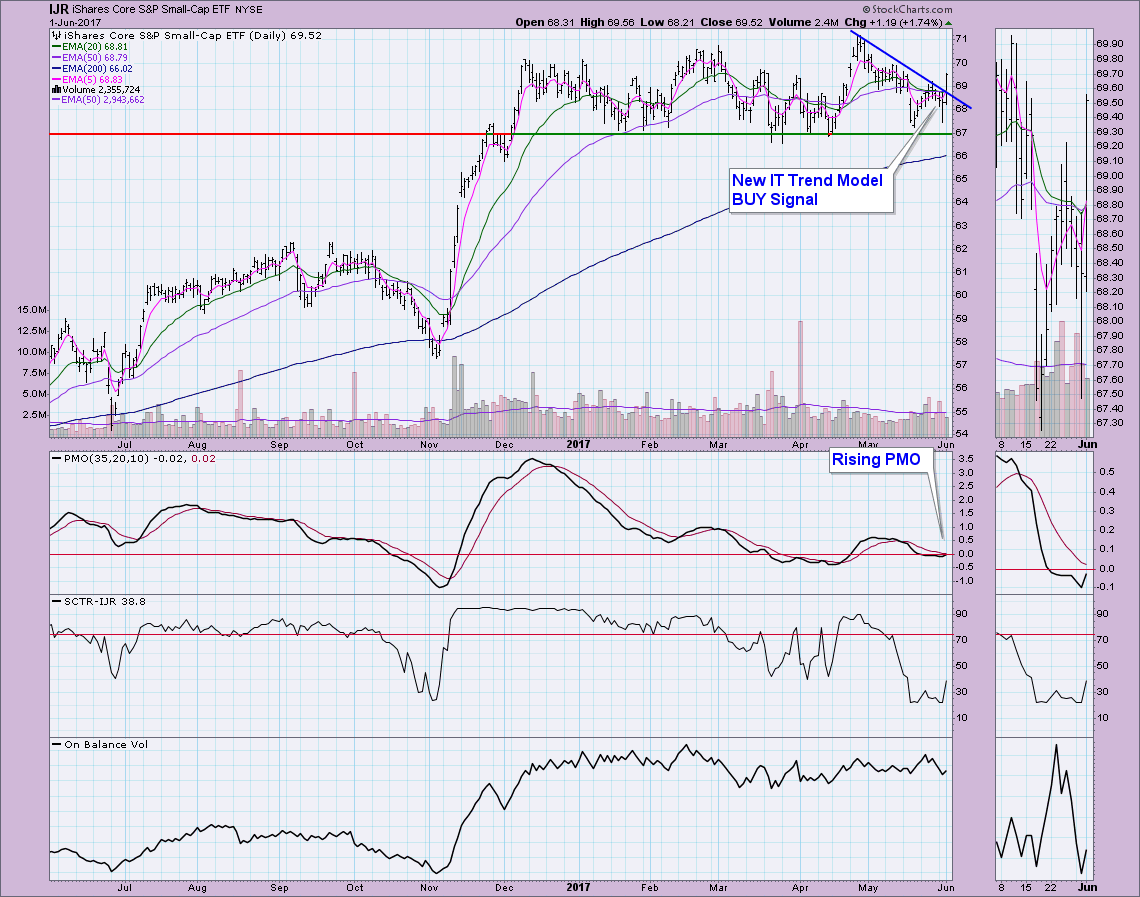
The above alert arrived in my email box after the close courtesy of the StockCharts Technical Alert workbench. I pulled up the chart and saw two very encouraging price bars. The first was yesterday's where we saw horizontal support along this year's lows hold easily. Next is today's impressive price bar breakout. The ST and IT Trend Models triggered BUY signals today. The STTM signal is generated when the 5-EMA crosses above the 20-EMA. The ITTM buy signal is generated when the 20-EMA crosses above the 50-EMA. I think these signals are little suspect because the margins between the EMAs are minuscule which could cause whipsaw signals over the next week. If we see follow-through, the upside target is around $71.
NOTE: Mechanical trading model signals define the implied bias of the price index based upon moving average relationships, but they do not necessarily call for a specific action. They are information flags that should prompt chart review. Further, they do not call for continuous buying or selling during the life of the signal. For example, a BUY signal will probably return the best results if action is taken soon after the signal is generated. Additional opportunities for buying may be found as price zigzags higher, but the trader must look for optimum entry points. Conversely, exit points to preserve gains (or minimize losses) may be evident before the model mechanically closes the signal.
STOCKS
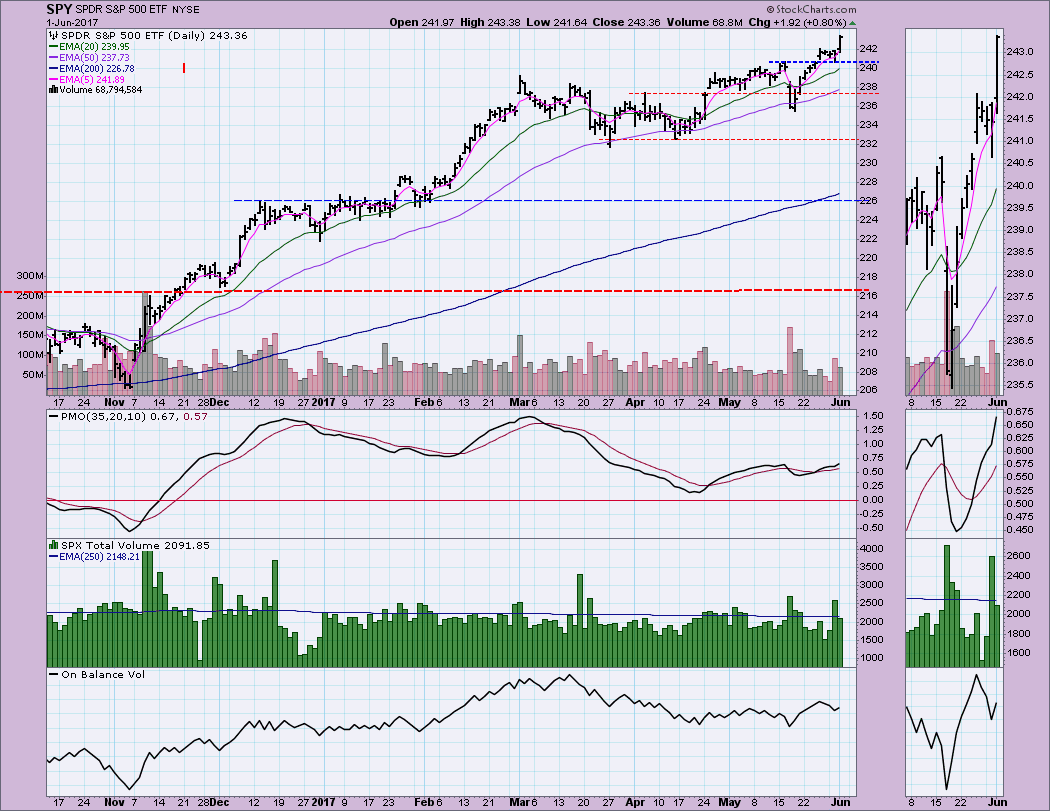
IT Trend Model: BUY as of 11/15/2016
LT Trend Model: BUY as of 4/1/2016
Pulled away from the consolidation zone of the past week quite easily. The last 10-minutes saw an impressive jump to end the day closing near the day's highs.
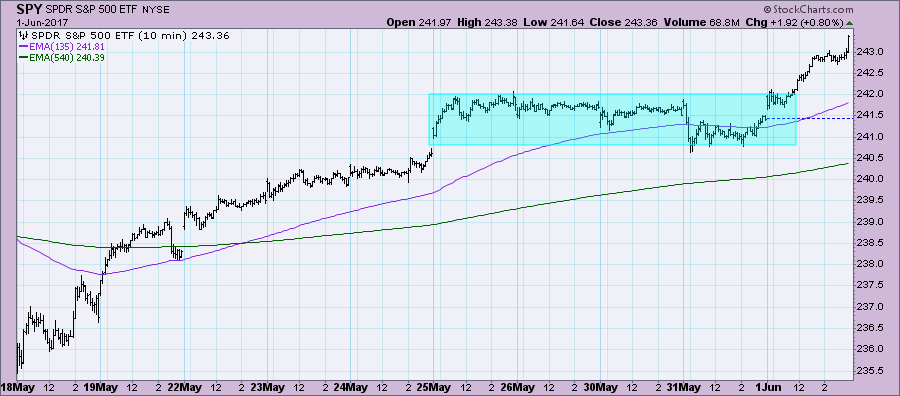
The price bar on the SPY daily chart shows the breakout to new all-time highs. The Trend Models are positively configured with plenty of margin among them so the price trends continue to be very bullish. Seeing the PMO reach above the previous top is a bullish confirmation.
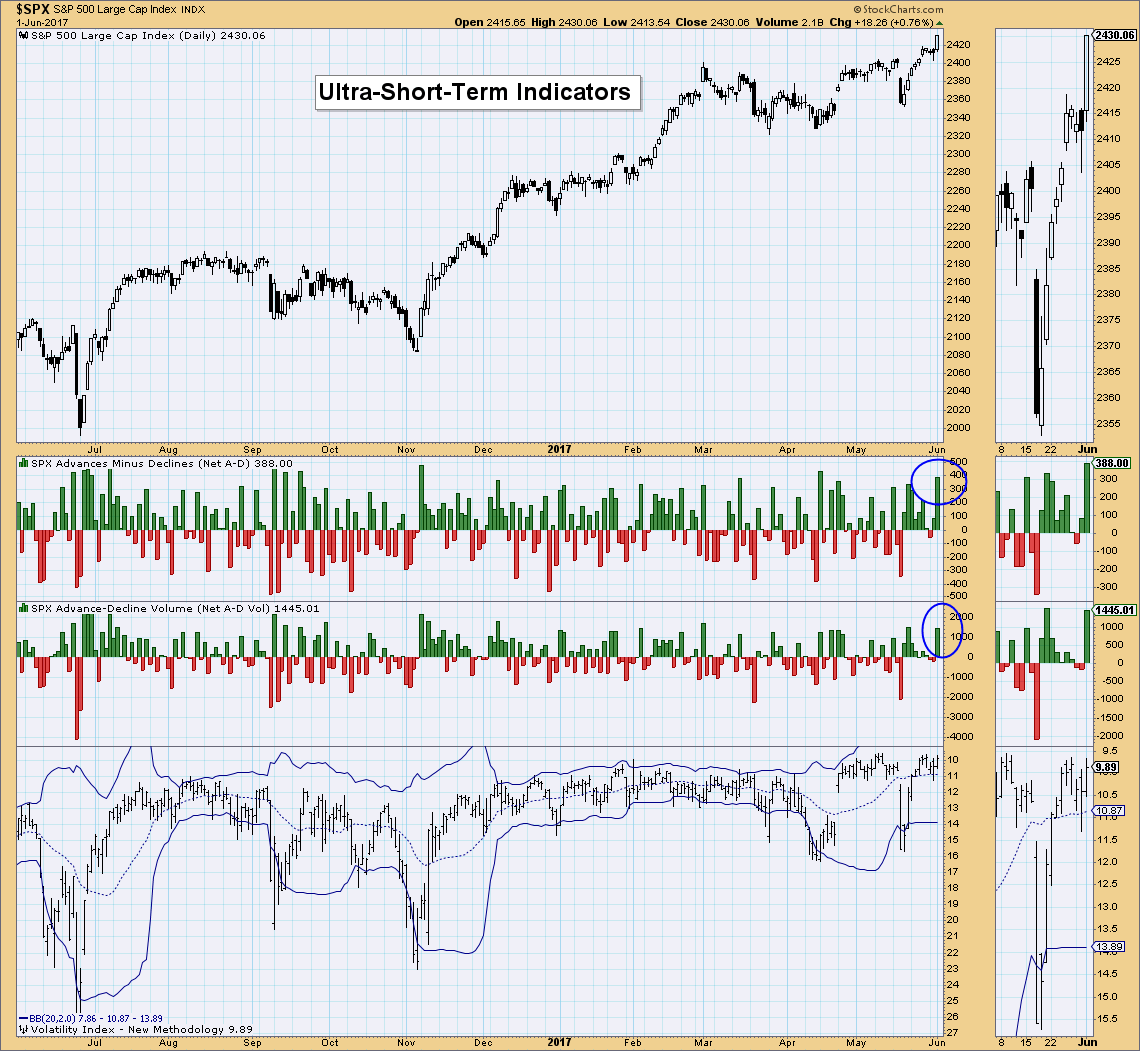
Ultra-Short-Term Indicators: Not surprisingly, breadth was clearly biased to advancers, creating climactic readings on Net A-D price and volume. I don't think we are looking at a buying exhaustion. More likely, an initiation to higher prices. That's one bullish white candlestick, nearly a Marubozu where there are no wicks or shadows. I wouldn't expect to see a serious pullback off of this configuration, despite my thoughts on Tuesday where these indicators suggested to me a bearish end to the week.
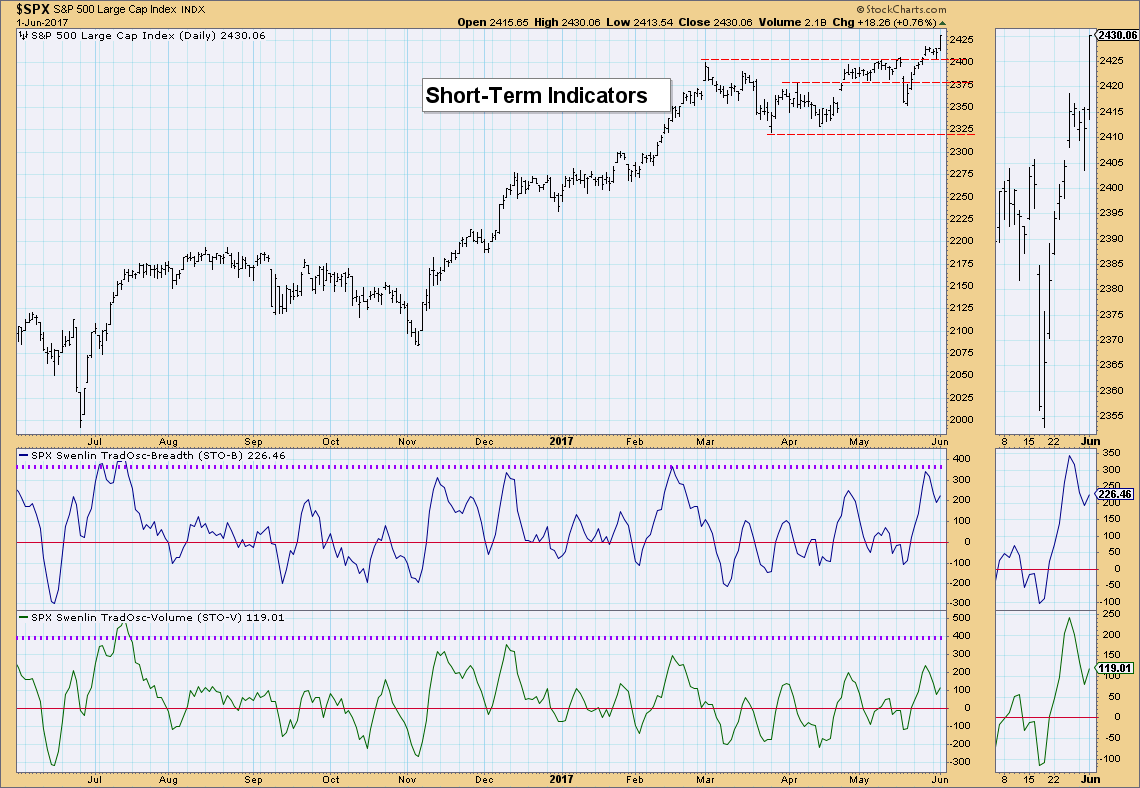
Short-Term Indicators: I mentioned during yesterday's MarketWatchers LIVE show that typically we will see overbought indicators unwind through lower prices. However, for most of the year, these indicators have been clearing overbought conditions through consolidation or in some instances without a price decline. This is characteristic of a strong bull market with plenty of internal strength. These indicators have turned back up, but they are still somewhat overbought and need to decompress. Given today's breakout, I'd say the market has plenty of internal strength to avoid a deep decline.
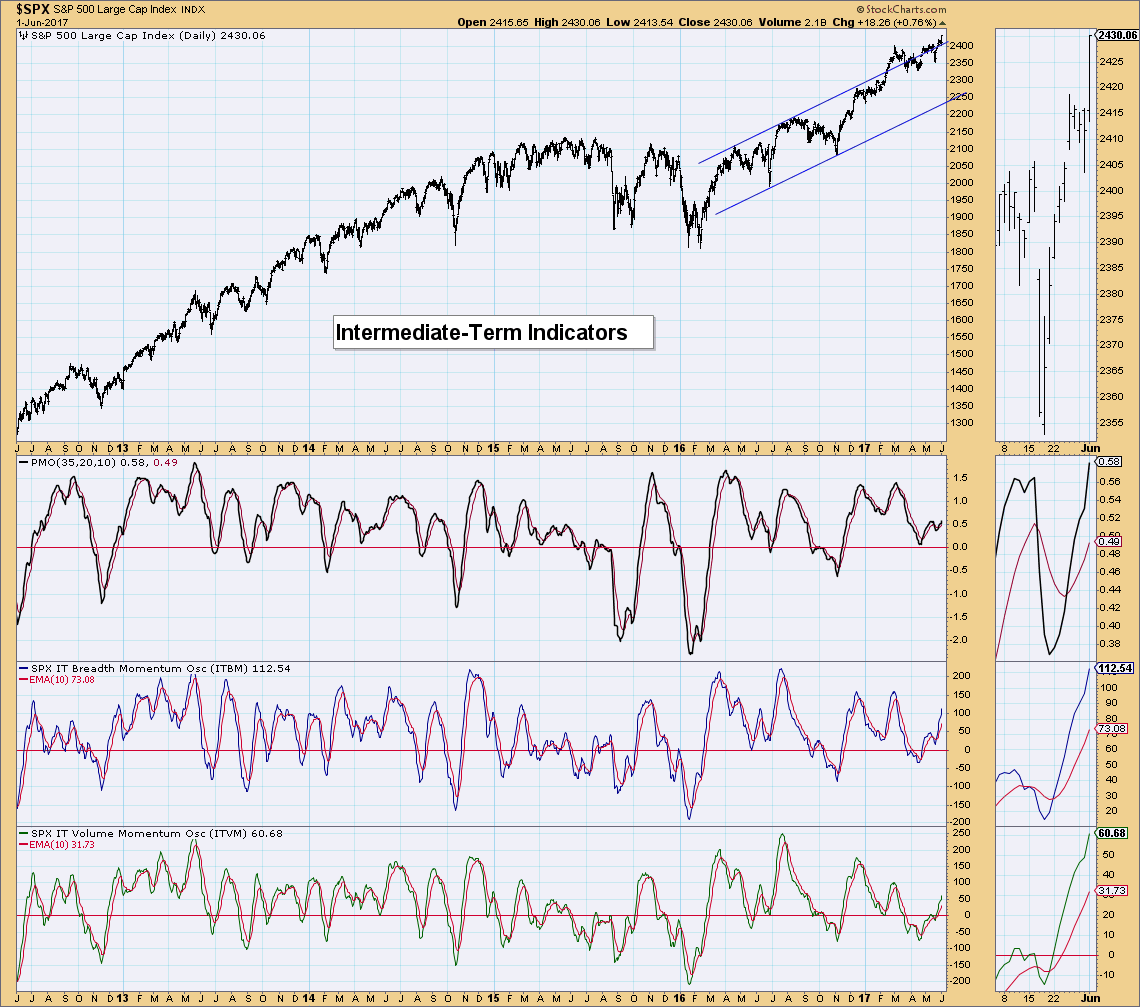
Intermediate-Term Indicators: These indicators are very bullish. They're rising strongly in positive territory but are far from being overbought.
Conclusion: It figures that after writing a blog title on Tuesday about a bearish finish on the week that we'd see this strong rally. Well, we didn't and the indicators were able to clear some of the overbought conditions with only consolidation. While ST indicators are still somewhat overbought, they do have room to move higher again before hitting extremes. However, it isn't a generous amount of time, they will need to decompress again soon. With so much internal strength in this market, I wouldn't expect a correction or even serious pullback. IT indicators tell us any price drop will likely be temporary as they are still rising and very bullish.
DOLLAR
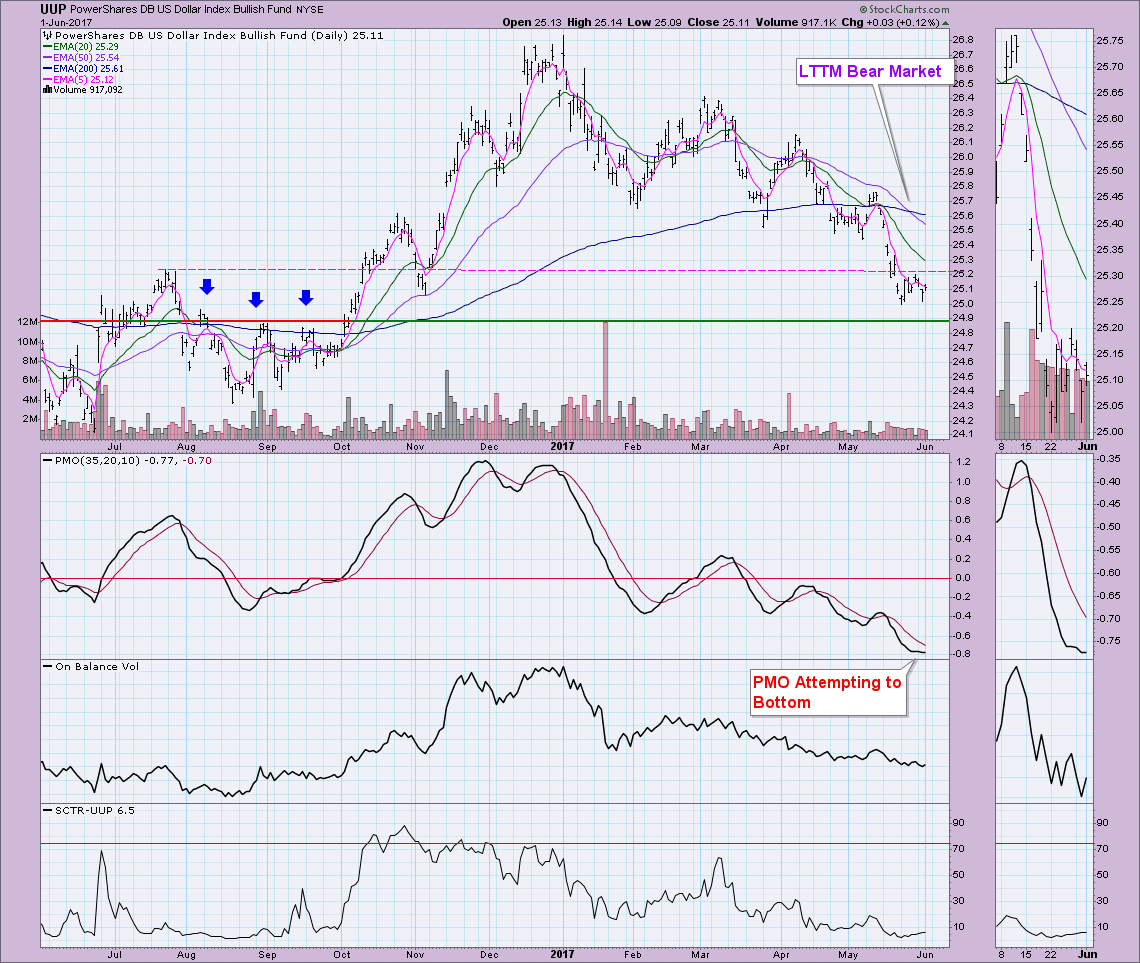
IT Trend Model: NEUTRAL as of 3/21/2016
LT Trend Model: BUY as of 10/17/2016
I'm bearish on the Dollar in general. Indicators are still looking soft. The PMO wants to bottom which is positive, but the OBV is showing is flat and not showing any positive divergences yet. The SCTR is trending higher very slightly but not enough to suggest a rally. I suspect we will see consolidation below $25.20 but above $24.90.
GOLD
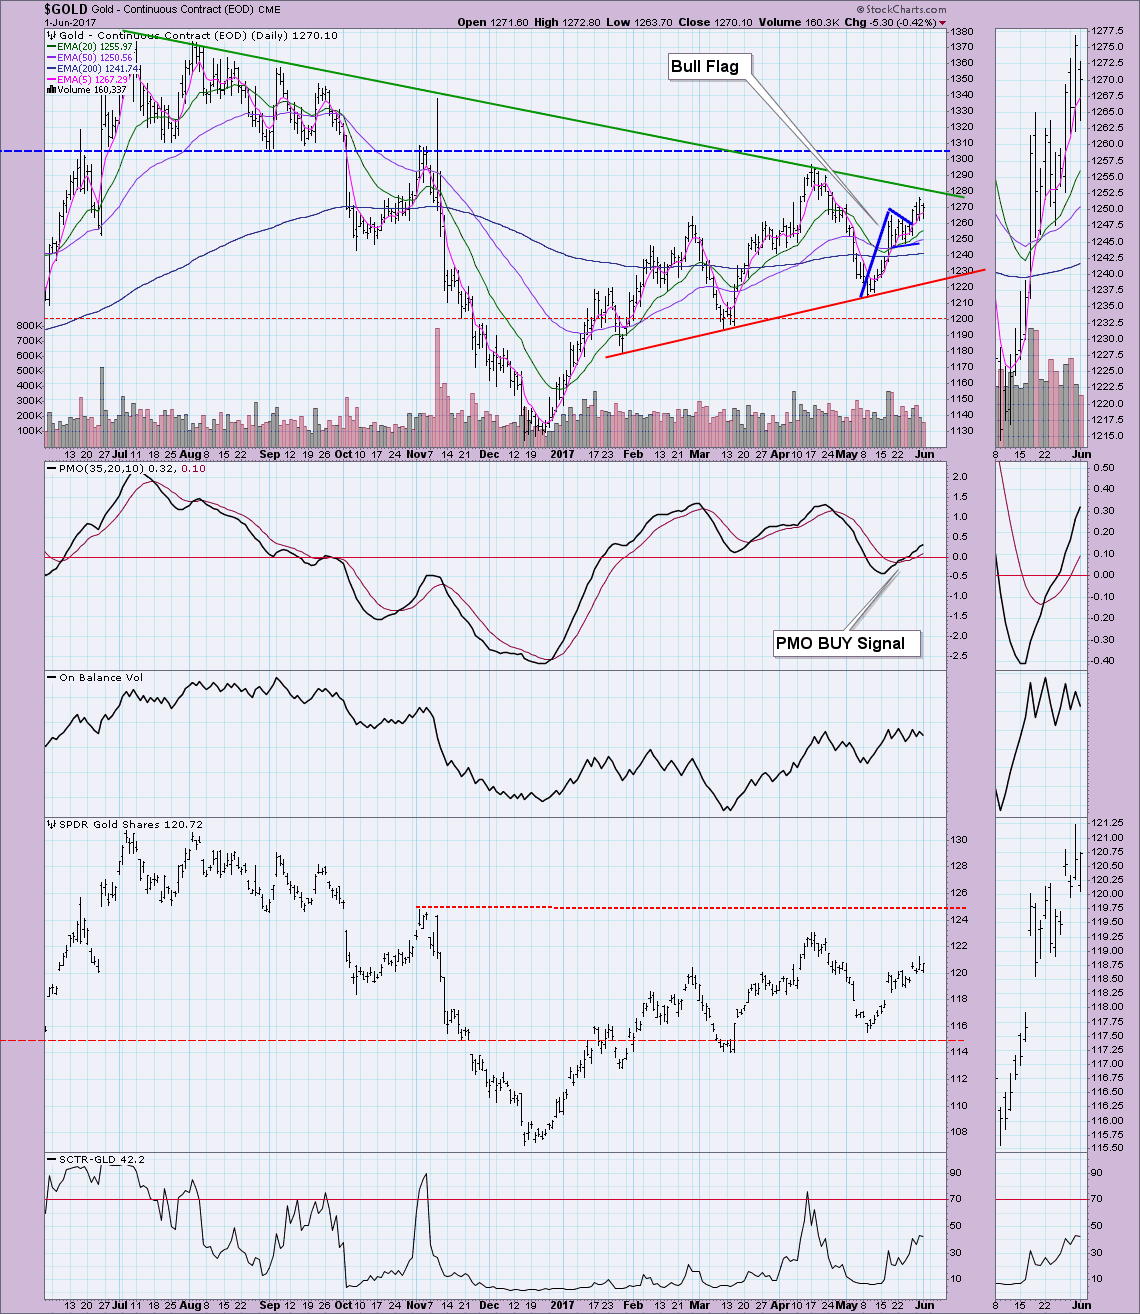
IT Trend Model: BUY as of 5/22/2017
LT Trend Model: BUY as of 4/12/2017
I went ahead a annotated a bull flag on Gold and on Bonds. We got the breakout so the minimum upside target should be around $1305 which matches nicely with overhead resistance. I'm very concerned about price overcoming resistance along the long-term declining tops line that was established in 2012. Price needs to puncture this resistance and put in a decisive 3%+ move above it. So while I'm still bullish on Gold, the short term is concerning. Note the negative divergence between OBV tops and price tops. I'll feel much better when long-term resistance is hurdled.
CRUDE OIL (USO)
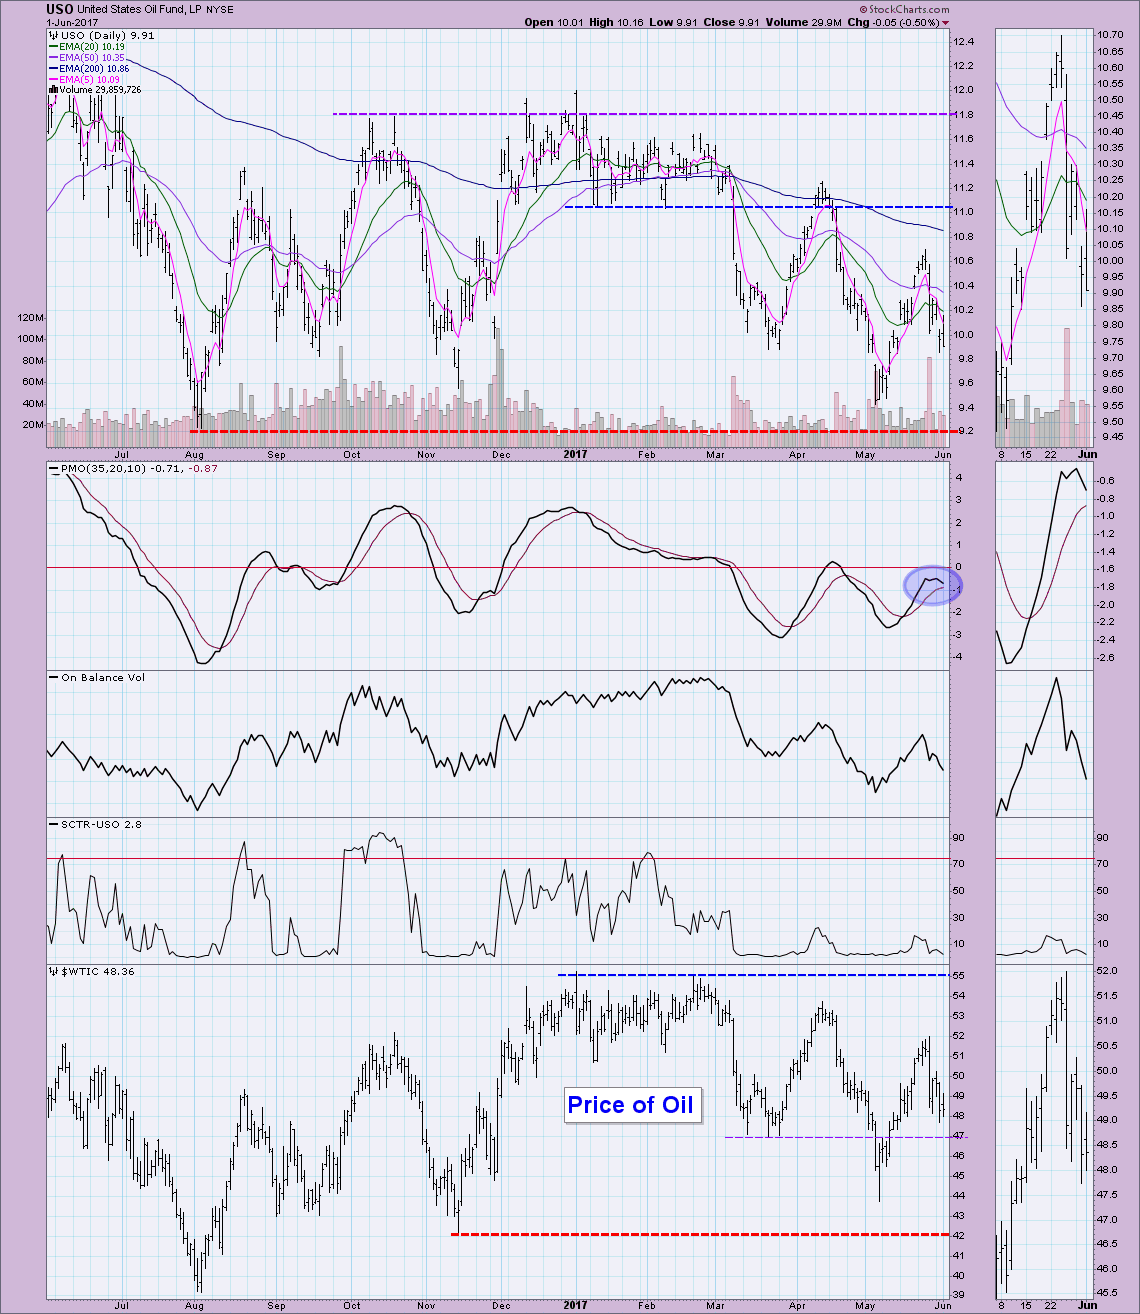
IT Trend Model: NEUTRAL as of 3/8/2017
LT Trend Model: SELL as of 3/9/2017
Nothing positive to say about Oil right now. The PMO is nearing a SELL signal below the zero line which is especially bearish. The Trend Models are configured as negatively as they are able with the fast moving EMAs on the bottom and the slowest on the top. The SCTR has fallen even before it was able to recover. Good news is that Oil is near support around $47 and that could certainly hold up. If the PMO doesn't improve, then we could be headed to test the May lows.
BONDS (TLT)
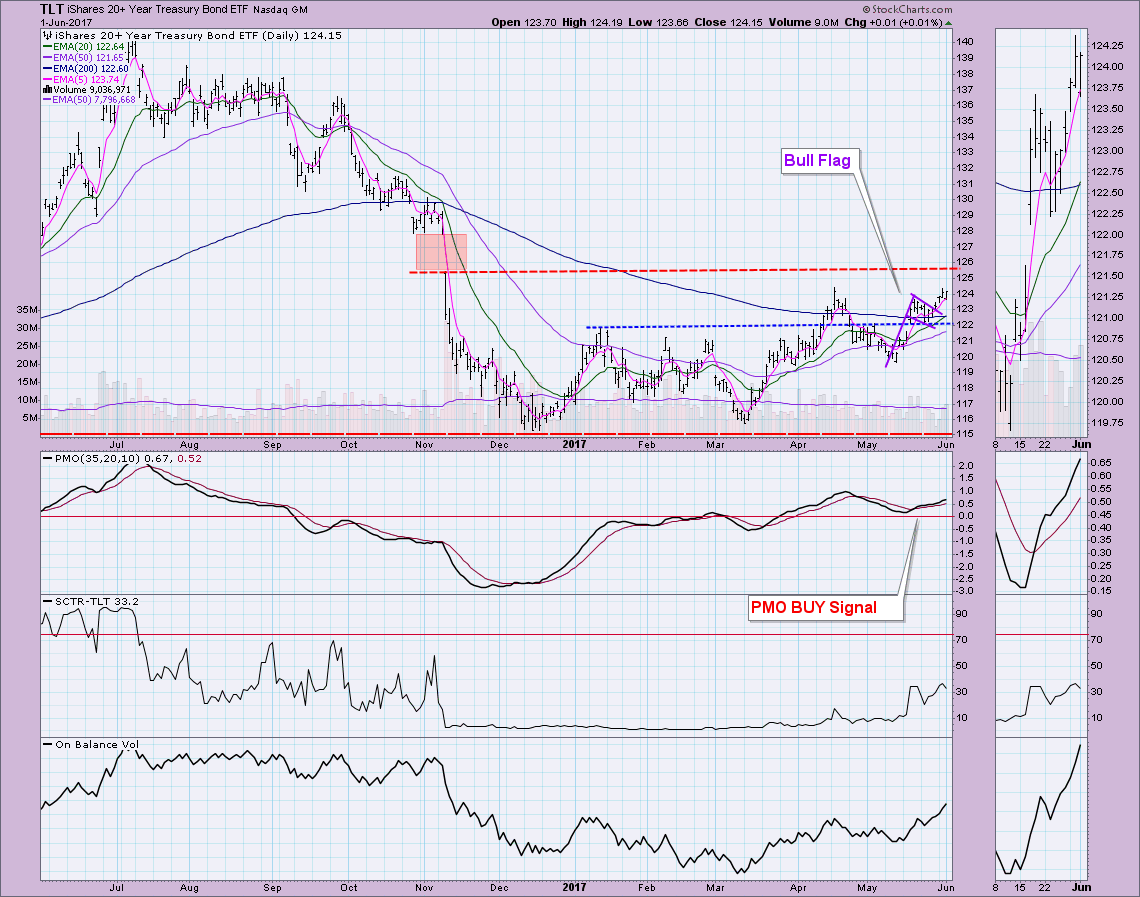
IT Trend Model: BUY as of 3/31/2017
LT Trend Model: SELL as of 11/17/2016
The bull flag executed on TLT. The minimum upside target would be around $128 which also coincides with the top of the November gap. Before we get too excited, the $125.50 level needs to be cleared. Indicators are positive so we should see a breakout.
Helpful DecisionPoint Links:
DecisionPoint Shared ChartList and DecisionPoint Chart Gallery
Price Momentum Oscillator (PMO)
Swenlin Trading Oscillators (STO-B and STO-V)
Technical Analysis is a windsock, not a crystal ball.
Happy Charting!
- Erin
**Don't miss DecisionPoint Commentary! Add your email below to be notified of new updates"**


