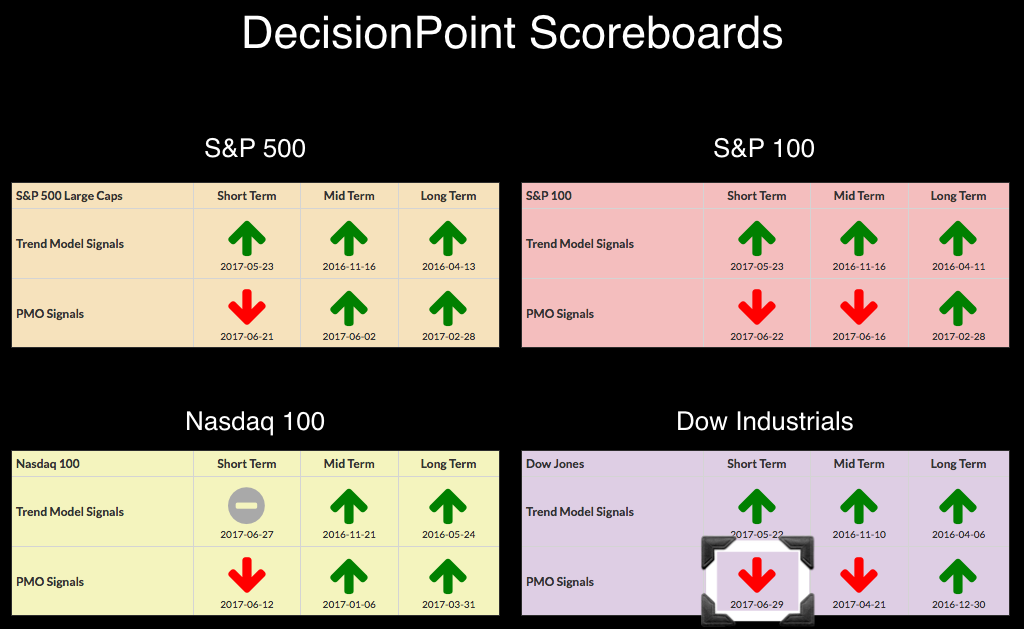
 Today brought a plethora of new DecisionPoint timing signals...all bearish. As far as the DP Scoreboards are concerned, the Dow initiated a PMO SELL signal on the daily chart today. This puts all four indexes on PMO SELL signals. I've included the daily chart of the Dow below the Scoreboards. Heads up... the IT PMO BUY signal on the SPX has disappeared, but the signal isn't final until after trading on Friday. If we get an incredible bounce tomorrow, that signal may be prevented.
The purpose of the DecisionPoint Alert Daily Update is to quickly review the day's action, internal condition, and Trend Model status of the broad market (S&P 500), the nine SPDR Sectors, the U.S. Dollar, Gold, Crude Oil, and Bonds. To ensure that using this daily reference will be quick and painless, we are as brief as possible, and sometimes we let a chart speak for itself.
SIGNALS: Here we include charts of any important signal changes triggered today by our Intermediate-Term Trend Model.
New Intermediate-Term Trend Model Neutral signal on Gold. I'll discuss this in the section on Gold at the end of the blog.
NOTE: Mechanical trading model signals define the implied bias of the price index based upon moving average relationships, but they do not necessarily call for a specific action. They are information flags that should prompt chart review. Further, they do not call for continuous buying or selling during the life of the signal. For example, a BUY signal will probably return the best results if action is taken soon after the signal is generated. Additional opportunities for buying may be found as price zigzags higher, but the trader must look for optimum entry points. Conversely, exit points to preserve gains (or minimize losses) may be evident before the model mechanically closes the signal.
STOCKS
IT Trend Model: BUY as of 11/15/2016
LT Trend Model: BUY as of 4/1/2016
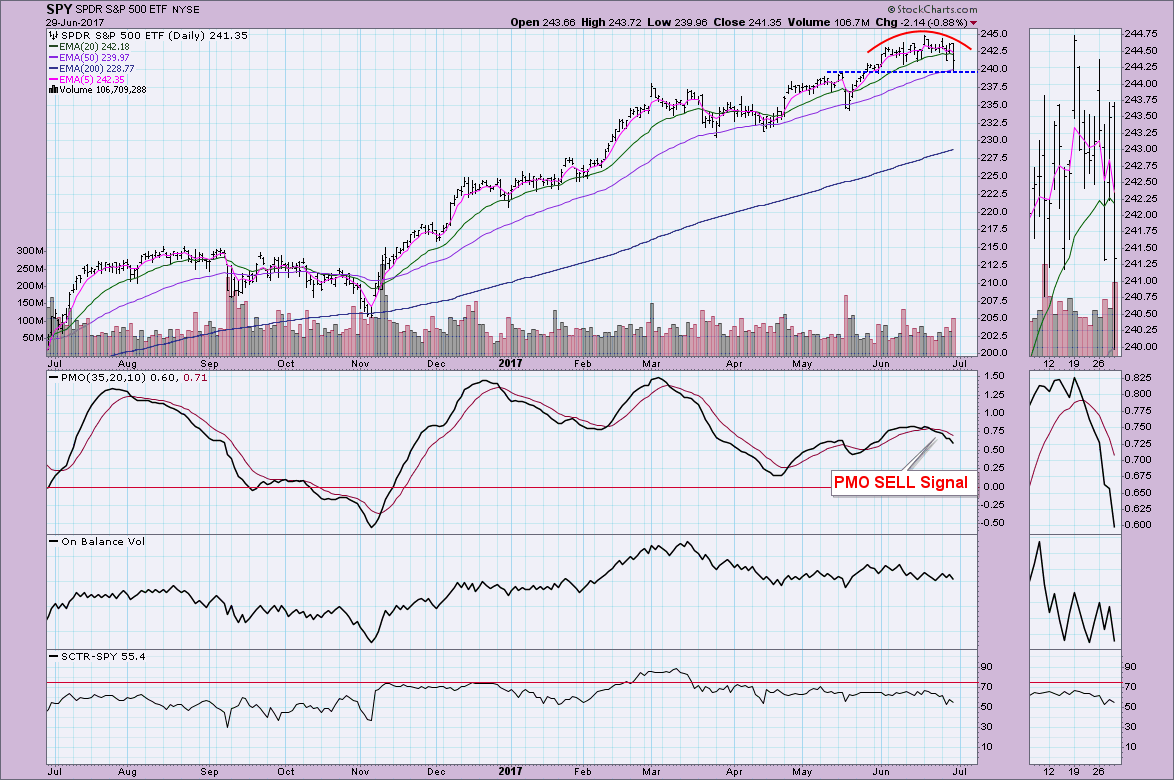
The drop happened early, but price recovered when it hit support at 240.
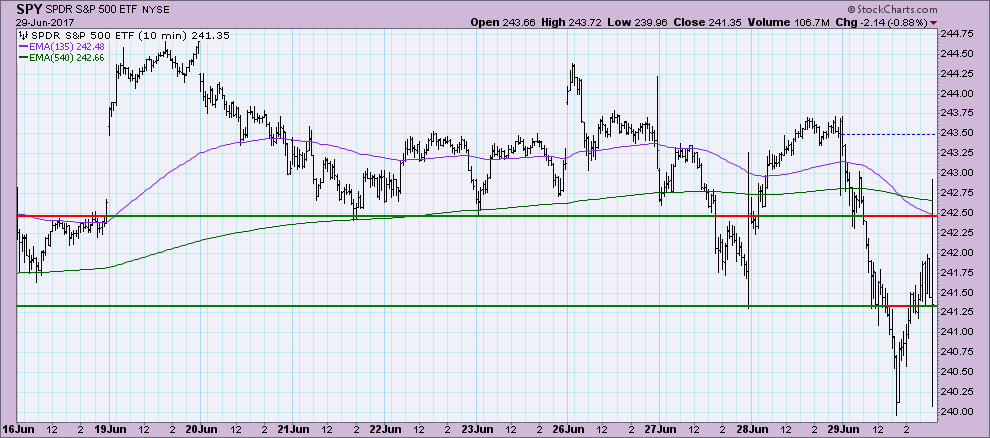
That support lines up perfectly with the top in May. I had thought we would see a pullback to 240. Given the rounded top and PMO SELL signal (and pending PMO SELL signal on the weekly chart), I'm afraid this isn't likely the downside stopping point.
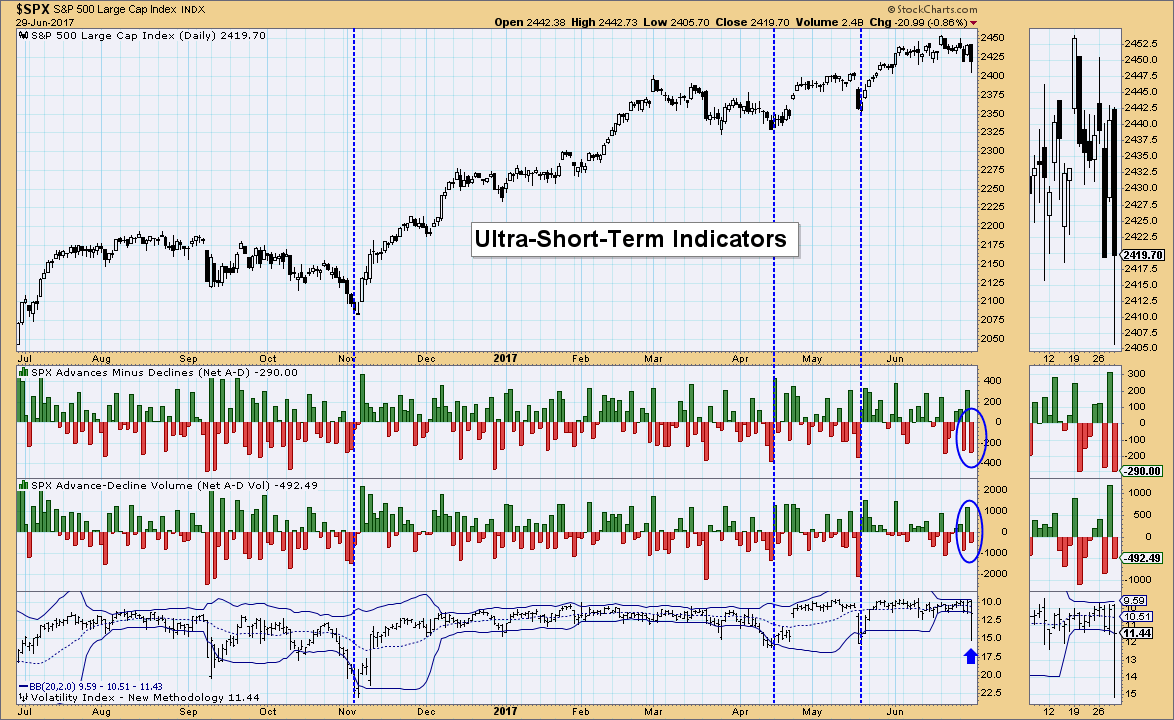
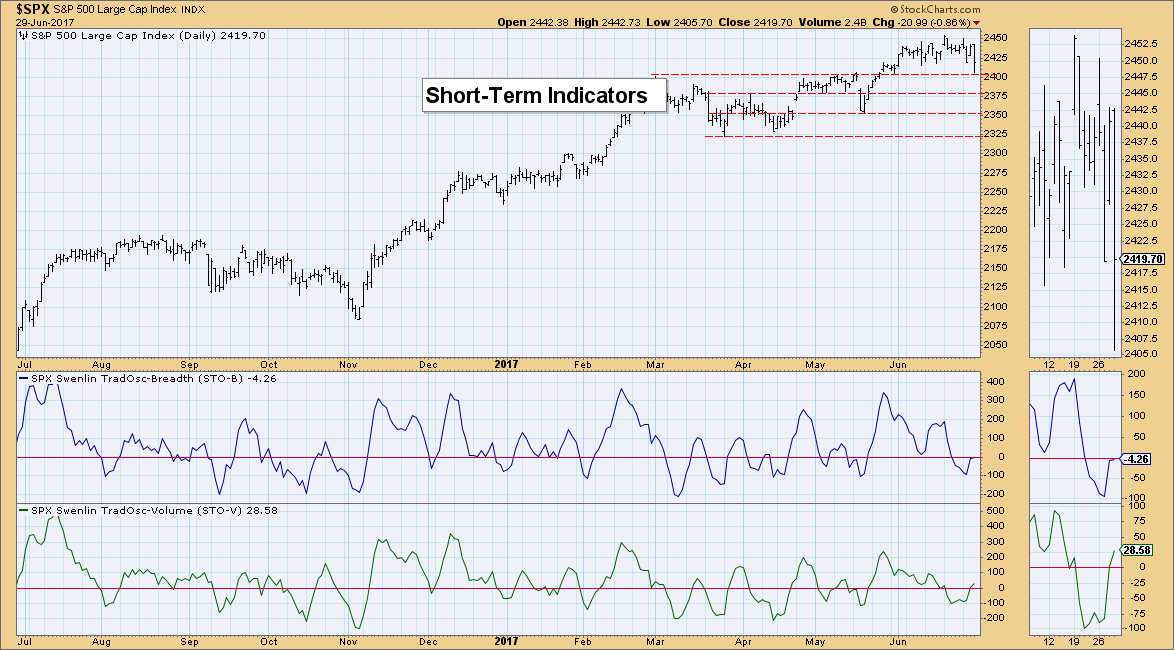
Ultra-Short-Term Indicators: Good news is that at least in the shorter term, indicators are looking pretty good. We saw some climactic breadth readings and a dip by the VIX well-below it's lower Bollinger Band. I read this as a selling exhaustion so I would expect to see a bounce tomorrow.
Short-Term Indicators: These indicators are bullish and sitting in neutral. I don't like that the STO-B is avoiding positive territory right now, but ultimately both indicators are rising, suggesting a bounce soon too.
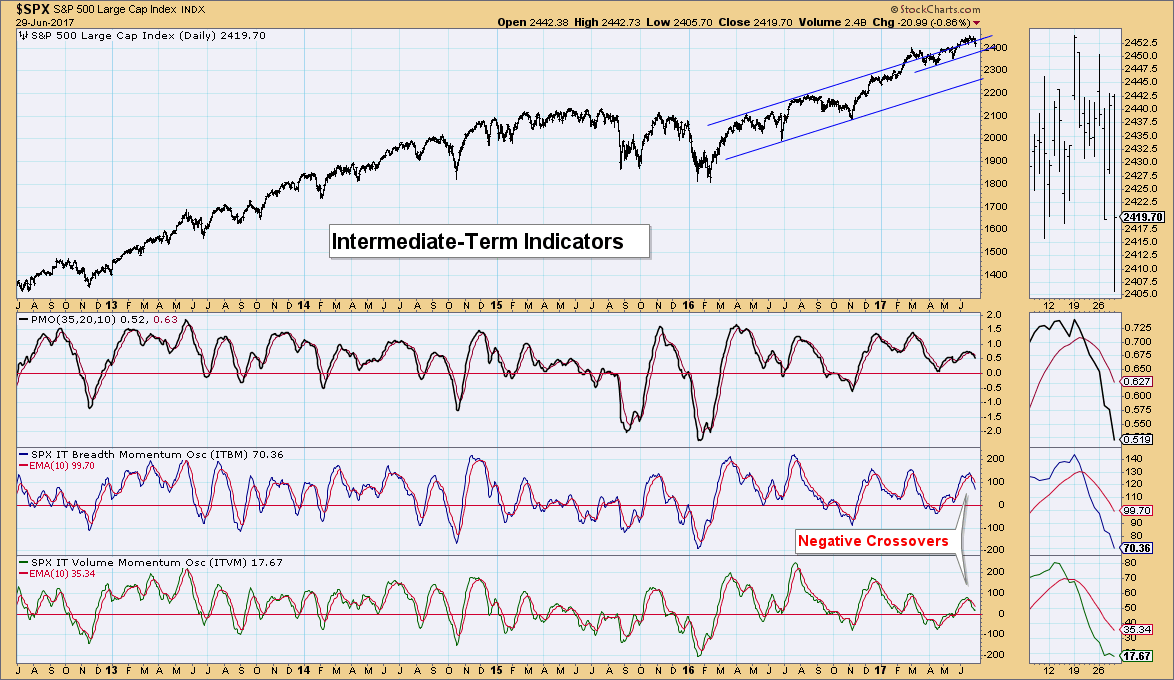
Intermediate-Term Indicators: Past the short term, intermediate term is bearish. They are both declining after negative crossovers and there is plenty of room for them to continue lower.
Conclusion: If we get a bounce, I don't think it will be enough to get to new all-time highs. At this point, the market has been enjoying a strong bullish tailwind, but it seems to be slowly going away along with momentum. Best case is more consolidation between all-time highs and 240, but the more likely case is a drop below 240 to the next line of support at 237.50 March highs.
DOLLAR
IT Trend Model: NEUTRAL as of 3/21/2016
LT Trend Model: SELL as of 05/24/2017
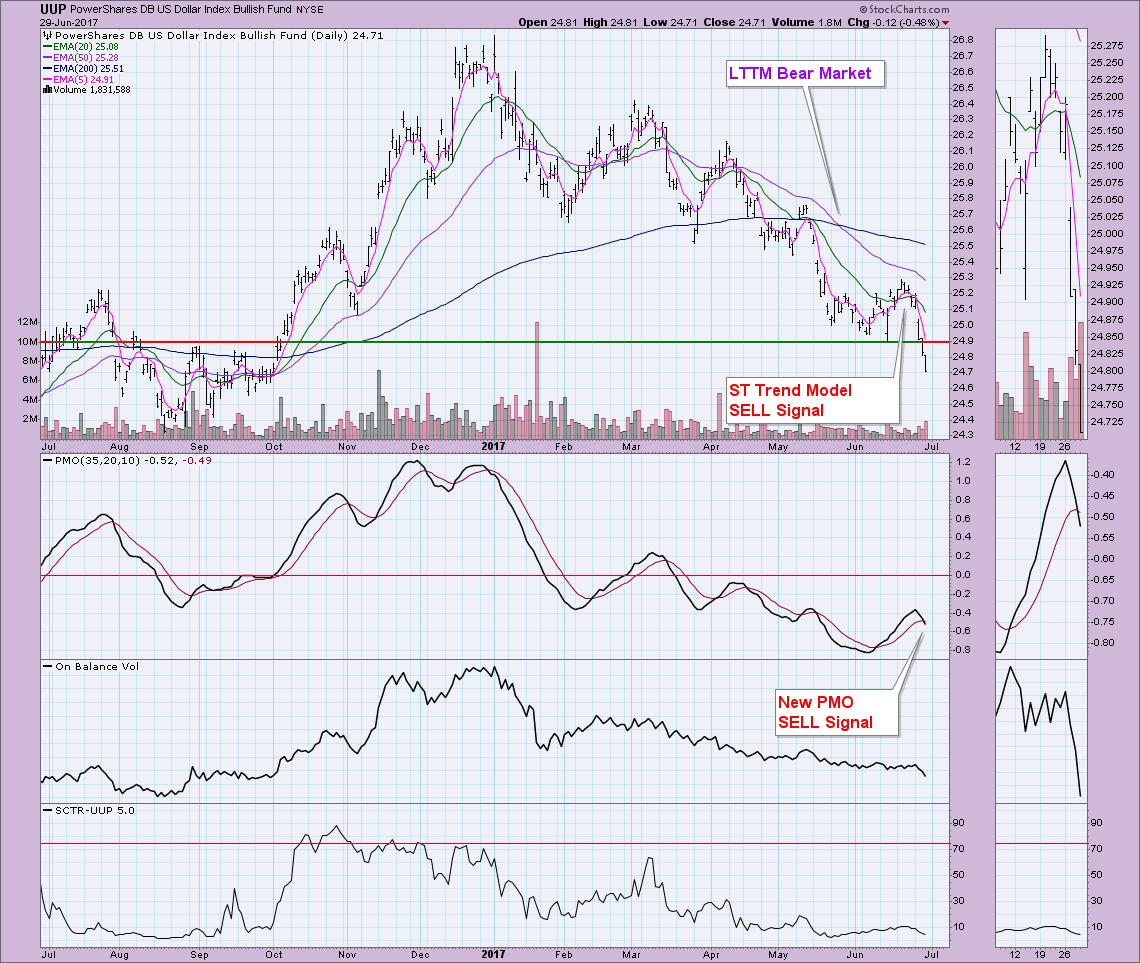
The PMO crossed below its signal line triggering a SELL signal on UUP. Despite the 50/200-EMA negative crossover, I did think the bounce in mid-June was the beginning of a longer rally than what we got. Now we have price well below support and heading to test the August low at around $24.35. With all of the bearish signals and indicators, I am looking for a test of that support at $24.35.
GOLD
IT Trend Model: BUY as of 5/22/2017
LT Trend Model: BUY as of 4/12/2017
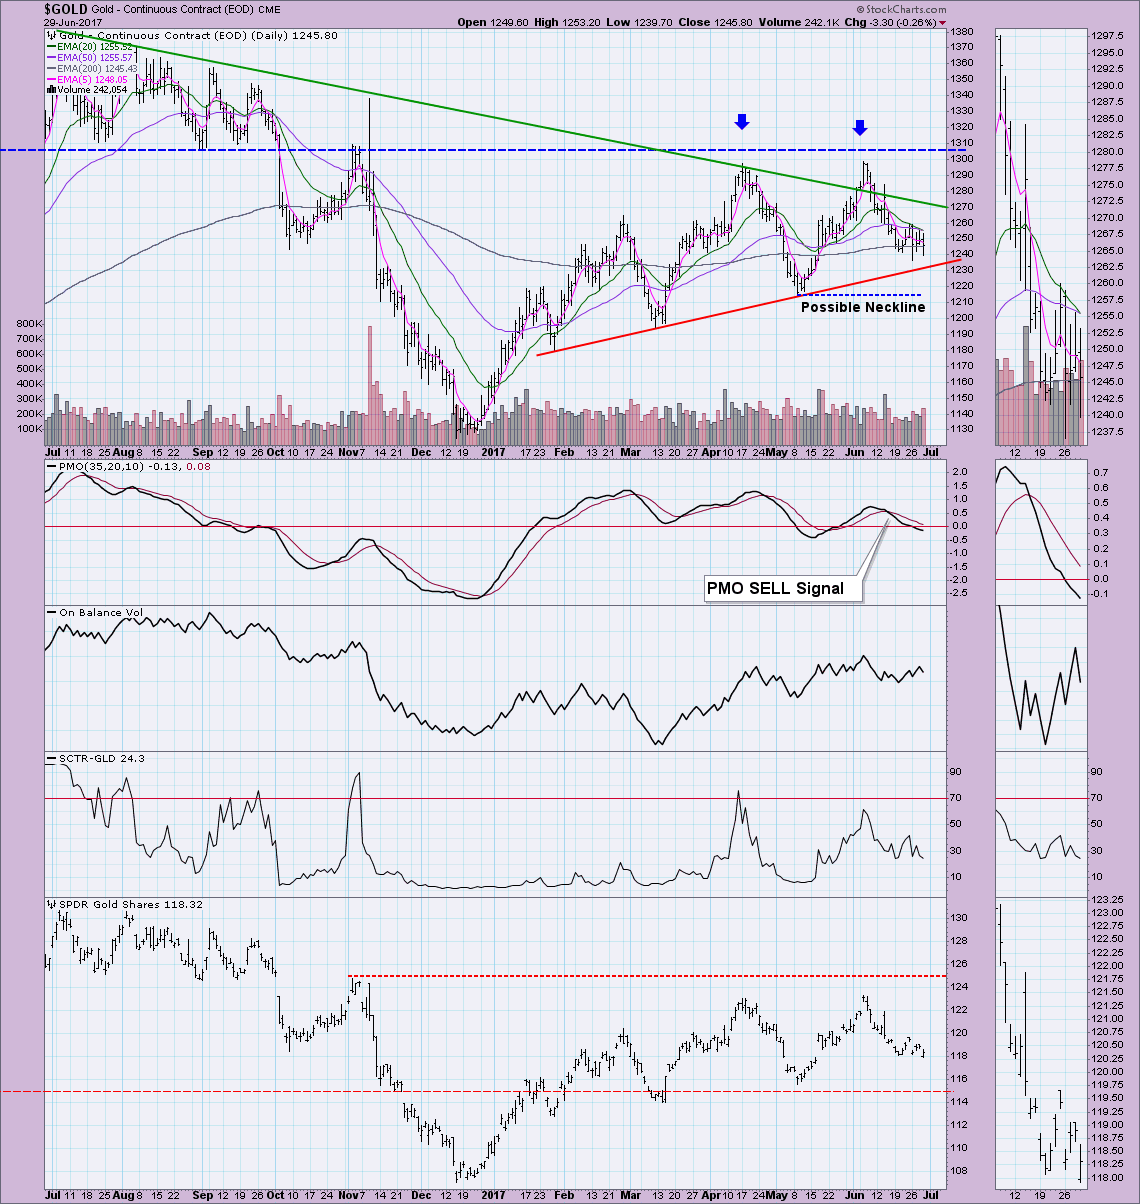
Gold actually looks ready to rally off the rising bottoms support line. However, there are many problems. First, a declining PMO suggests that even after a period of consolidation, momentum is still negative. The SCTR has tailed off. Short term, the OBV looks pretty decent with the current rising tops and bottoms, but to see the Dollar drop almost 0.5% and not get a corresponding rise in Gold tells me there were plenty of sellers of Gold today.
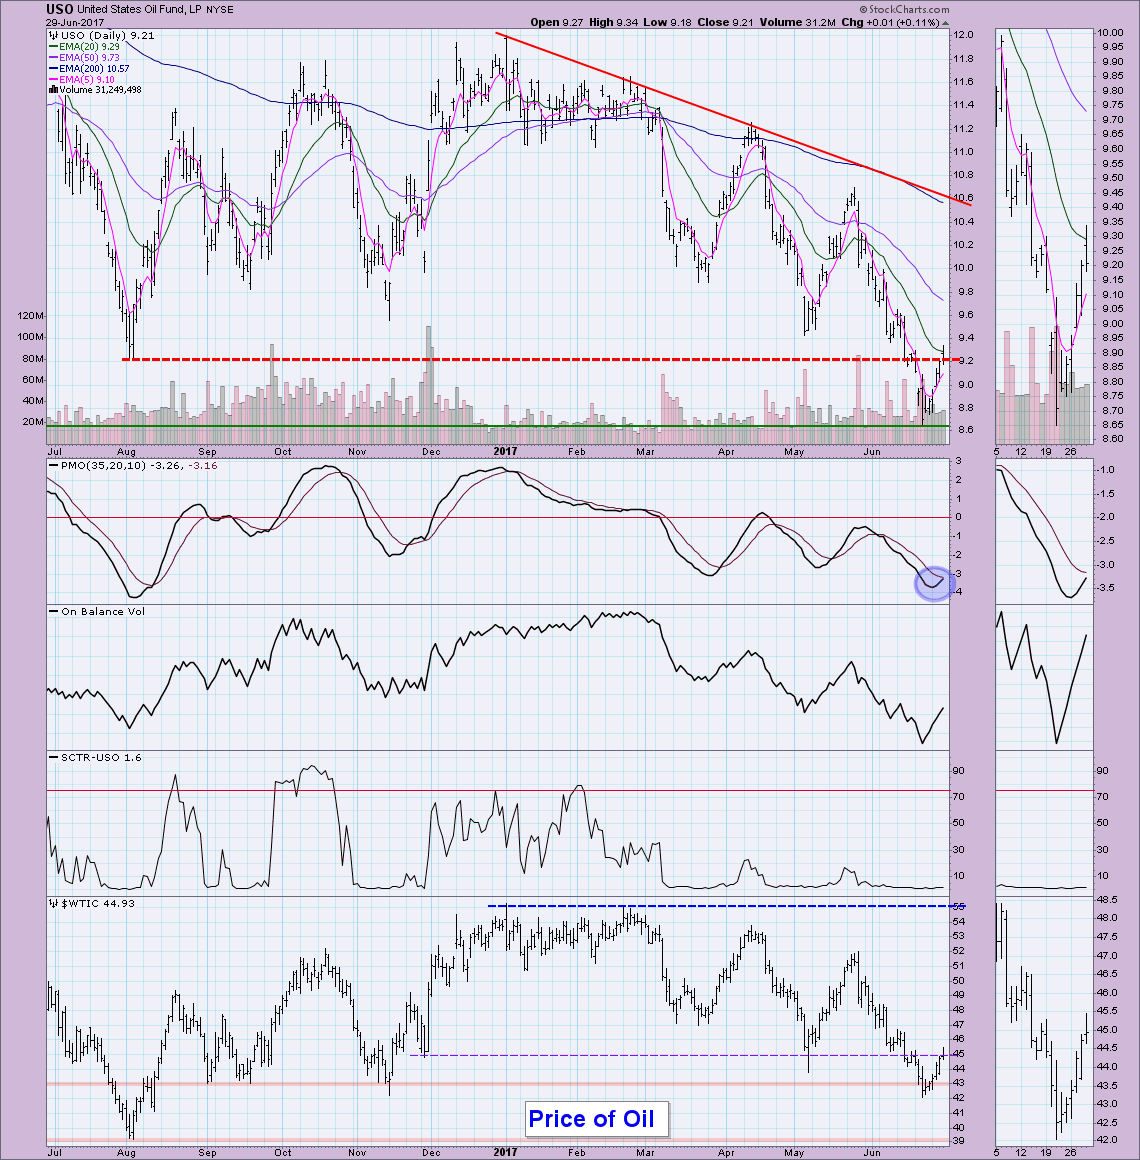
CRUDE OIL (USO)
IT Trend Model: NEUTRAL as of 3/8/2017
LT Trend Model: SELL as of 3/9/2017
I like today's breakout, but USO ultimately closed on support at $9.20. The PMO is looking for a BUY signal and if the breakout holds, it will of course trigger. I like the rising volume/OBV but note that Oil also has butted up against resistance at $45/barrel and it didn't close above it. It's likely time for a pullback which could lead to a possibly better entry.
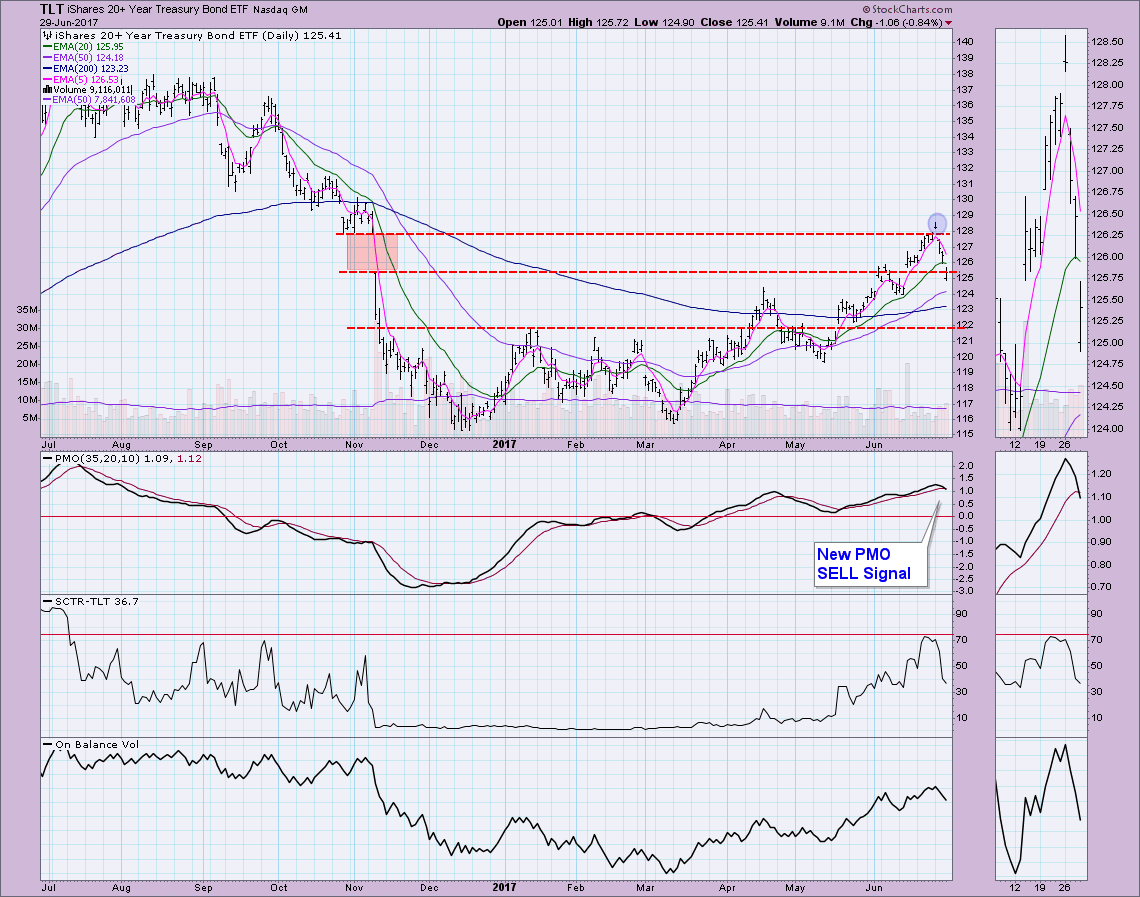
BONDS (TLT)
IT Trend Model: BUY as of 3/31/2017
LT Trend Model: BUY as of 6/16/2017
Bonds took a dive just after closing the gap from last Fall. Now we have a new PMO SELL signal. The 5-EMA is crashing toward the 20-EMA so I suspect we'll see a new ST Trend Model Neutral signal soon. (Remember it would be "neutral" because the 20-EMA is above the 50-EMA). This PMO SELL signal arrived in overbought territory, so this could be a long and painful decline. I'd look at the $122 as the next support level.
Helpful DecisionPoint Links:
DecisionPoint Shared ChartList and DecisionPoint Chart Gallery
Price Momentum Oscillator (PMO)
Swenlin Trading Oscillators (STO-B and STO-V)
Technical Analysis is a windsock, not a crystal ball.
Happy Charting!
- Erin
**Don't miss DecisionPoint Commentary! Add your email below to be notified of new updates"**


