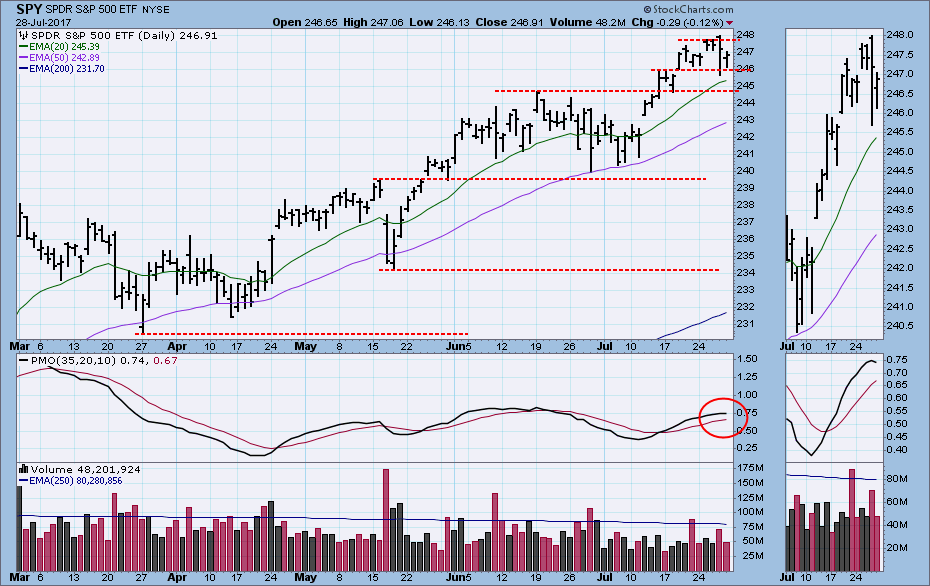
There is always something for the market to wait for. Last week it was options expiration, and this week it was the Fed meeting. There was nothing new from the Fed, so there were no market hiccups as a result. SPY made new, all-time highs again this week. On Thursday price took a shot at the bottom of the short-term trading range, but it recovered by the end of the day. While the trading range remained intact, Friday's price action hinted at the possibility of a short-term top, as the daily PMO (Price Momentum Oscillator) topped.
Monday will be the last trading day of the month, but I decided to include the Monthly Wrap in this posting, gambling that there will be no significant change to the monthly outlook as a result of Monday's trading.
The DecisionPoint Weekly Wrap presents an end-of-week assessment of the trend and condition of the stock market (S&P 500), the U.S. Dollar, Gold, Crude Oil, and Bonds.
STOCKS
IT Trend Model: BUY as of 11/15/2016
LT Trend Model: BUY as of 4/1/2016
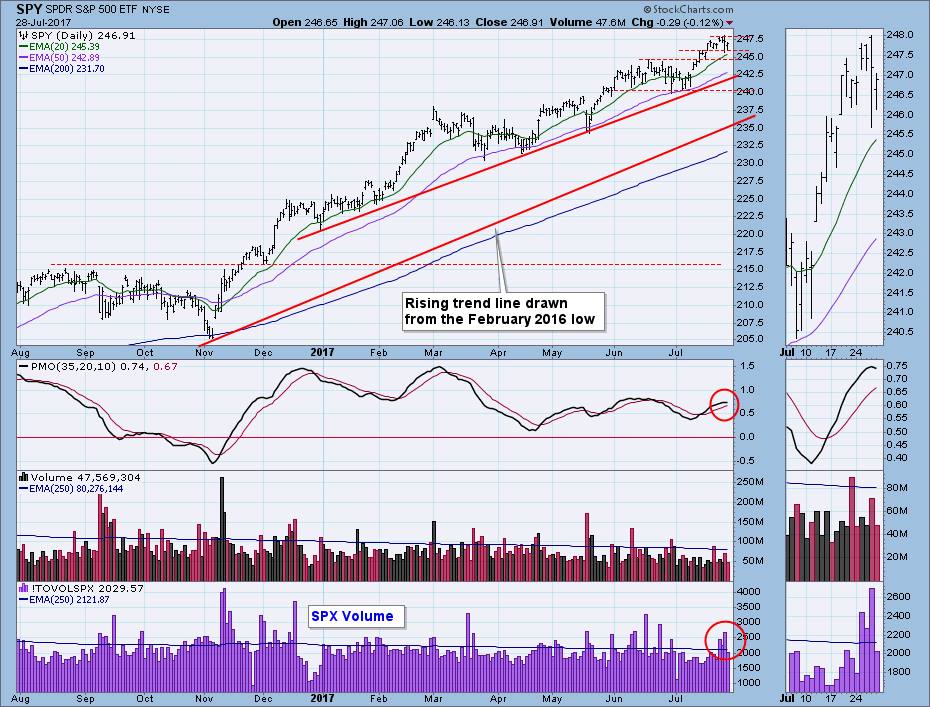
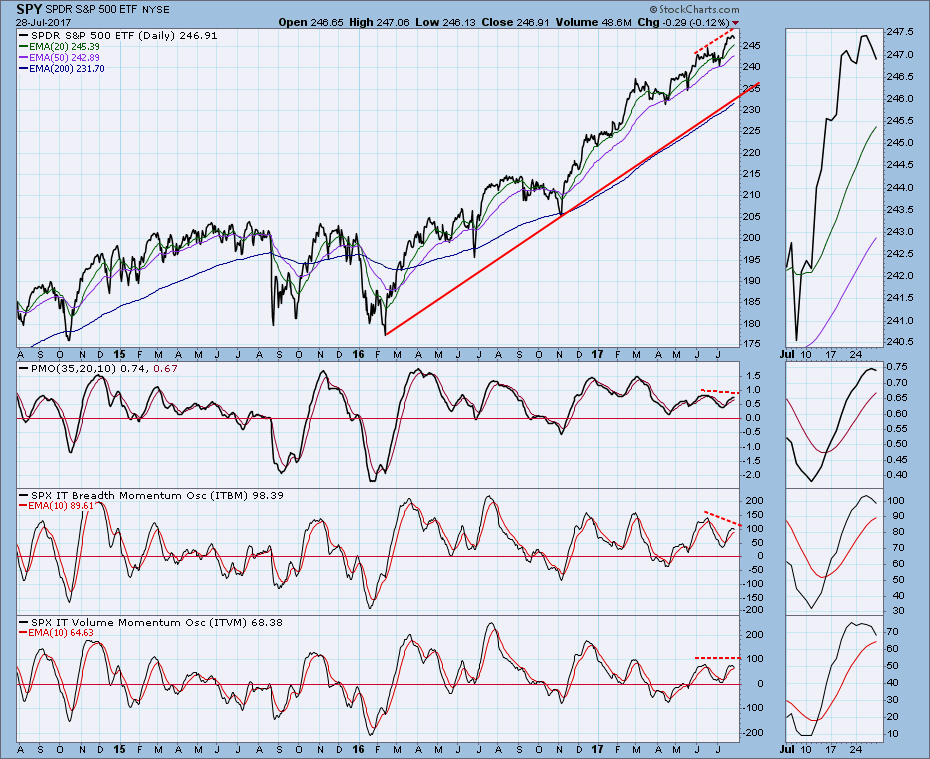
Price has moved to well above the cyclical bull market rising trend line. It has been so persistent that I have added another rising trend line to track the trend since the beginning of 2017. As mentioned in my opening remarks, the daily PMO has topped. Associated with this is unusually high S&P 500 volume (bottom panel) in the middle of this week, which could be a sign of distribution. This is the reason that I include S&P 500 volume on this chart. SPY volume reflects interest in SPY, which is usually different from the volume for all the components of the S&P 500 Index.
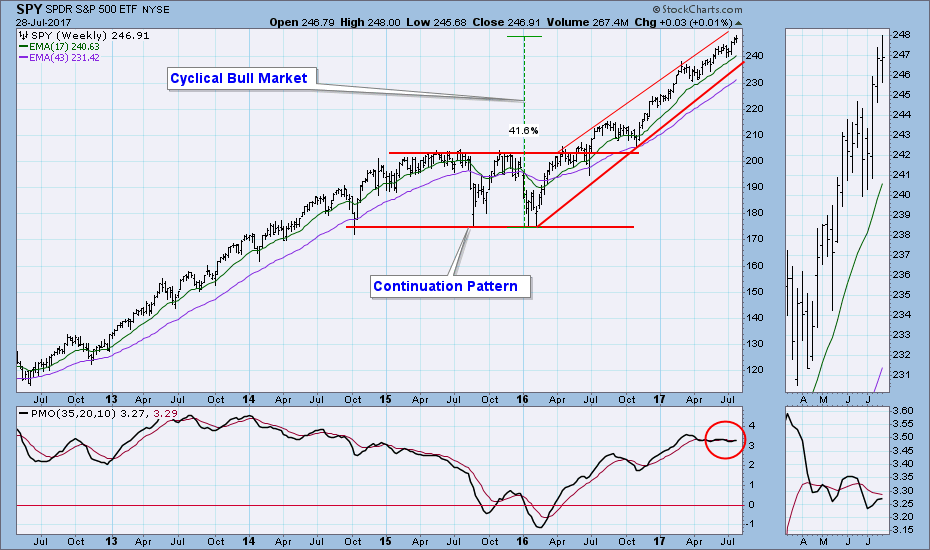
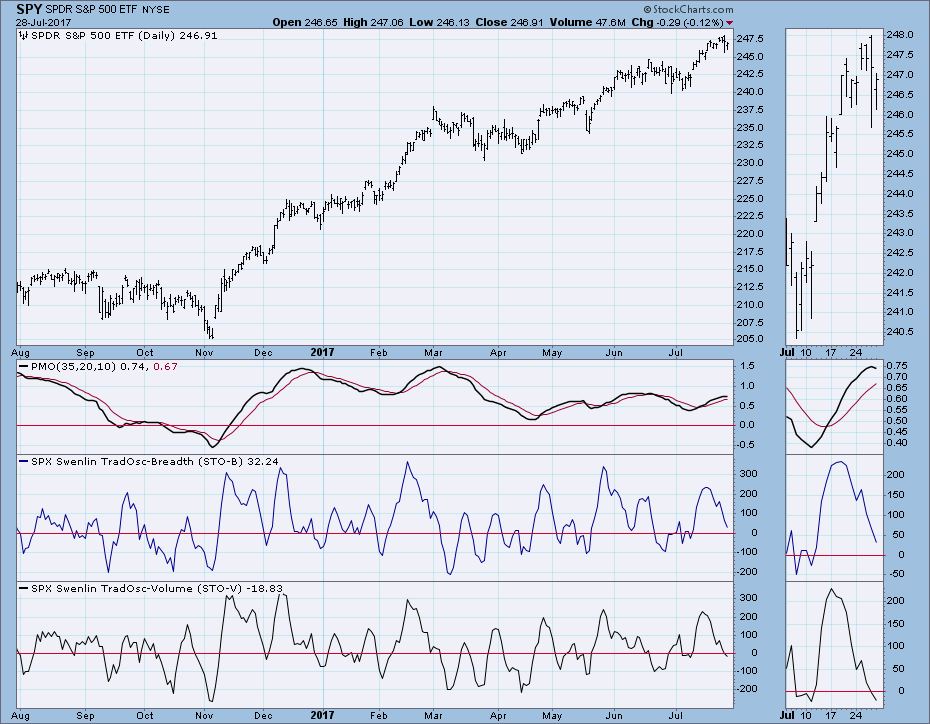
On the weekly chart we can see the rising trend channel of the cyclical bull market. The flat weekly PMO is the product of price moving higher at a fairly steady pace.
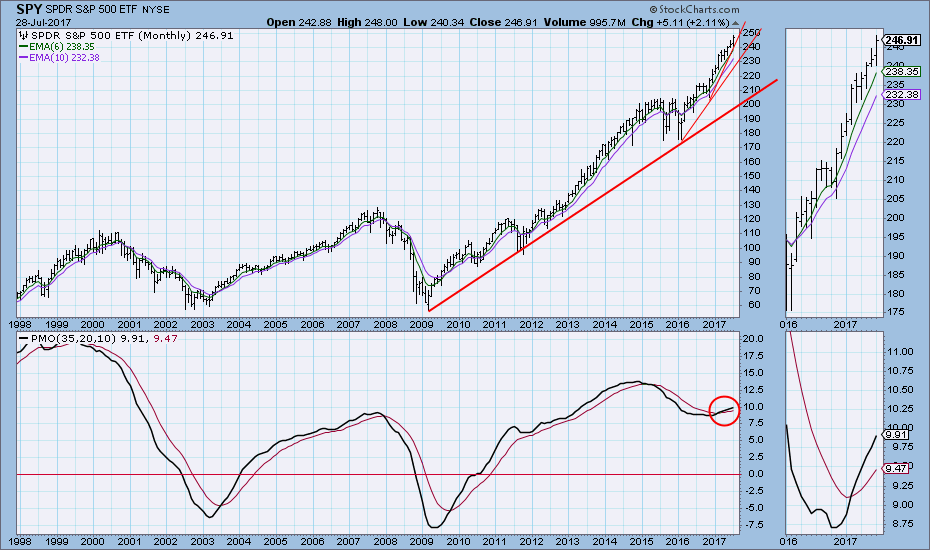
The monthly chart clearly shows how the rising trend lines are accelerating away from the primary secular bull market trend line. Please note the extreme departure of price from the primary trend line.
Climax Indicators: This week there was a fairly high reading for SPX New Highs, which I interpret as a buying climax. As you can see in previous instances, climaxes can be followed by a period of price churn. There were also short, sharp price declines in March and May that were associated with the churning period.
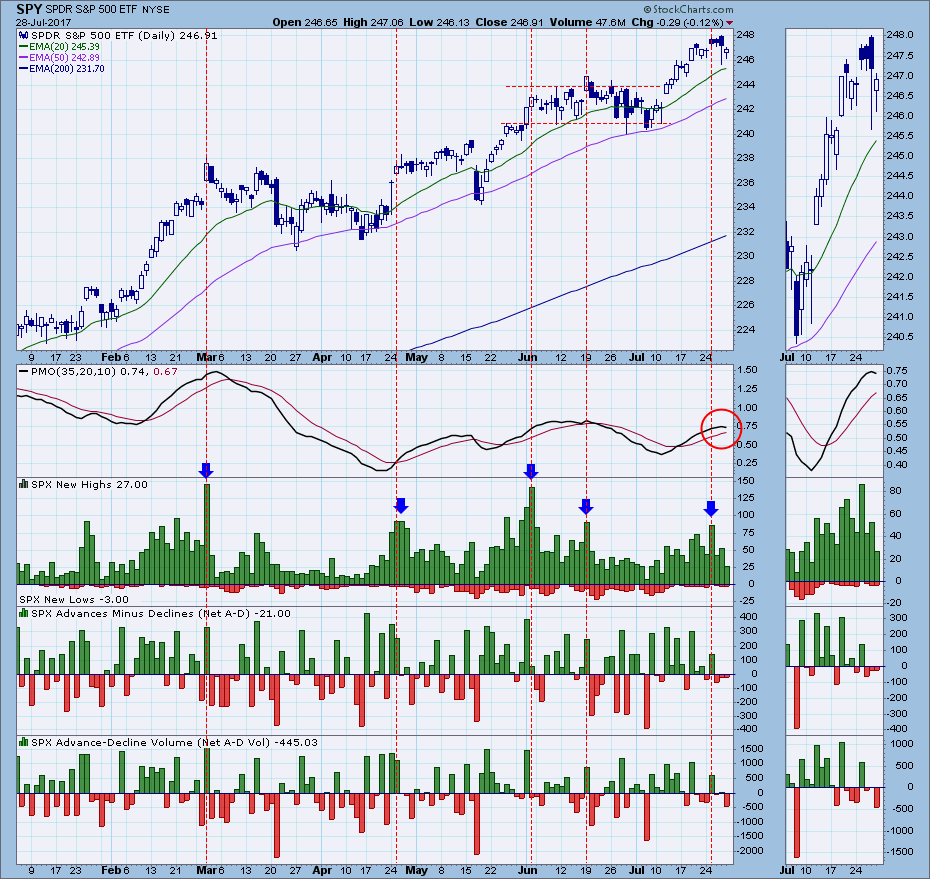
Short-Term Market Indicators: These indicators are neutral and can accommodate a substantial move in either direction. These indicators normally top ahead of price, which they did last week. This week, as the indicators moved lower, we saw price topping and possibly beginning to correct.
Intermediate-Term Market Indicators: All of these indicators have topped and have formed negative divergences, so I assume that some type of corrective action will follow.
Conclusion: Once again we have indications that the market may be on the verge of a correction. The most compelling are the intermediate-term indicators on the chart just above. How big a correction? I really have no idea, but I do know that, since the election, it hasn't paid to be too bearish.
DOLLAR
IT Trend Model: NEUTRAL as of 3/21/2016
LT Trend Model: SELL as of 5/24/2017
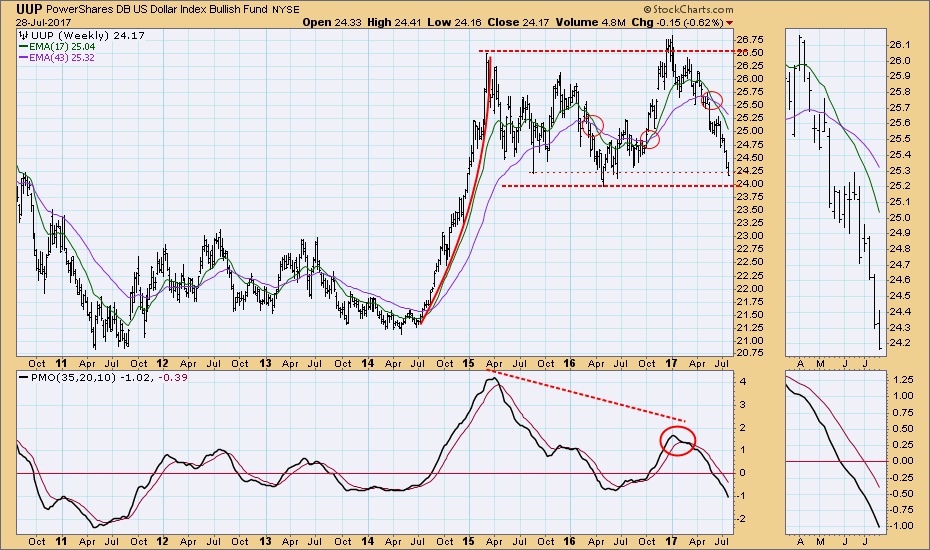
The dollar (UUP) continues to accelerate downward. We need to look at longer-term charts to get some idea where it could be headed.
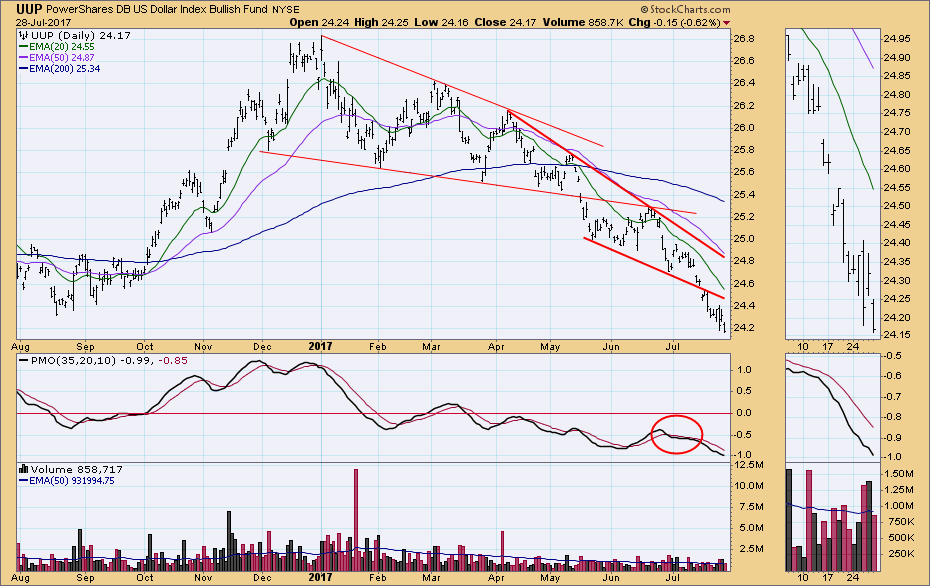
UUP slipped below possible support this week, and the next prominent support level is just below at 24.00. The weekly PMO is at its lowest level in over five years.
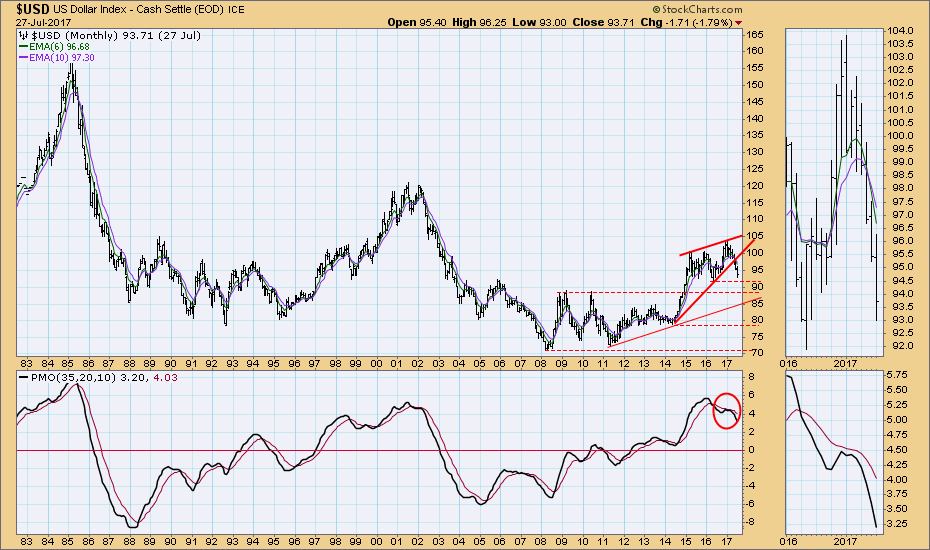
The long-term picture for the U.S.Dollar Index ($USD) is quite negative. It has broken down from a rising wedge, and the monthly PMO has topped below its signal line. I have noted possible support levels.
GOLD
IT Trend Model: NEUTRAL as of 6/29/2017
LT Trend Model: BUY as of 4/12/2017
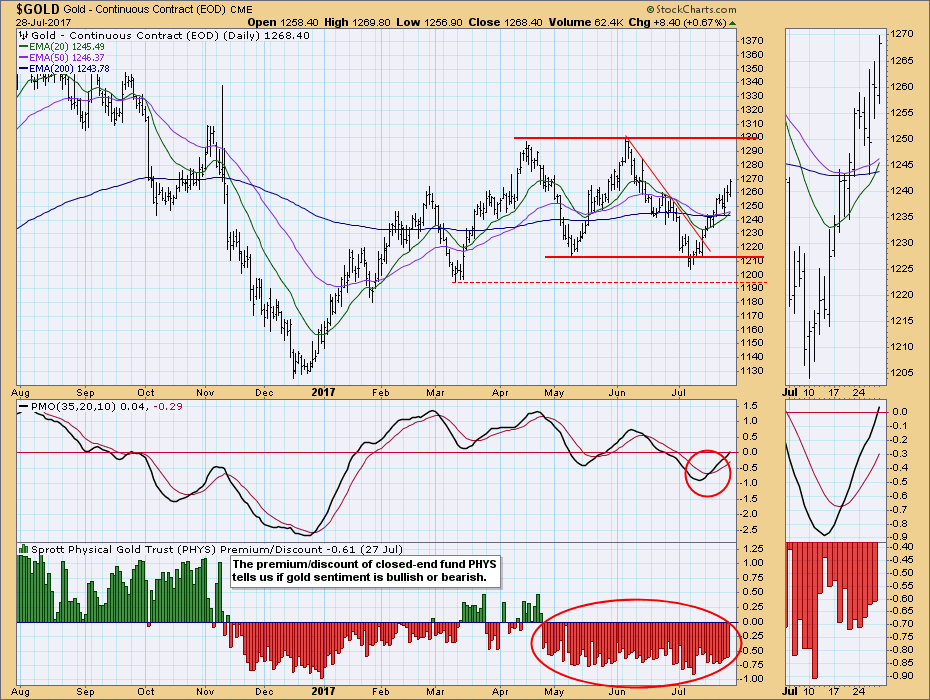
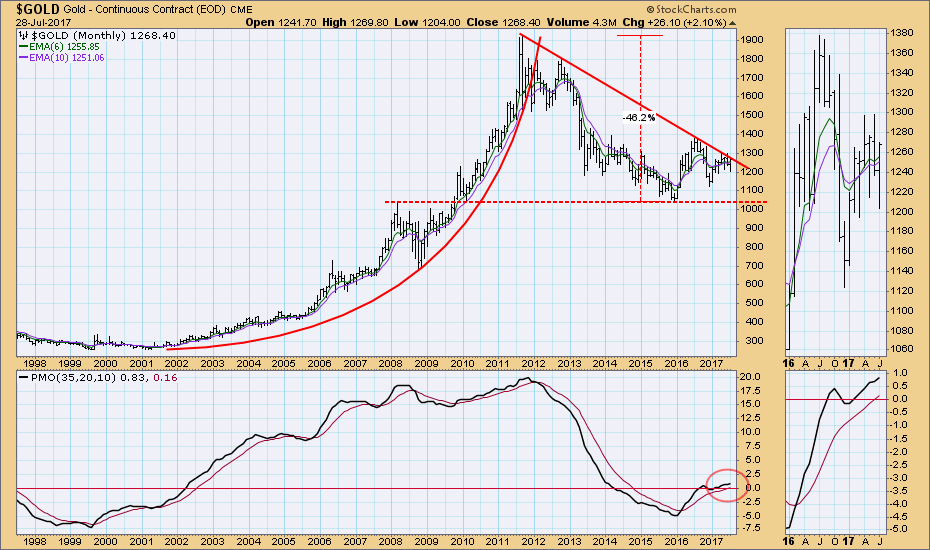
For several months gold has been in a trading range. Considering that the dollar (UUP above) has been falling during that time, we can conclude that there is an intrinsic weakness in gold that offsets some of the advantage it should gain from a weak dollar. Gold is heading to the top of its current trading range, but there is significant resistance being encountered right now that is not visible on the daily chart. (See the weekly chart below.) It would be most encouraging if price can reach the top of that range. Sentiment is still negative.
Gold has been turned back from the declining tops line numerous times in the last two years. It is currently attacking that line again, and the rising weekly PMO offers some hope that a clean break will finally take place.
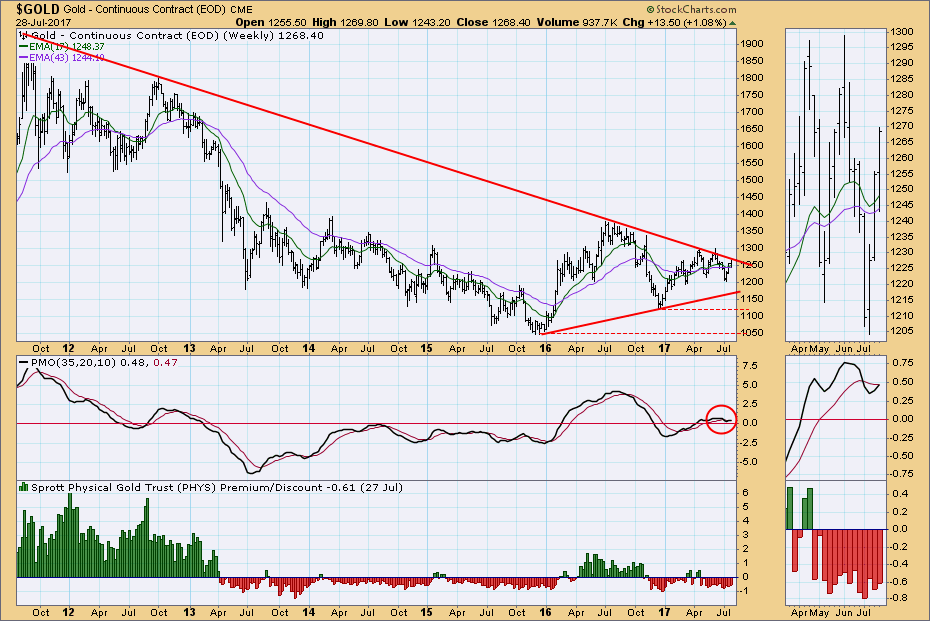
I have been assuming that the 2015 price low was the end of the gold bear market that began off the 2011 top. That is still my assumption, but final confirmation must be provided by a breakout price breaking above the long-term declining tops line, with which it is currently struggling.
CRUDE OIL (USO)
IT Trend Model: NEUTRAL as of 3/8/2017
LT Trend Model: SELL as of 3/9/2017
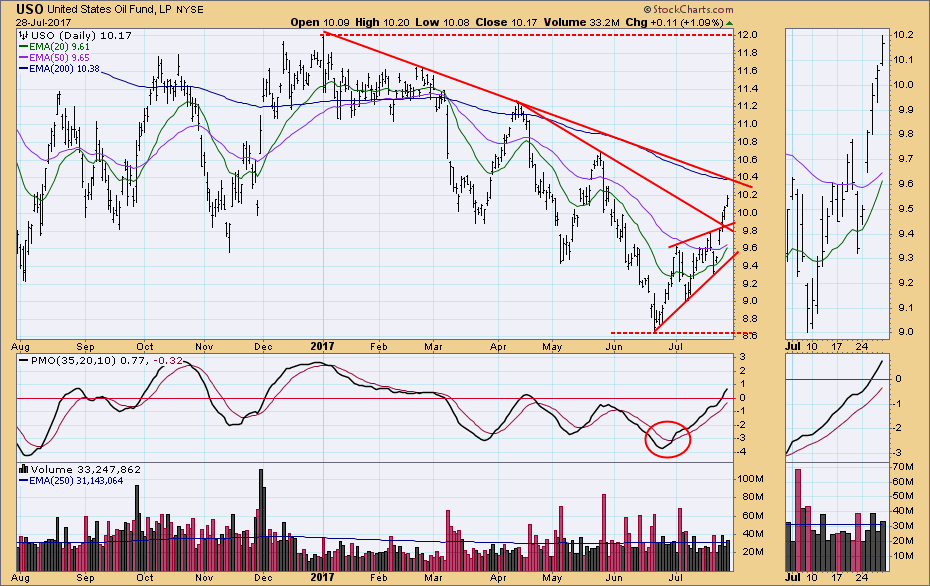
Crude oil is subject to vigorous price moves followed by sharp reversals. The current daily chart looks very bullish at present. Price broke out of a bearish rising wedge this week, and it also broke above a declining tops line. A less accelerated declining tops line and the 200EMA are just ahead, both ready to offer longer-term resistance. Note that the 20EMA is rapidly closing on the 50EMA, and an upside crossover may take place next week, which will generate an IT Trend Model BUY signal.
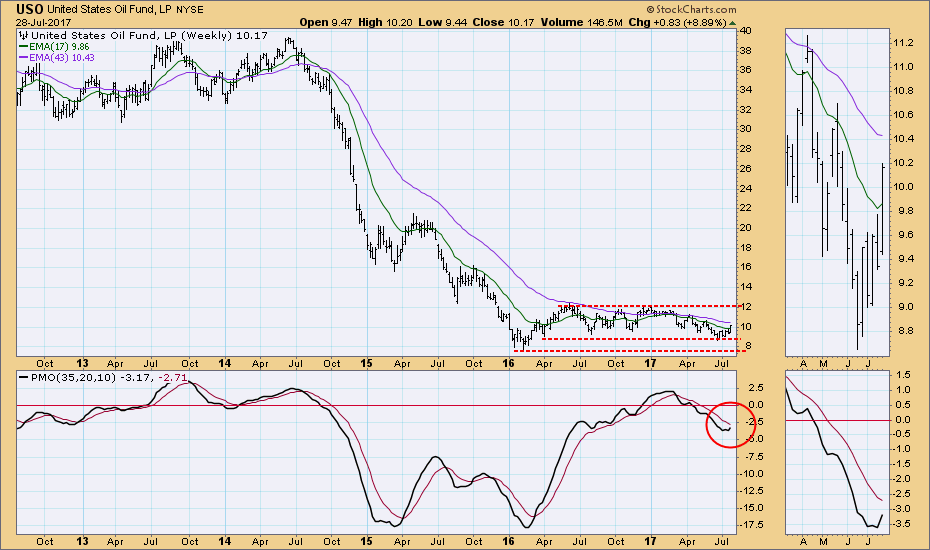
The weekly PMO turned up this week, and this week's price breakout on the daily chart has prompted me to redefine (lower) the bottom of the trading range slightly to include the recent price bottom.
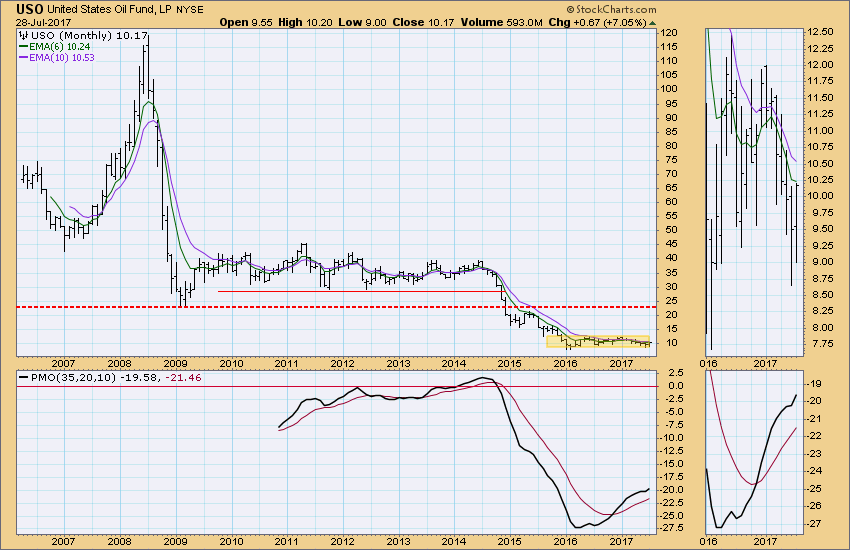
The monthly chart gives a good demonstration of how a rising PMO is not necessarily always a good thing. In this case price has been running sideways for a year-and-a-half, which is a rate-of-change of zero. As this lack of progress is plugged into the PMO calculation, it will cause the PMO to drift back to the zero line. So it is good that the PMO is rising, but it doesn't actually signal a buying opportunity in this time frame.
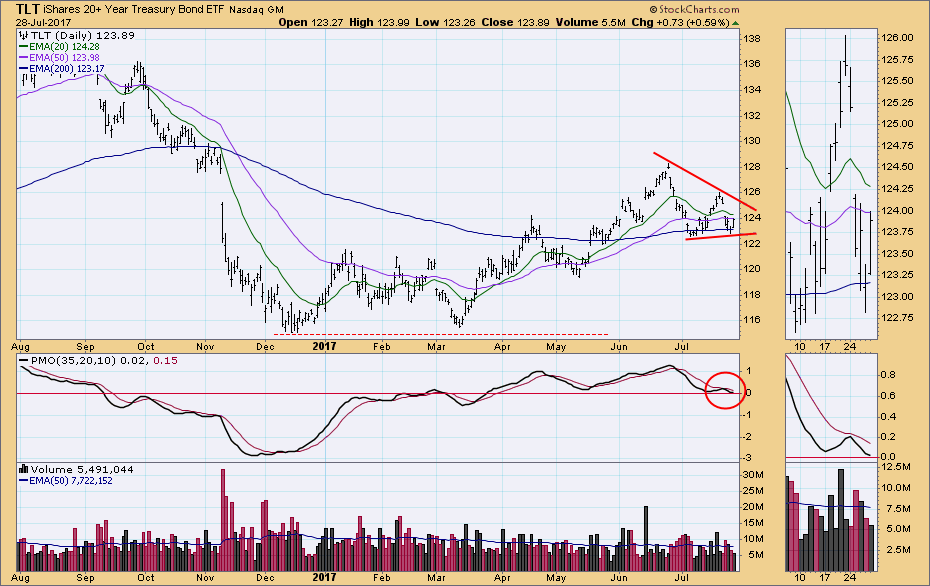
BONDS (TLT)
IT Trend Model: BUY as of 3/31/2017
LT Trend Model: BUY as of 6/16/2017
While longer-term trends are in play on the weekly and monthly charts below, on the daily chart price is being compressed into a short-term ascending triangle. Friday's bounce promises to turn the daily PMO up if price continues up next week.
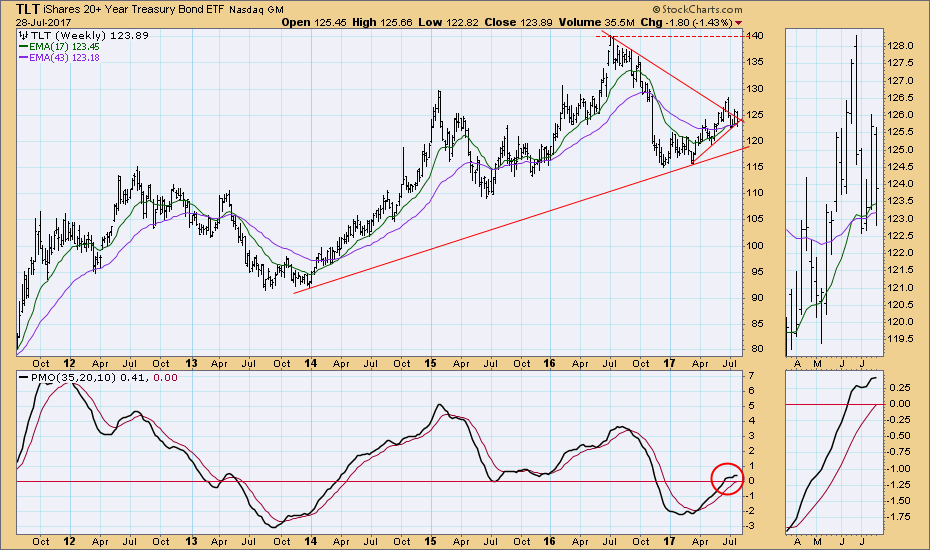
Despite escape attempts, price is still jammed into the apex of a triangle. The weekly PMO is barely rising and a break down seems likely.
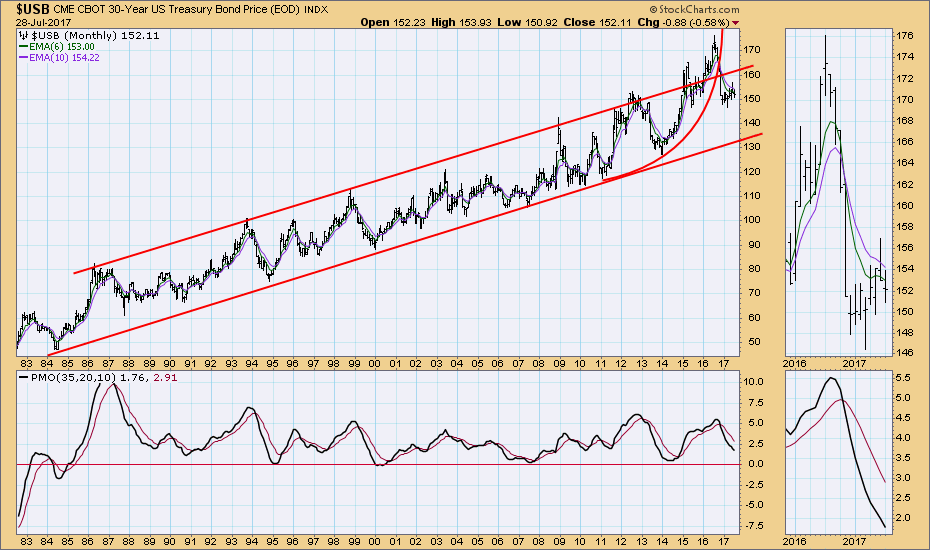
The long-term view provided by the monthly $USB chart shows a parabolic climax as price broke through the top of a long-term trading range. There was subsequently a breakdown, and then a bounce early this year. July's price action maintained the four-month rising trend, but the monthly PMO is falling, promising lower prices in this time frame.
**Don't miss the DecisionPoint Alert Commentary! Go to the "Notify Me" box toward the end of this blog page to be notified as soon as it is published.**
Technical Analysis is a windsock, not a crystal ball.
Happy Charting!
- Carl
NOTE: The signal status reported herein is based upon mechanical trading model signals, specifically, the DecisionPoint Trend Model. They define the implied bias of the price index based upon moving average relationships, but they do not necessarily call for a specific action. They are information flags that should prompt chart review. Further, they do not call for continuous buying or selling during the life of the signal. For example, a BUY signal will probably (but not necessarily) return the best results if action is taken soon after the signal is generated. Additional opportunities for buying may be found as price zigzags higher, but the trader must look for optimum entry points. Conversely, exit points to preserve gains (or minimize losses) may be evident before the model mechanically closes the signal.
Helpful DecisionPoint Links:
DecisionPoint Shared ChartList and DecisionPoint Chart Gallery
Price Momentum Oscillator (PMO)
Swenlin Trading Oscillators (STO-B and STO-V)


