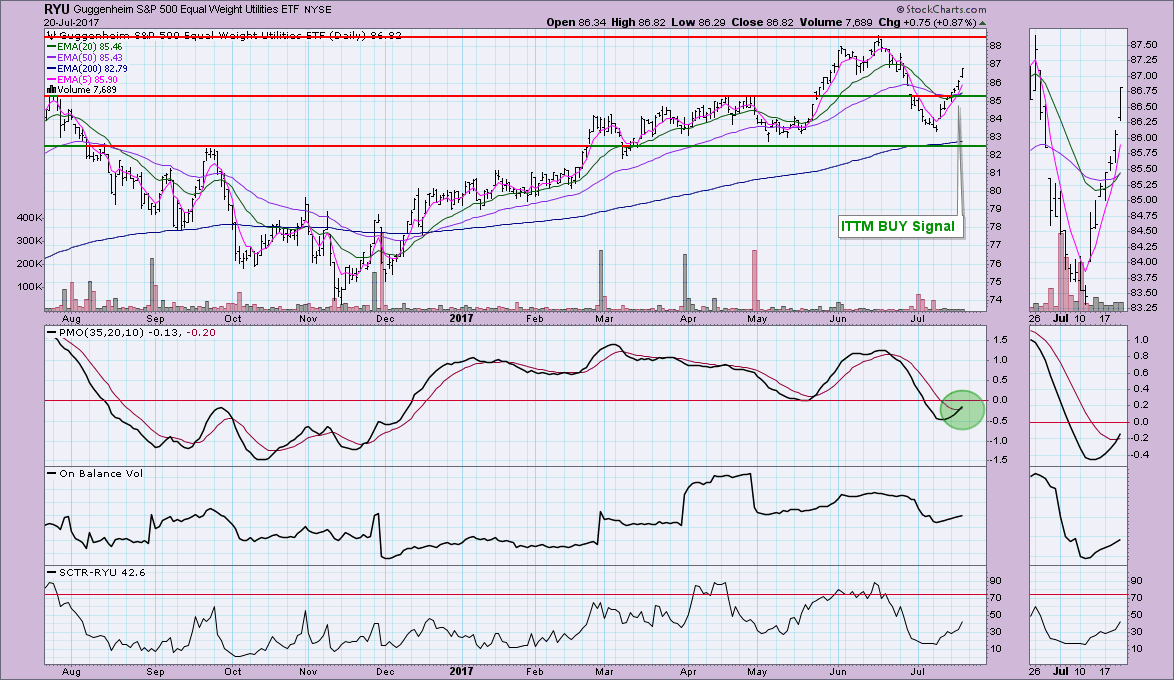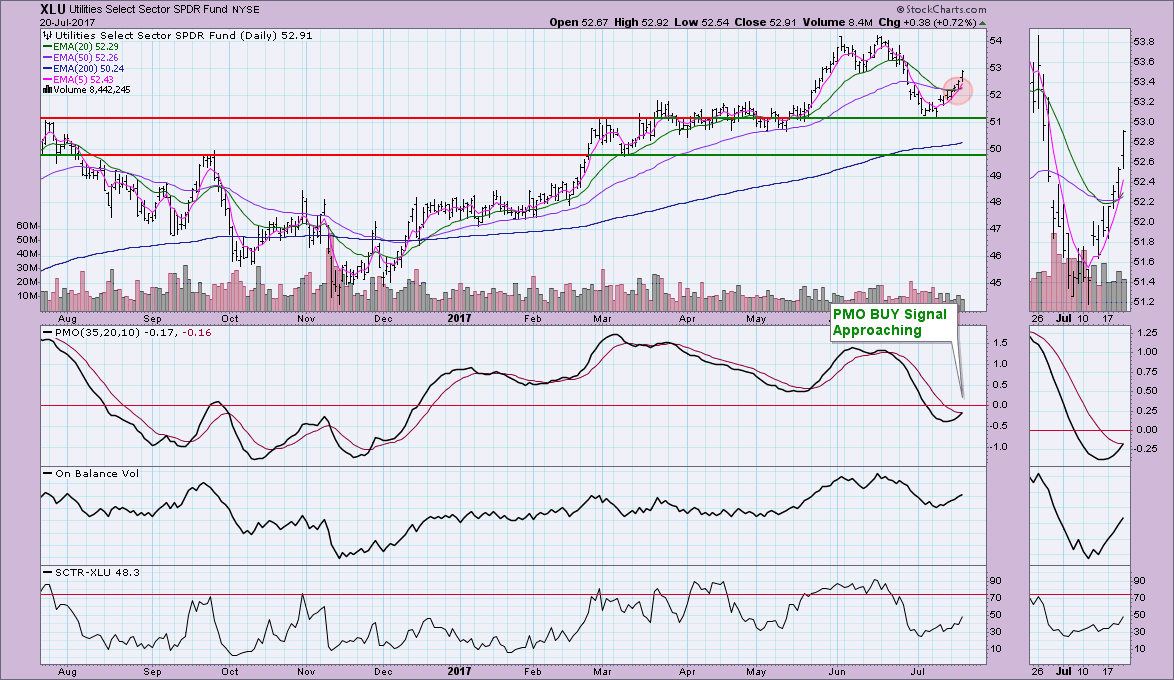
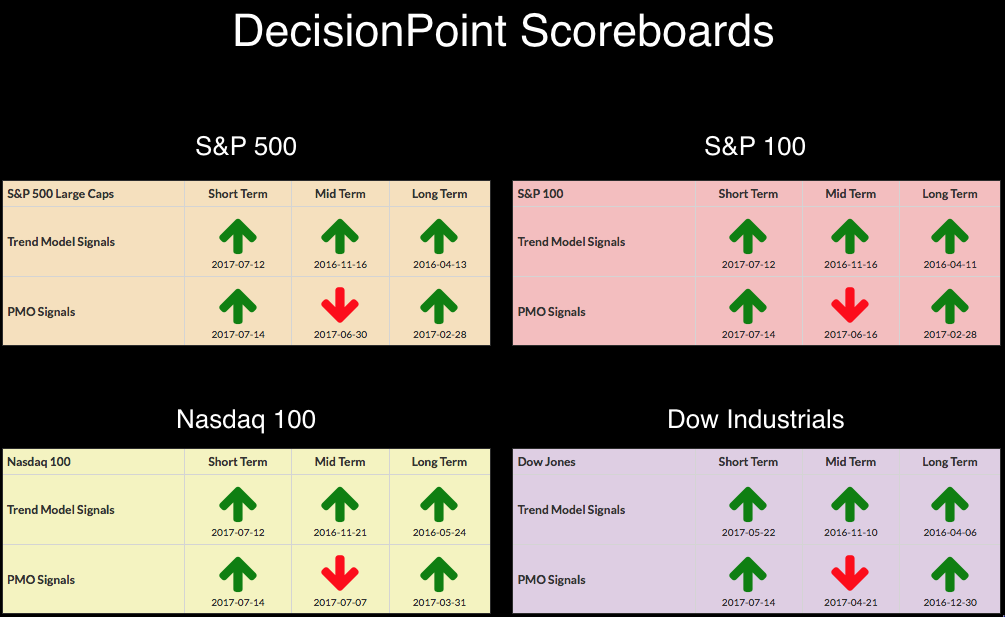
 No new changes on the DecisionPoint Scoreboards although I happen to know there is an intermediate-term PMO BUY signal waiting in the wings on the NDX. That signal will not go final until after Friday's trading. Utilities SPDR (XLU) and the equal-weight Utilities ETF (RYU) both garnered IT Trend Model BUY signals. Gold turned in a PMO BUY signal on the daily chart and TLT managed a new ST Trend Model BUY signal. Where's the bear?
The purpose of the DecisionPoint Alert Daily Update is to quickly review the day's action, internal condition, and Trend Model status of the broad market (S&P 500), the nine SPDR Sectors, the U.S. Dollar, Gold, Crude Oil, and Bonds. To ensure that using this daily reference will be quick and painless, we are as brief as possible, and sometimes we let a chart speak for itself.
SIGNALS: Here we include charts of any important signal changes triggered today by our Intermediate-Term Trend Model.
An IT Trend Model BUY signal is triggered when the 20-EMA crosses above the 50-EMA. Both RYU and XLU have some room to move higher before hitting the next level of strong resistance. I'm looking at $89 for RYU and $54 for XLU. RYU also triggered a PMO BUY signal as the daily PMO crossed above its signal line. XLU is only a day away from the same signal.
NOTE: Mechanical trading model signals define the implied bias of the price index based upon moving average relationships, but they do not necessarily call for a specific action. They are information flags that should prompt chart review. Further, they do not call for continuous buying or selling during the life of the signal. For example, a BUY signal will probably return the best results if action is taken soon after the signal is generated. Additional opportunities for buying may be found as price zigzags higher, but the trader must look for optimum entry points. Conversely, exit points to preserve gains (or minimize losses) may be evident before the model mechanically closes the signal.
STOCKS
IT Trend Model: BUY as of 11/15/2016
LT Trend Model: BUY as of 4/1/2016
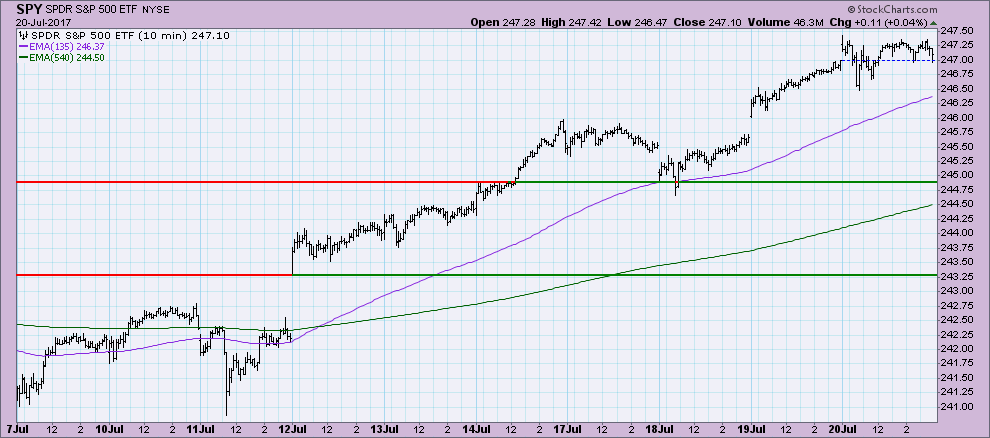
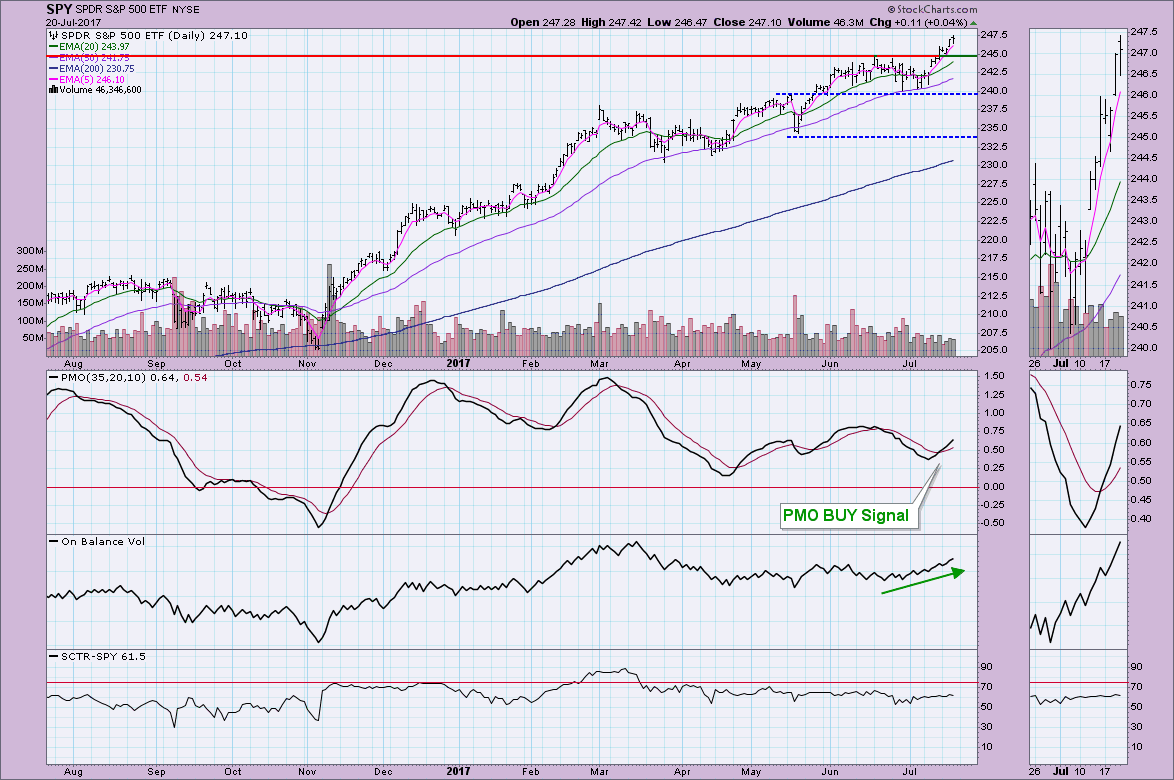
The SPY logged a new intraday all-time high and also managed to close on an all-time high of $247.10. The SPX didn't quite log a closing all-time high, but it did set a new intraday all-time high. Looking at the 10-minute bar chart it seems that price is likely ready to consolidate and take a pause for the short term.
Support at $245 is holding nicely and the continuation of the current rally is encouraging.
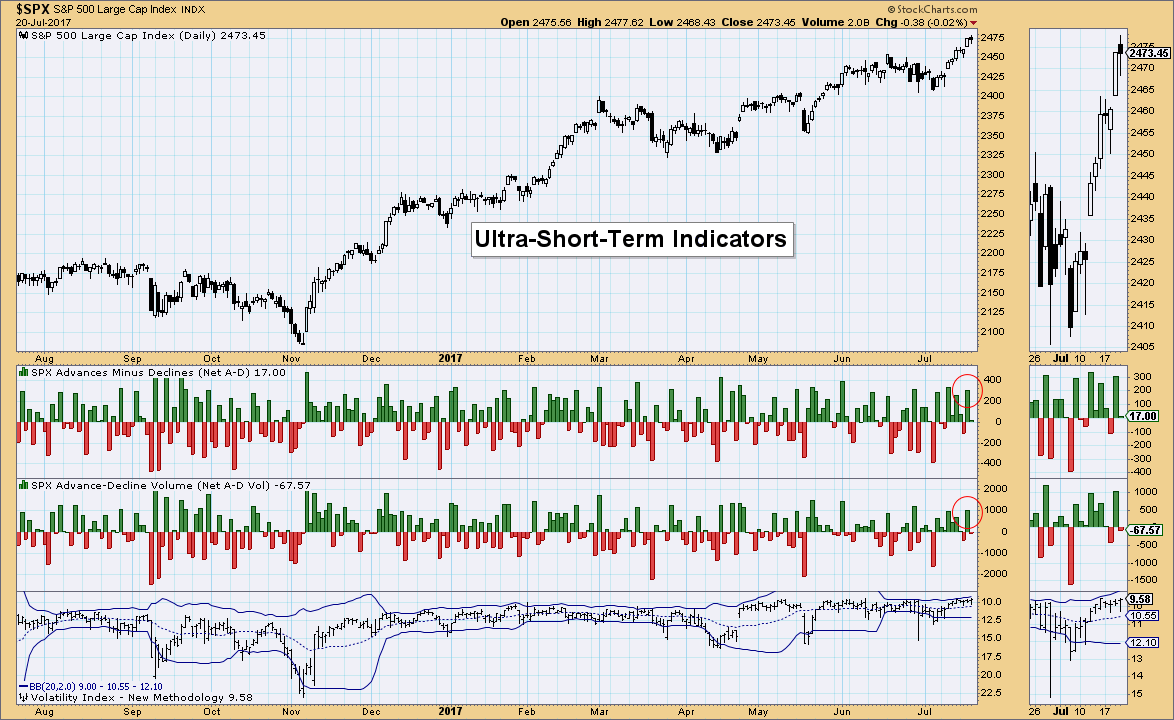
Ultra-Short-Term Indicators: We did see climactic readings yesterday as far as breadth. My first thought would've been this was an exhaustion climax, but the VIX is still steady in low readings and we didn't see a penetration of the VIX Bollinger Band. I still suspect this was a climactic reading and that we should expect a pause or pullback in the very short term.
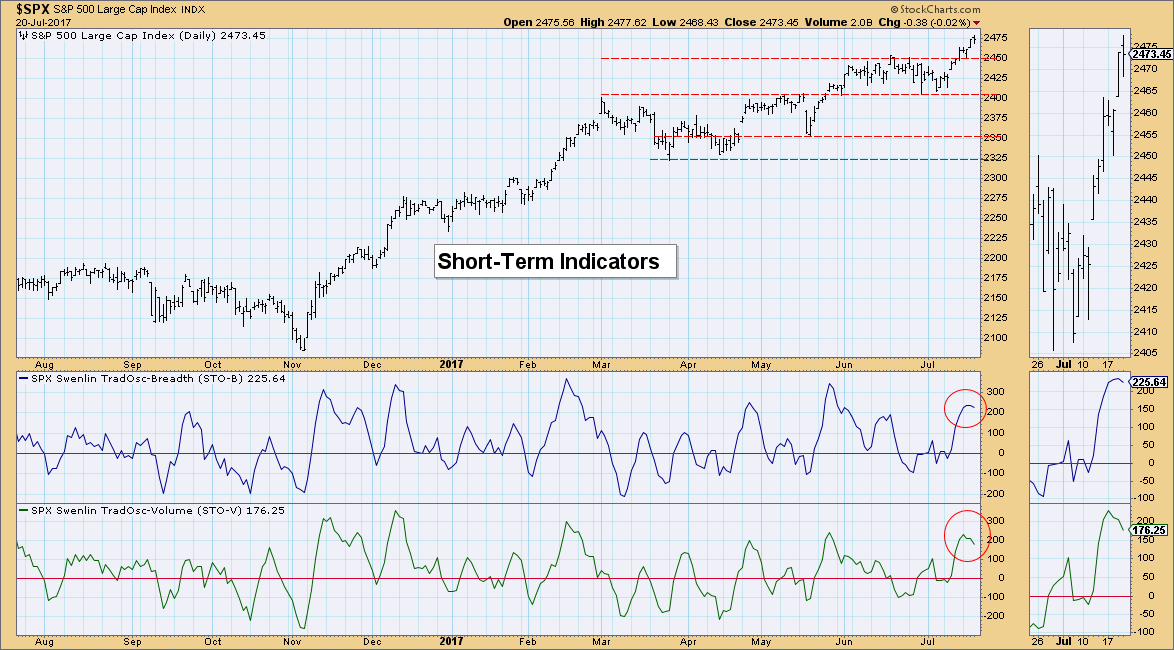
Short-Term Indicators: These indicators also provide evidence that there are problems in the short term. They have topped in somewhat overbought territory and are heading lower with very little "twitch". Previously we've seen overbought readings unwind themselves on consolidation or sideways moves, so this isn't necessarily a doom and gloom call.
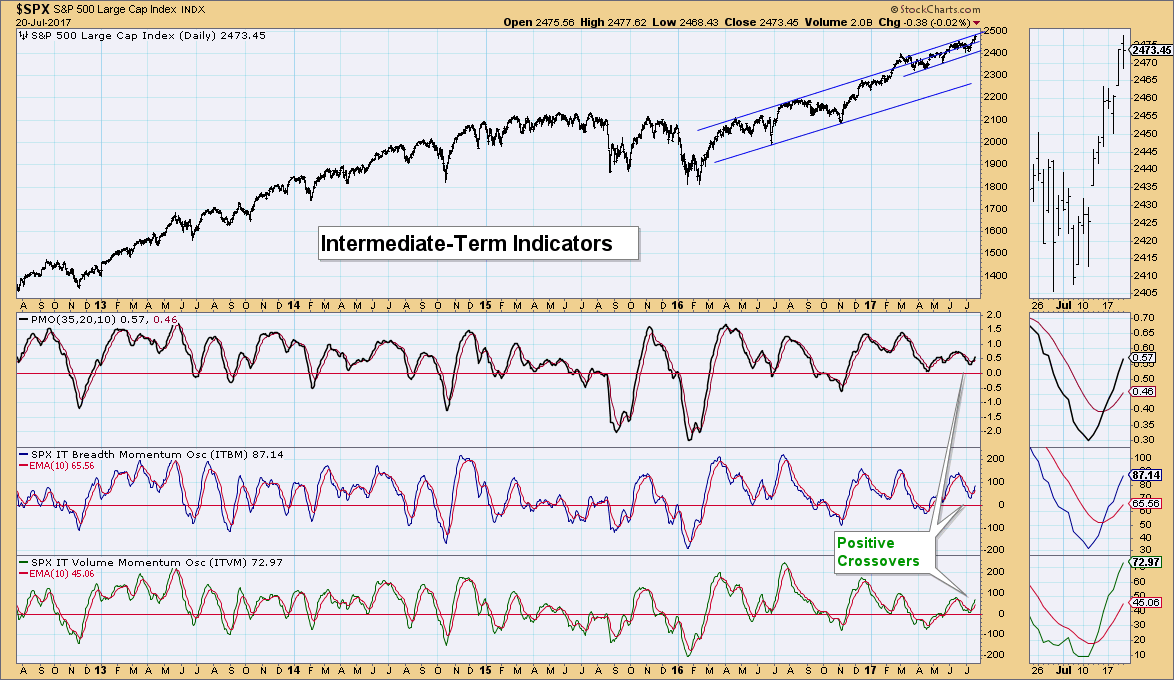
Intermediate-Term Indicators: One reason I'm staying away from "doom and gloom" are these very bullish intermediate-term indicators. The ITBM and ITVM are both rising nicely after bouncing above the zero line. This suggests internal strength in the intermediate term.
Conclusion: I would expect to see some downside or at a minimum consolidation in the next week, maybe two. Intermediate-term indicators are too bullish to look for a correction.
DOLLAR
IT Trend Model: NEUTRAL as of 3/21/2016
LT Trend Model: SELL as of 05/24/2017
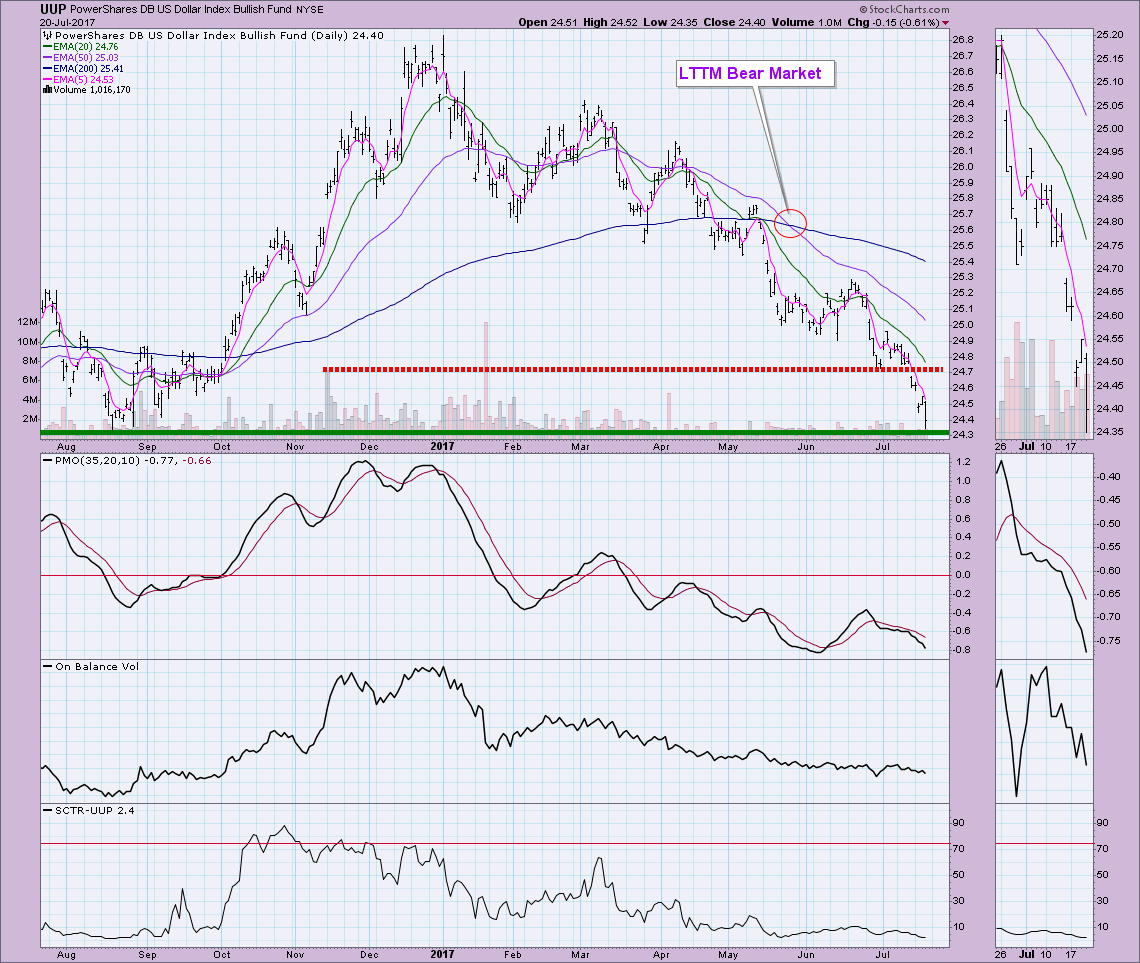
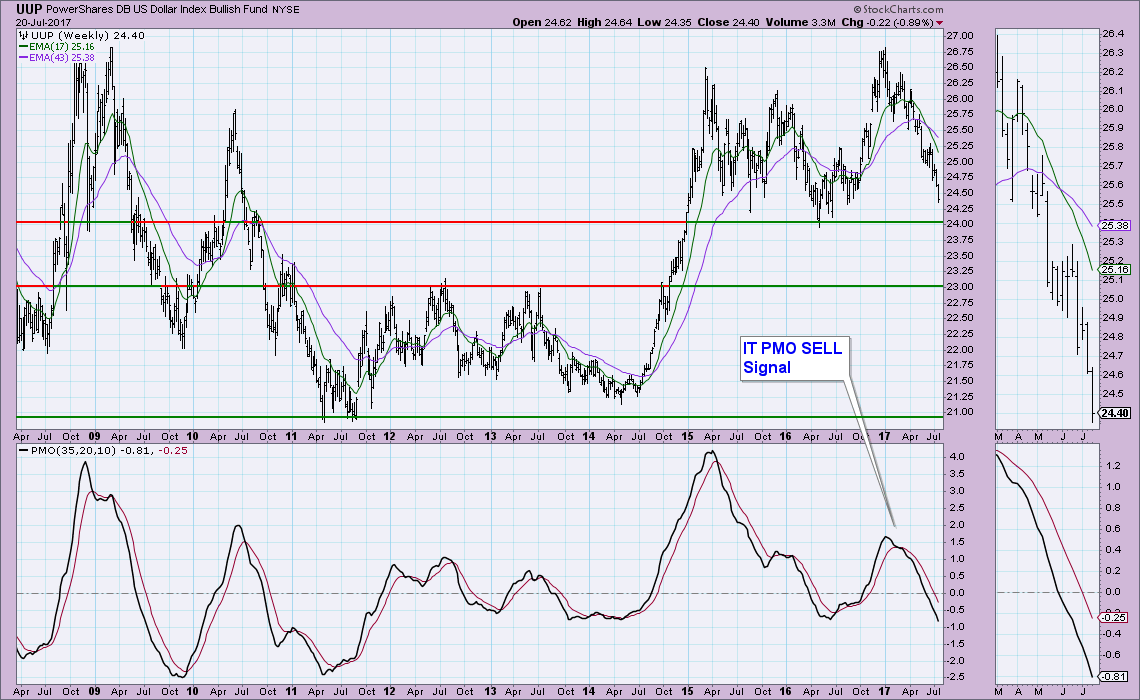
The Dollar continues lower. This is an important area of support right now for UUP. I've included the weekly chart so you can see the significance of this area of horizontal support at $24. The indicators are still very negative so I have to believe this area of support won't hold. In which case, based on the weekly chart, the next level of strong support would be at $23. I've figured out why the Dollar is tanking right now. I'm getting ready to travel to Europe on my honeymoon...the exchange rate has to be horrible or just wouldn't be a trip to Europe for me!
GOLD
IT Trend Model: Neutral as of 6/29/2017
LT Trend Model: BUY as of 4/12/2017
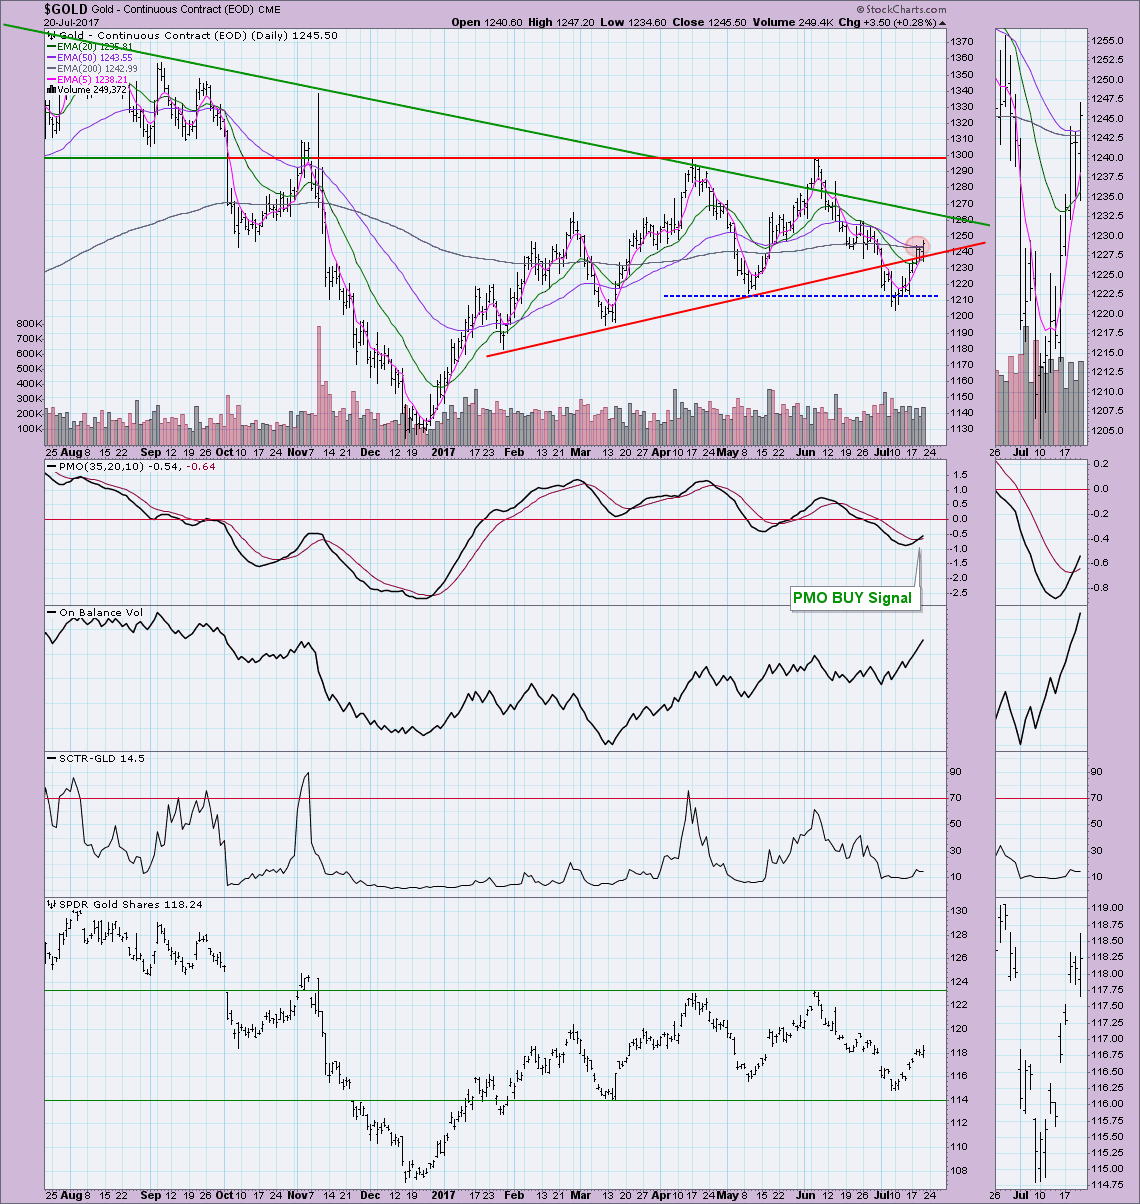
Gold managed to breakout above the rising bottoms trendline drawn from the January bottom. Since breaking above it, price has managed to stay above it. I'm happy to see a new PMO BUY signal and the positive angle on the OBV. I'd feel more confident in my bullish stance on Gold if the SCTR would improve. At this point I'd like to see $1300 hit again for a decisive breakout above long-term declining tops line resistance (green).
CRUDE OIL (USO)
IT Trend Model: NEUTRAL as of 3/8/2017
LT Trend Model: SELL as of 3/9/2017
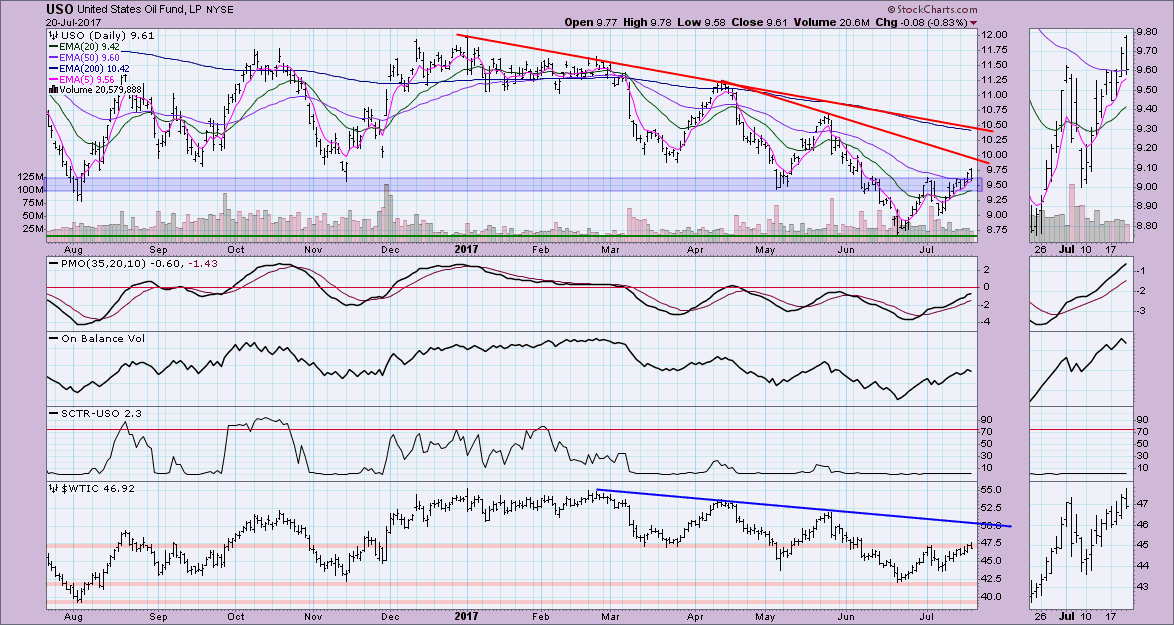
USO has broken out above a rather strong area of overhead resistance. I think you could also make a case for a double-bottom formation. I'm just not thrilled with how price has reacted since the last PMO BUY signal. It triggered near the last price top so its rise hasn't been all that productive. OBV looks pretty good, but the SCTR is still in the cellar.
BONDS (TLT)
IT Trend Model: BUY as of 3/31/2017
LT Trend Model: BUY as of 6/16/2017
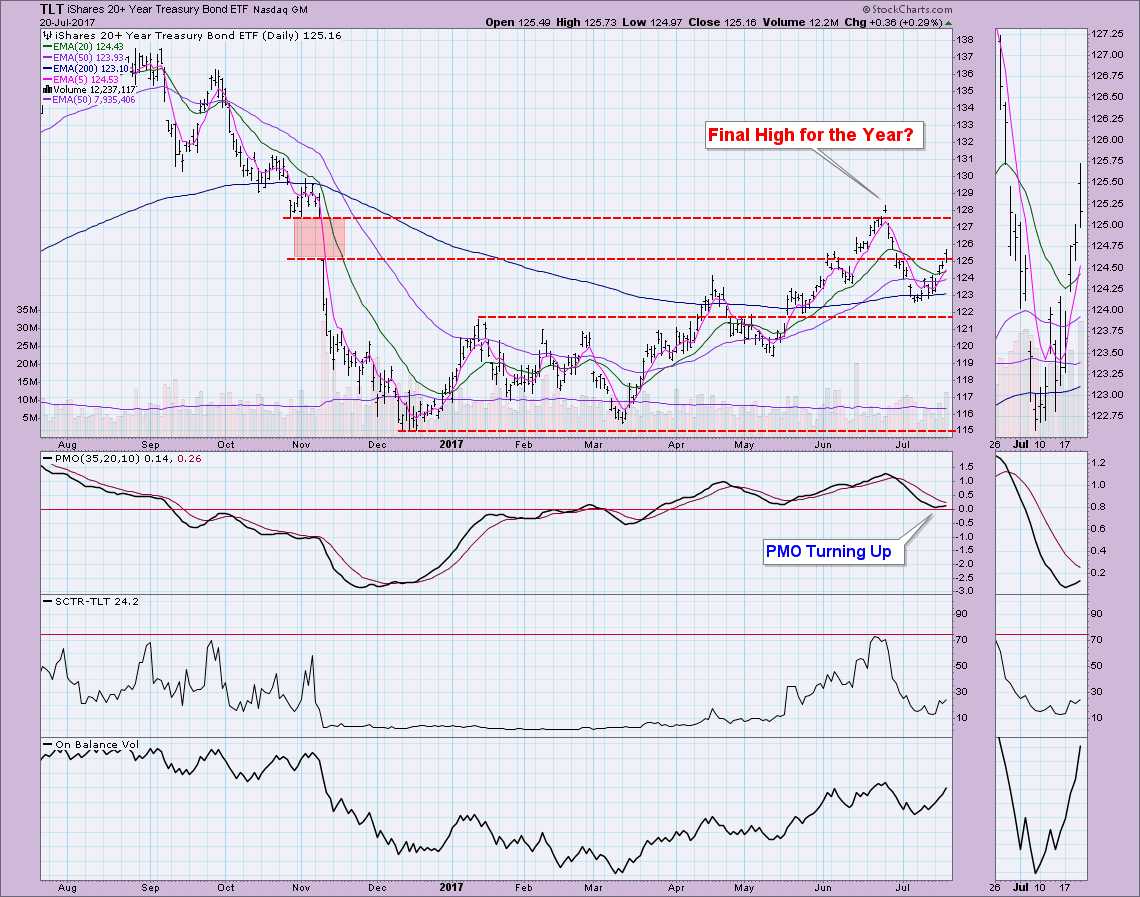
Interestingly, on our Monday MarketWatchers LIVE webinar, we asked the question whether TLT had hit its final high of the year in June. Most were bearish on TLT, and honestly, so was I. However, the chart is really starting to look good. Today a Short-Term Trend Model BUY signal was triggered when the 5-EMA crossed above the 20-EMA. Today we saw a breakout above gap resistance and the PMO has now turned up. The OBV has been supporting this rally, but I would like to see it surpass the June high to set up a positive divergence before I get overly bullish on Bonds.
** Erin will be getting married at the end of the month and will be gone on honeymoon until 8/20. She'll return on 8/21 as Erin Wood **
Helpful DecisionPoint Links:
DecisionPoint Shared ChartList and DecisionPoint Chart Gallery
Price Momentum Oscillator (PMO)
Swenlin Trading Oscillators (STO-B and STO-V)
Technical Analysis is a windsock, not a crystal ball.
Happy Charting!
- Erin
**Don't miss DecisionPoint Commentary! Add your email below to be notified of new updates"**

