In October 1962 I was a 21-year-old B-47 aircraft mechanic in the Strategic Air Command. One morning that month I reported for duty only to find the aircraft ramp covered with bombers loaded with nuclear weapons. Welcome to the Cuban Missile Crisis. It was pretty tense for a few weeks, and we got to DEFCON 2, just one click below the highest level of readiness, DEFCON 1. In hindsight I don't think most people really believed that the 'balloon had actually gone up', and as evidence of that we can see that the stock market took it all pretty well. There was a decline in October 1962, but it was the second bottom of a double bottom that ended the 1961-62 Bear Market. To compare that time with today's trials seems almost ludicrous -- the Cuban Missile Crisis was on a huge scale by comparison -- however, a significant difference is that back then none of the leaders involved on either side could be described as maniacal. The current situation is more unstable, in my opinion, even though we're still at DEFCON 5, because Kin Jong Un is like a comic book villain come to life.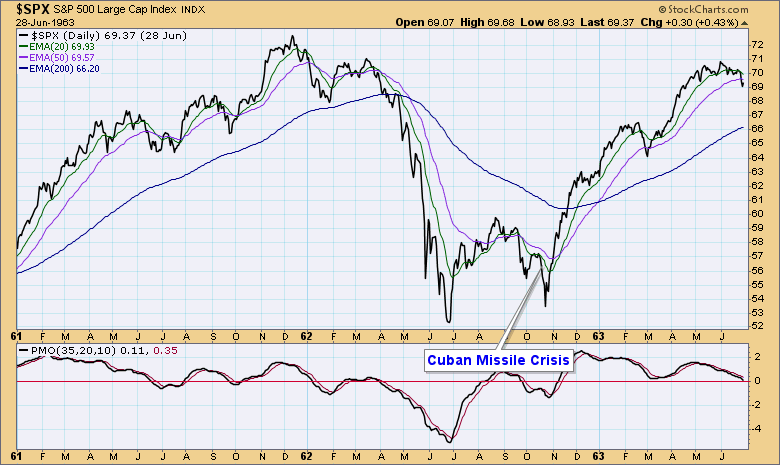
The DecisionPoint Weekly Wrap presents an end-of-week assessment of the trend and condition of the stock market (S&P 500), the U.S. Dollar, Gold, Crude Oil, and Bonds.
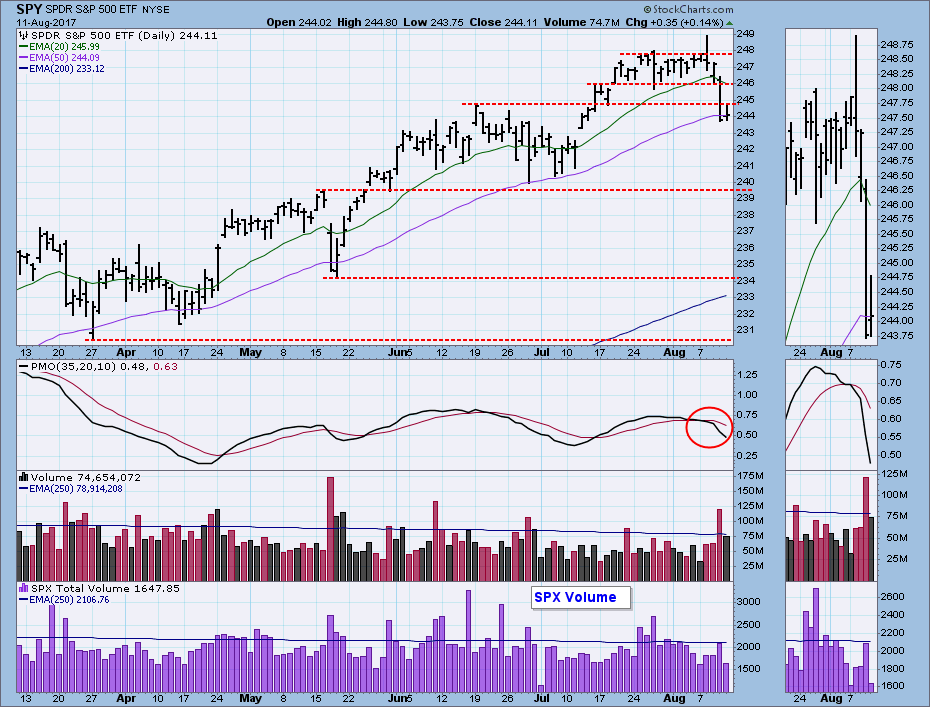
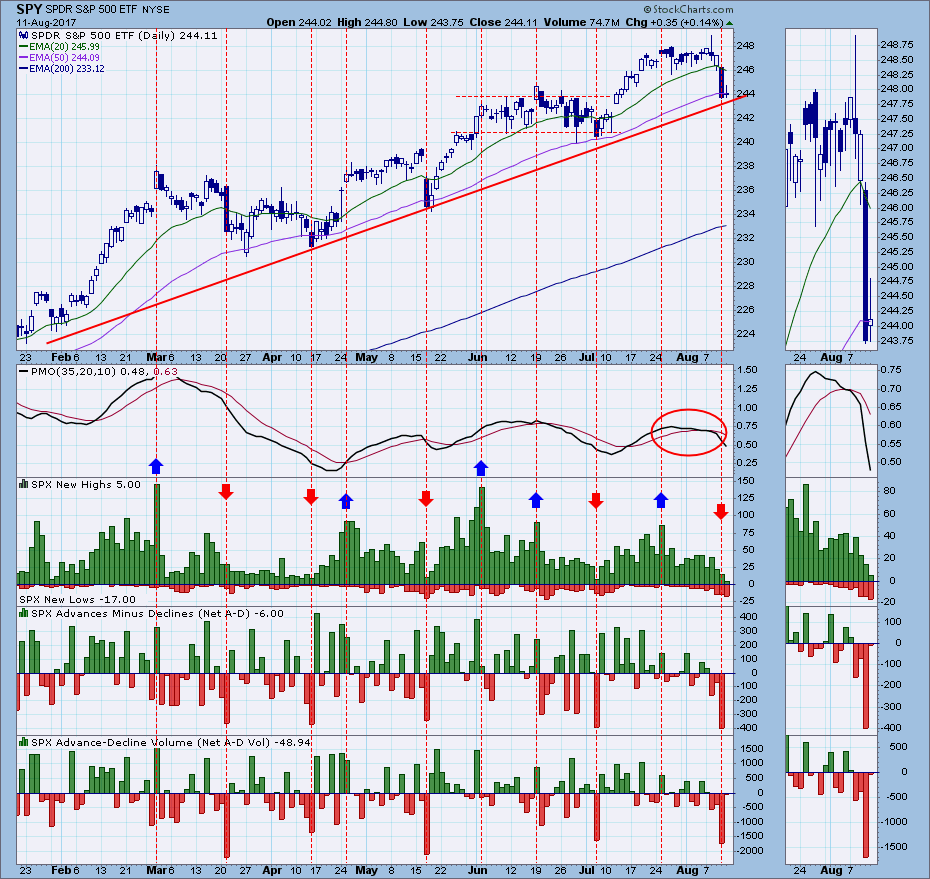
This week on Tuesday the market broke out of the three-week trading range and moved confidently to new, all-time intraday highs; however, volume was substandard, and the breakout collapsed a little after noon eastern time, and price finished the day slightly on the downside. On Wednesday price tested the bottom of the trading range, but, again, it only closed slightly down, remaining in the upper half of the trading range. Finally, on Thursday price broke down through two support levels and closed near the day's low. The cause of this breakdown was attributed to the tensions with North Korea, but I don't agree with that conclusion. NoKo is a contributing factor, I have no doubt, but we were looking for a correction anyway.
STOCKS
IT Trend Model: BUY as of 11/15/2016
LT Trend Model: BUY as of 4/1/2016
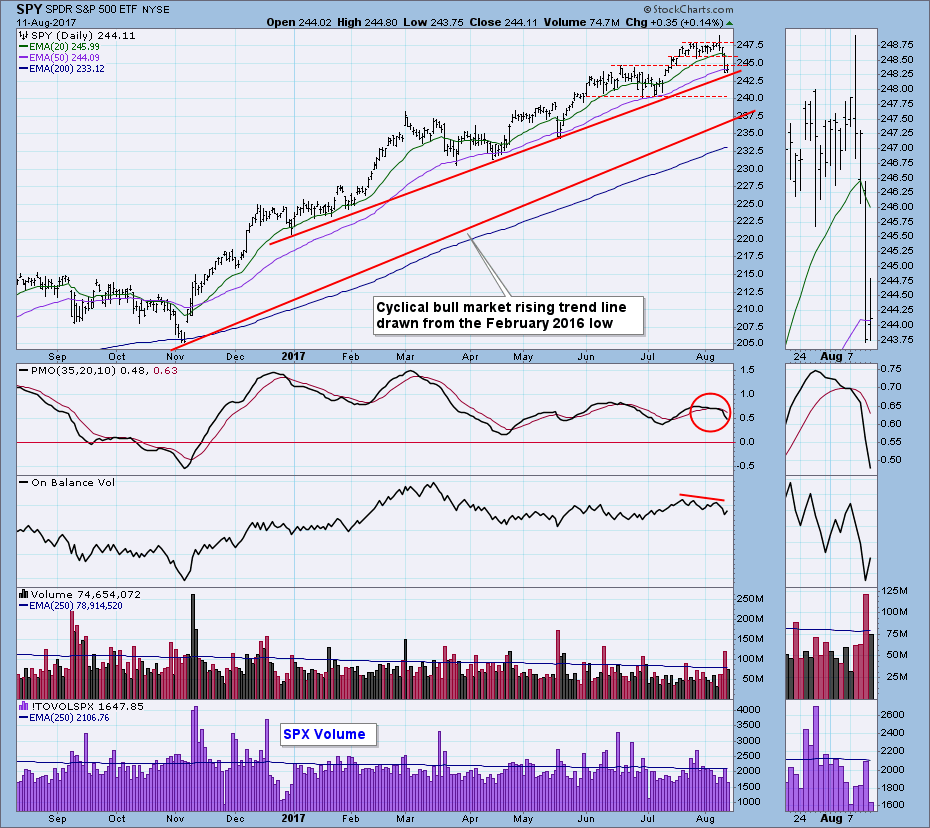
So far price has only corrected back to the secondary trend line that has dominated the pattern since January. If NoKo were really an issue for the market, I would expect more than just a few percentage points of pullback. How about all the way back to the cyclical bull market trend line?
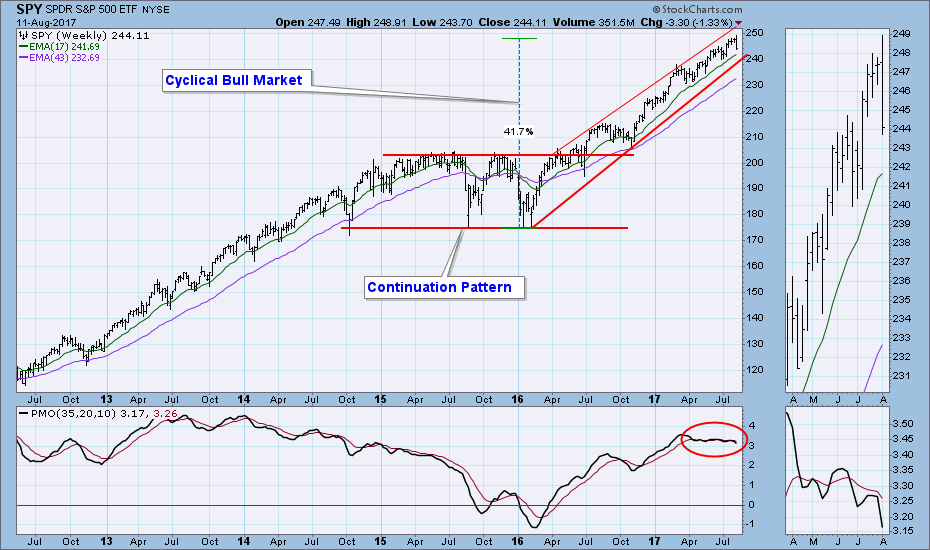
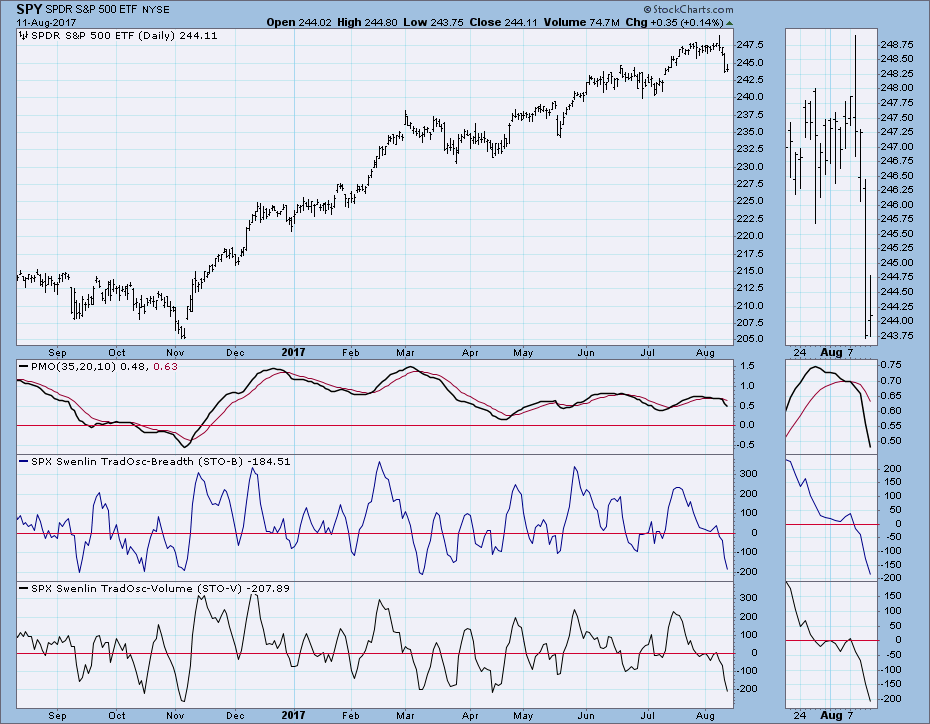
The weekly chart shows the market to be about midway its rising trend channel. The weekly PMO is slightly negative.
Climactic Indicators: On Thursday there were climactic downside readings on Net Advances-Declines and Net Advance-Decline Volume. Coincidentally, price was very close to support on the rising trend line. I have annotated similar climaxes (down-pointing red arrows), and most of them marked the end of the selling. An important caveat is that this chart only shows bull market examples.
Short-Term Market Indicators: These indicators are getting fairly oversold, and they support the idea of a rally in this time frame.
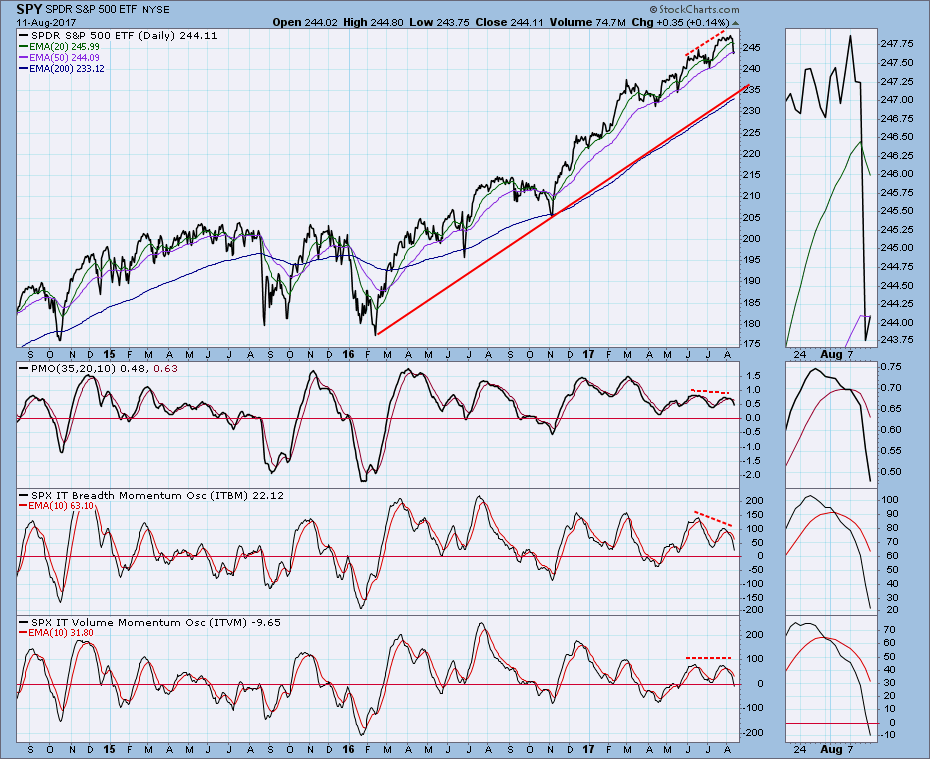
Intermediate-Term Market Indicators: These indicators are about neutral. They can accommodate significant price movement in either direction, but they are falling, so I would say that the bears have a modest advantage.
Conclusion: From Tuesday's high to Thursday's low the market fell a mere -2.1%. No serious technical damage has been done, and rising trend lines remain intact. So far the market shows little concern with the Korean crisis. That could change in a heartbeat, but at present it is not weighing heavily on the market. I would like for the correction to continue for a while, but honestly, we may have just hit bottom.
DOLLAR
IT Trend Model: NEUTRAL as of 3/21/2016
LT Trend Model: SELL as of 5/24/2017
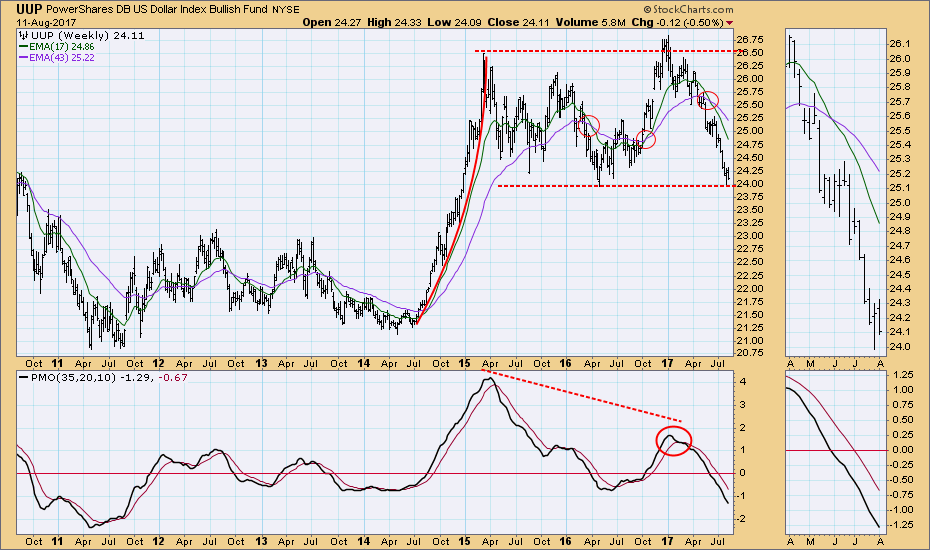
UUP attempted to breakout above the declining tops line this week, but the attempt failed.
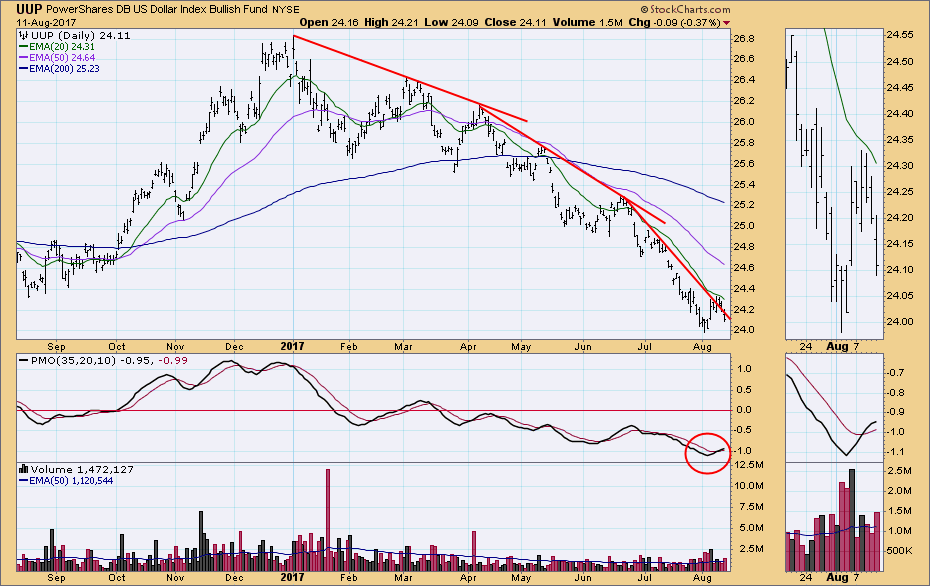 On the weekly chart UUP has bounced off the long-term support line, but it hasn't broken its down trend.
GOLD
IT Trend Model: BUY as of 7/31/2017
LT Trend Model: BUY as of 4/12/2017
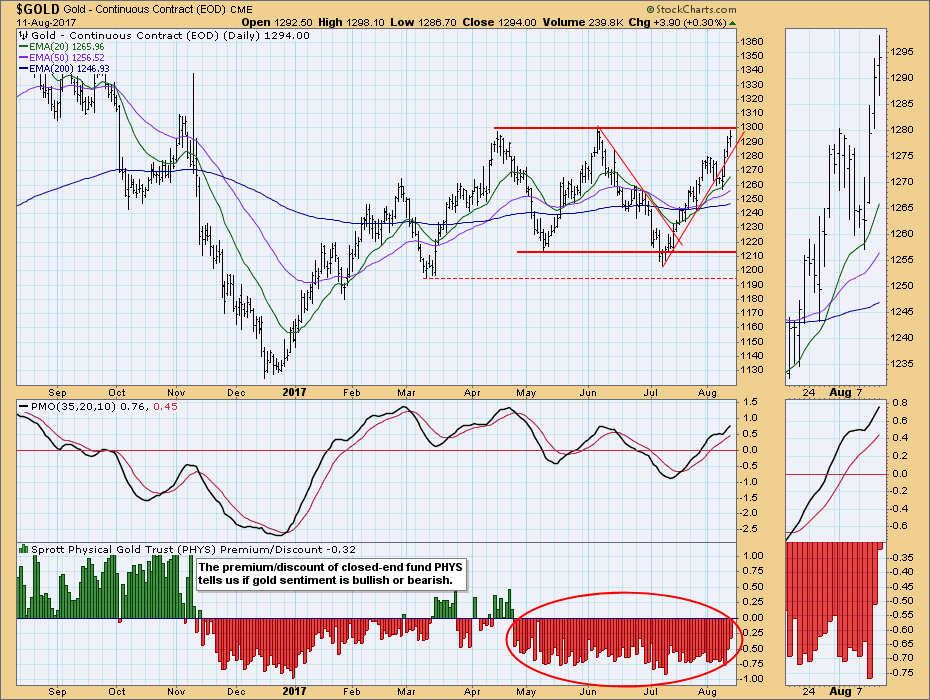
Last week gold had violated the rising trend line and I assumed it had begun a new down trend. But this week it was rescued by the NoKo situation, and it managed to get back above the rising trend line and reach the top of the trading range. Reacting to crises is kind of what gold does, and it had to wring some gains out of NoKo, but I don't find the move very impressive. Sentiment is still bearish, which means that not even NoKo can generate any enthusiasm for gold.
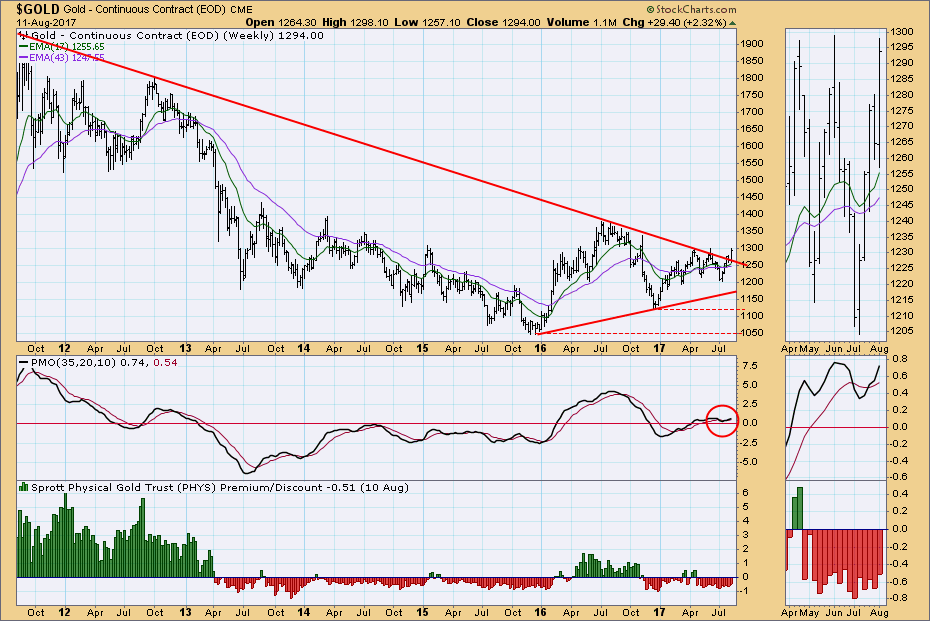
On the weekly chart we can see where gold broke above the long-term declining tops line. The picture is improving.
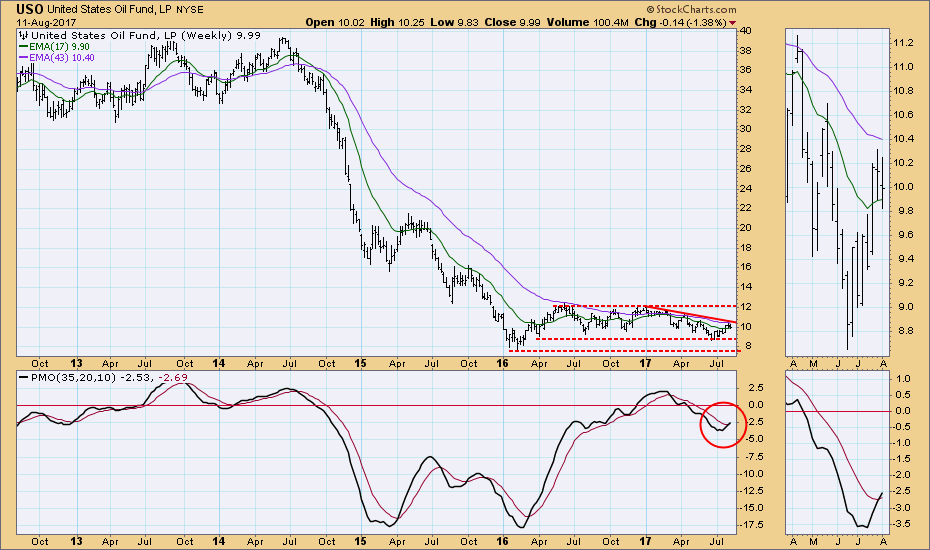
CRUDE OIL (USO)
IT Trend Model: BUY as of 8/1/2017
LT Trend Model: SELL as of 3/9/2017
For a few weeks I have been thinking that USO was consolidating in preparation for breaking above the declining tops line and 200EMA, but Friday it slipped enough for the PMO to turn down. Maybe that breakout isn't going to happen.
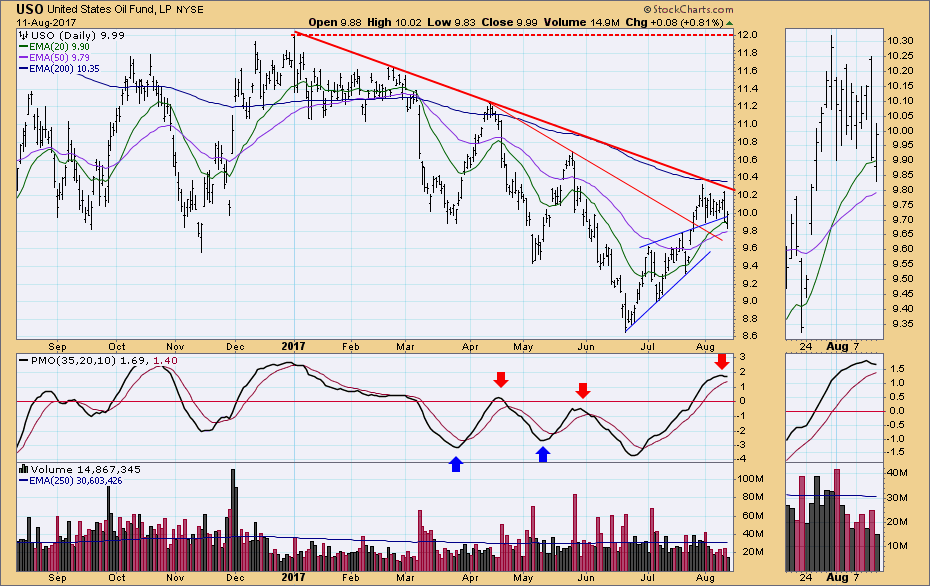
The USO weekly PMO crossed up through its signal line, generating a weekly PMO BUY signal. That is encouraging, but we can see how the declining tops line is holding price down within the trading channel.
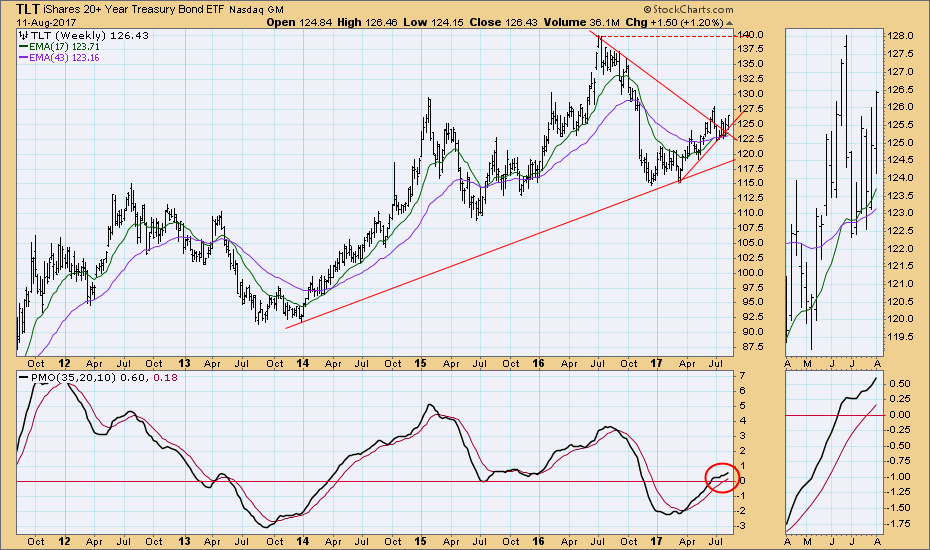
BONDS (TLT)
IT Trend Model: BUY as of 3/31/2017
LT Trend Model: BUY as of 6/16/2017
TLT is not putting on the most enthusiastic rally I have ever seen, but the picture is positive.
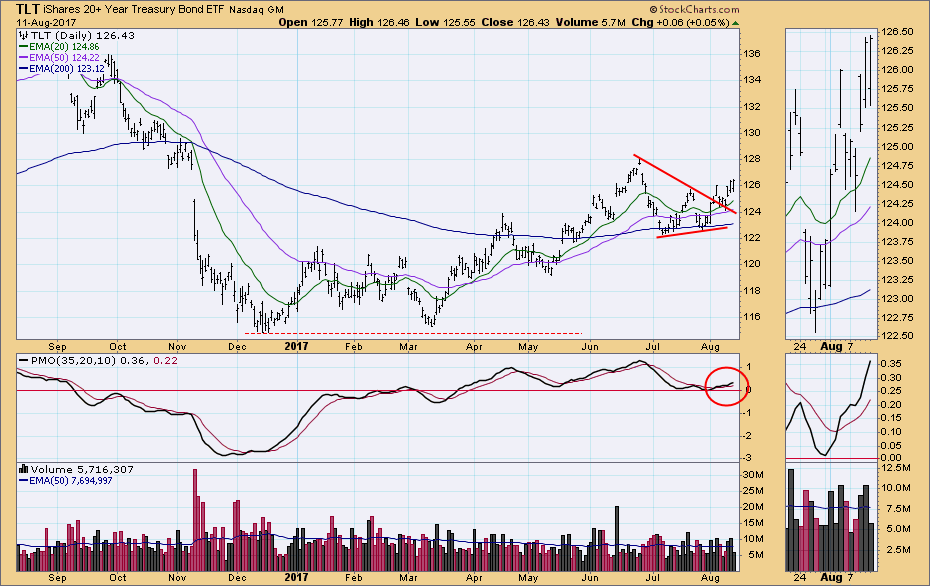
There is plenty of room to the upside before the obvious overhead resistance is encountered.
**Don't miss the DecisionPoint Alert Commentary! Go to the "Notify Me" box toward the end of this blog page to be notified as soon as it is published.**
Technical Analysis is a windsock, not a crystal ball.
Happy Charting!
- Carl
NOTE: The signal status reported herein is based upon mechanical trading model signals, specifically, the DecisionPoint Trend Model. They define the implied bias of the price index based upon moving average relationships, but they do not necessarily call for a specific action. They are information flags that should prompt chart review. Further, they do not call for continuous buying or selling during the life of the signal. For example, a BUY signal will probably (but not necessarily) return the best results if action is taken soon after the signal is generated. Additional opportunities for buying may be found as price zigzags higher, but the trader must look for optimum entry points. Conversely, exit points to preserve gains (or minimize losses) may be evident before the model mechanically closes the signal.
Helpful DecisionPoint Links:
DecisionPoint Shared ChartList and DecisionPoint Chart Gallery
Price Momentum Oscillator (PMO)
Swenlin Trading Oscillators (STO-B and STO-V)


