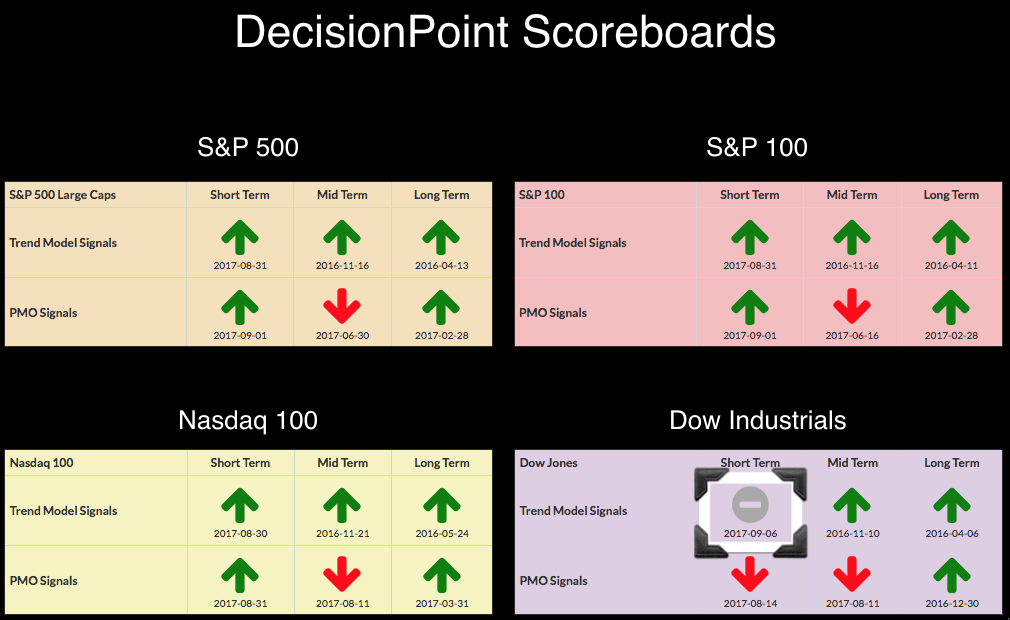
 My email inbox presented two new important signals. First is the Intermediate-Term Trend Model (ITTM) BUY signal for USO. We've been watching it as it managed to find support and rallied strongly. Second is the Short-Term Trend Model (STTM) Neutral signal on the Dow Industrials. I've updated the DecisionPoint Scoreboard Summary below:

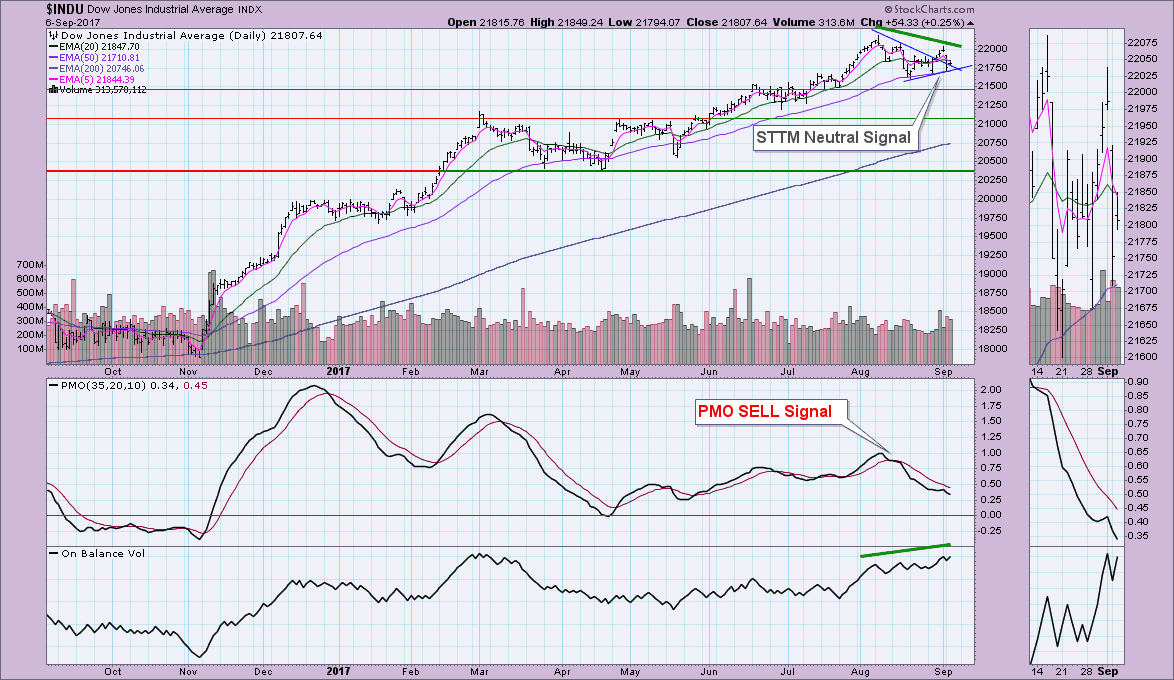
A STTM Neutral signal is generated when the 5-EMA crosses below the 20-EMA while the 20-EMA is above the 50-EMA (if the 20-EMA is below the 50-EMA at the time of the crossover, then it is a STTM SELL signal). The Dow chart certainly has some bearish characteristics. Not only do we have a new STTM Neutral signal, but we have an accelerating PMO headed lower. Good news is that we have a nice OBV positive divergence and support along the short-term rising bottoms line is holding.
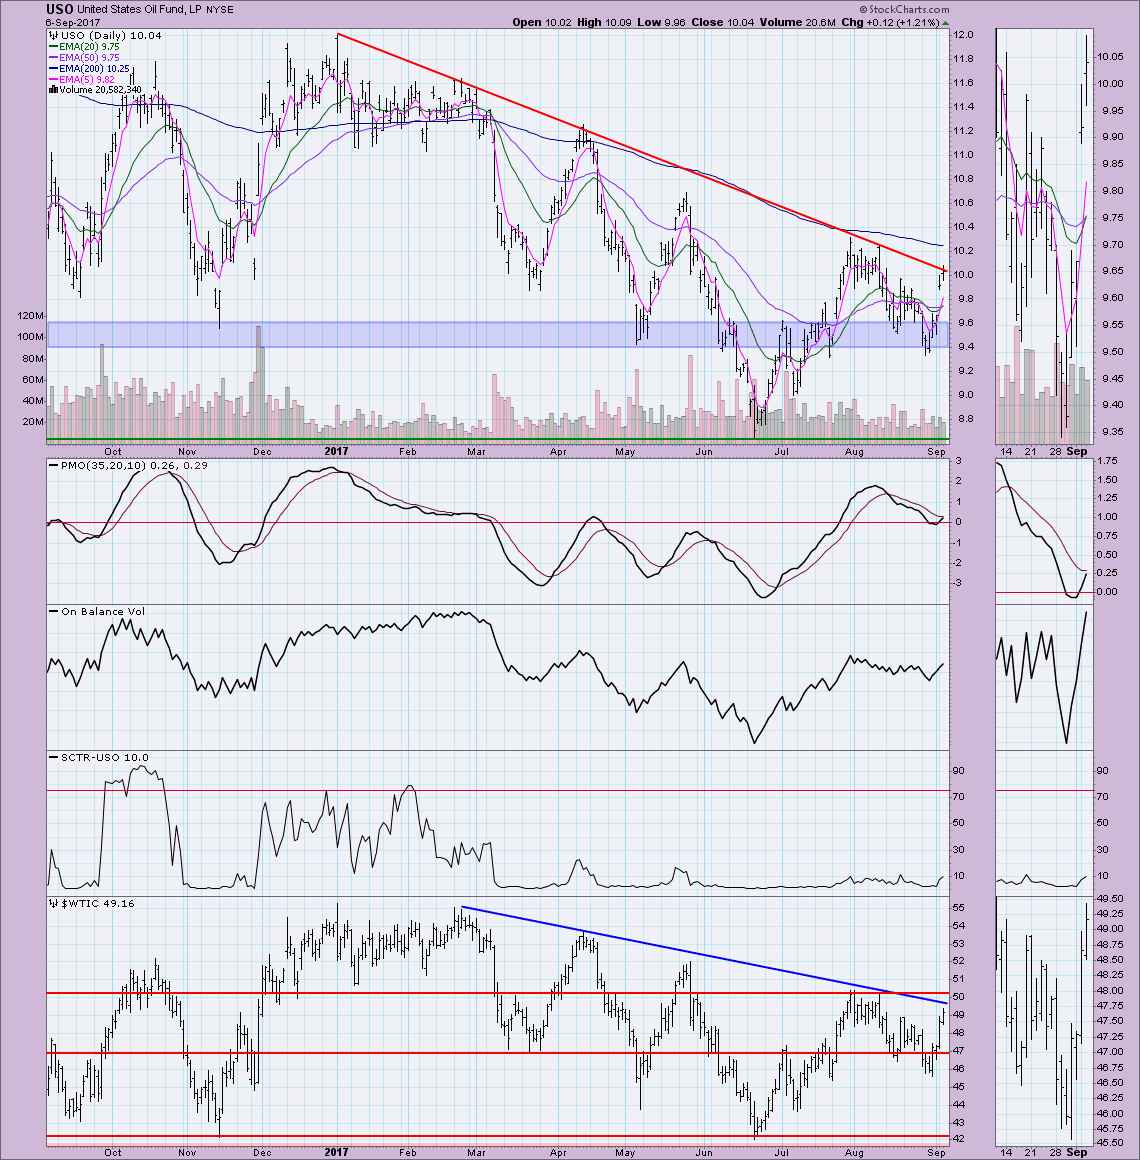
This chart has begun to look better and better; however, I have been burned plenty using USO as a short-term investment (pun not intended). Because of this, I wouldn't be completely comfortable with USO until we see a strong close above declining tops line resistance and an actual PMO crossover BUY signal. The OBV is starting to look good with the latest reading above previous tops. I'm worried about the BUY signals on the ST and LT Trend Models holding. All three EMAs are braiding and this can cause whipsaw. I'm just a bit concerned that we have a false breakout lining up similar to late July's ITTM BUY signal. The big difference between then and now is the more favorable set-up of the PMO. In late July when the ITTM BUY signal appeared, the PMO was rising but beginning to decelerate. This time the PMO is turning up just above the zero line which suggests internal strength.
Helpful DecisionPoint Links:
DecisionPoint Shared ChartList and DecisionPoint Chart Gallery
Price Momentum Oscillator (PMO)
Swenlin Trading Oscillators (STO-B and STO-V)
Technical Analysis is a windsock, not a crystal ball.
Happy Charting!
- Erin
**Don't miss DecisionPoint Commentary! Add your email below to be notified of new updates"**


